
|
|||||
|
 | |
| |
| |
| |
| |
| |
|
Gene: IPO5 |
Gene summary for IPO5 |
| Gene information | Species | Human | Gene symbol | IPO5 | Gene ID | 3843 |
| Gene name | importin 5 | |
| Gene Alias | IMB3 | |
| Cytomap | 13q32.2 | |
| Gene Type | protein-coding | GO ID | GO:0000079 | UniProtAcc | B3KWG6 |
Top |
Malignant transformation analysis |
| Identification of the aberrant gene expression in precancerous and cancerous lesions by comparing the gene expression of stem-like cells in diseased tissues with normal stem cells |
| Entrez ID | Symbol | Replicates | Species | Organ | Tissue | Adj P-value | Log2FC | Malignancy |
| 3843 | IPO5 | HTA11_99999965104_69814 | Human | Colorectum | MSS | 5.05e-12 | 7.46e-01 | 0.281 |
| 3843 | IPO5 | HTA11_99999971662_82457 | Human | Colorectum | MSS | 6.95e-14 | 5.96e-01 | 0.3859 |
| 3843 | IPO5 | A015-C-203 | Human | Colorectum | FAP | 5.52e-05 | -1.27e-01 | -0.1294 |
| 3843 | IPO5 | A002-C-205 | Human | Colorectum | FAP | 3.12e-03 | -6.77e-02 | -0.1236 |
| 3843 | IPO5 | A002-C-114 | Human | Colorectum | FAP | 1.25e-04 | -2.00e-01 | -0.1561 |
| 3843 | IPO5 | A015-C-104 | Human | Colorectum | FAP | 5.58e-06 | -1.28e-01 | -0.1899 |
| 3843 | IPO5 | A002-C-016 | Human | Colorectum | FAP | 1.23e-06 | -1.25e-01 | 0.0521 |
| 3843 | IPO5 | A002-C-116 | Human | Colorectum | FAP | 2.10e-05 | -5.46e-02 | -0.0452 |
| 3843 | IPO5 | A018-E-020 | Human | Colorectum | FAP | 6.41e-03 | -1.24e-01 | -0.2034 |
| 3843 | IPO5 | F034 | Human | Colorectum | FAP | 1.78e-02 | -4.45e-02 | -0.0665 |
| 3843 | IPO5 | CRC-1-8810 | Human | Colorectum | CRC | 8.86e-08 | 3.09e-01 | 0.6257 |
| 3843 | IPO5 | LZE2T | Human | Esophagus | ESCC | 8.35e-07 | 4.21e-01 | 0.082 |
| 3843 | IPO5 | LZE4T | Human | Esophagus | ESCC | 5.38e-11 | 7.69e-02 | 0.0811 |
| 3843 | IPO5 | LZE5T | Human | Esophagus | ESCC | 2.80e-02 | 2.34e-01 | 0.0514 |
| 3843 | IPO5 | LZE7T | Human | Esophagus | ESCC | 4.45e-07 | 4.93e-01 | 0.0667 |
| 3843 | IPO5 | LZE8T | Human | Esophagus | ESCC | 9.93e-07 | 5.48e-02 | 0.067 |
| 3843 | IPO5 | LZE20T | Human | Esophagus | ESCC | 1.85e-03 | -1.77e-03 | 0.0662 |
| 3843 | IPO5 | LZE24T | Human | Esophagus | ESCC | 2.16e-14 | 1.90e-01 | 0.0596 |
| 3843 | IPO5 | P1T-E | Human | Esophagus | ESCC | 7.18e-03 | 1.84e-01 | 0.0875 |
| 3843 | IPO5 | P2T-E | Human | Esophagus | ESCC | 2.20e-19 | 3.29e-01 | 0.1177 |
| Page: 1 2 3 4 5 6 7 |
| Tissue | Expression Dynamics | Abbreviation |
| Colorectum (GSE201348) |  | FAP: Familial adenomatous polyposis |
| CRC: Colorectal cancer | ||
| Colorectum (HTA11) |  | AD: Adenomas |
| SER: Sessile serrated lesions | ||
| MSI-H: Microsatellite-high colorectal cancer | ||
| MSS: Microsatellite stable colorectal cancer | ||
| Esophagus |  | ESCC: Esophageal squamous cell carcinoma |
| HGIN: High-grade intraepithelial neoplasias | ||
| LGIN: Low-grade intraepithelial neoplasias | ||
| Liver | 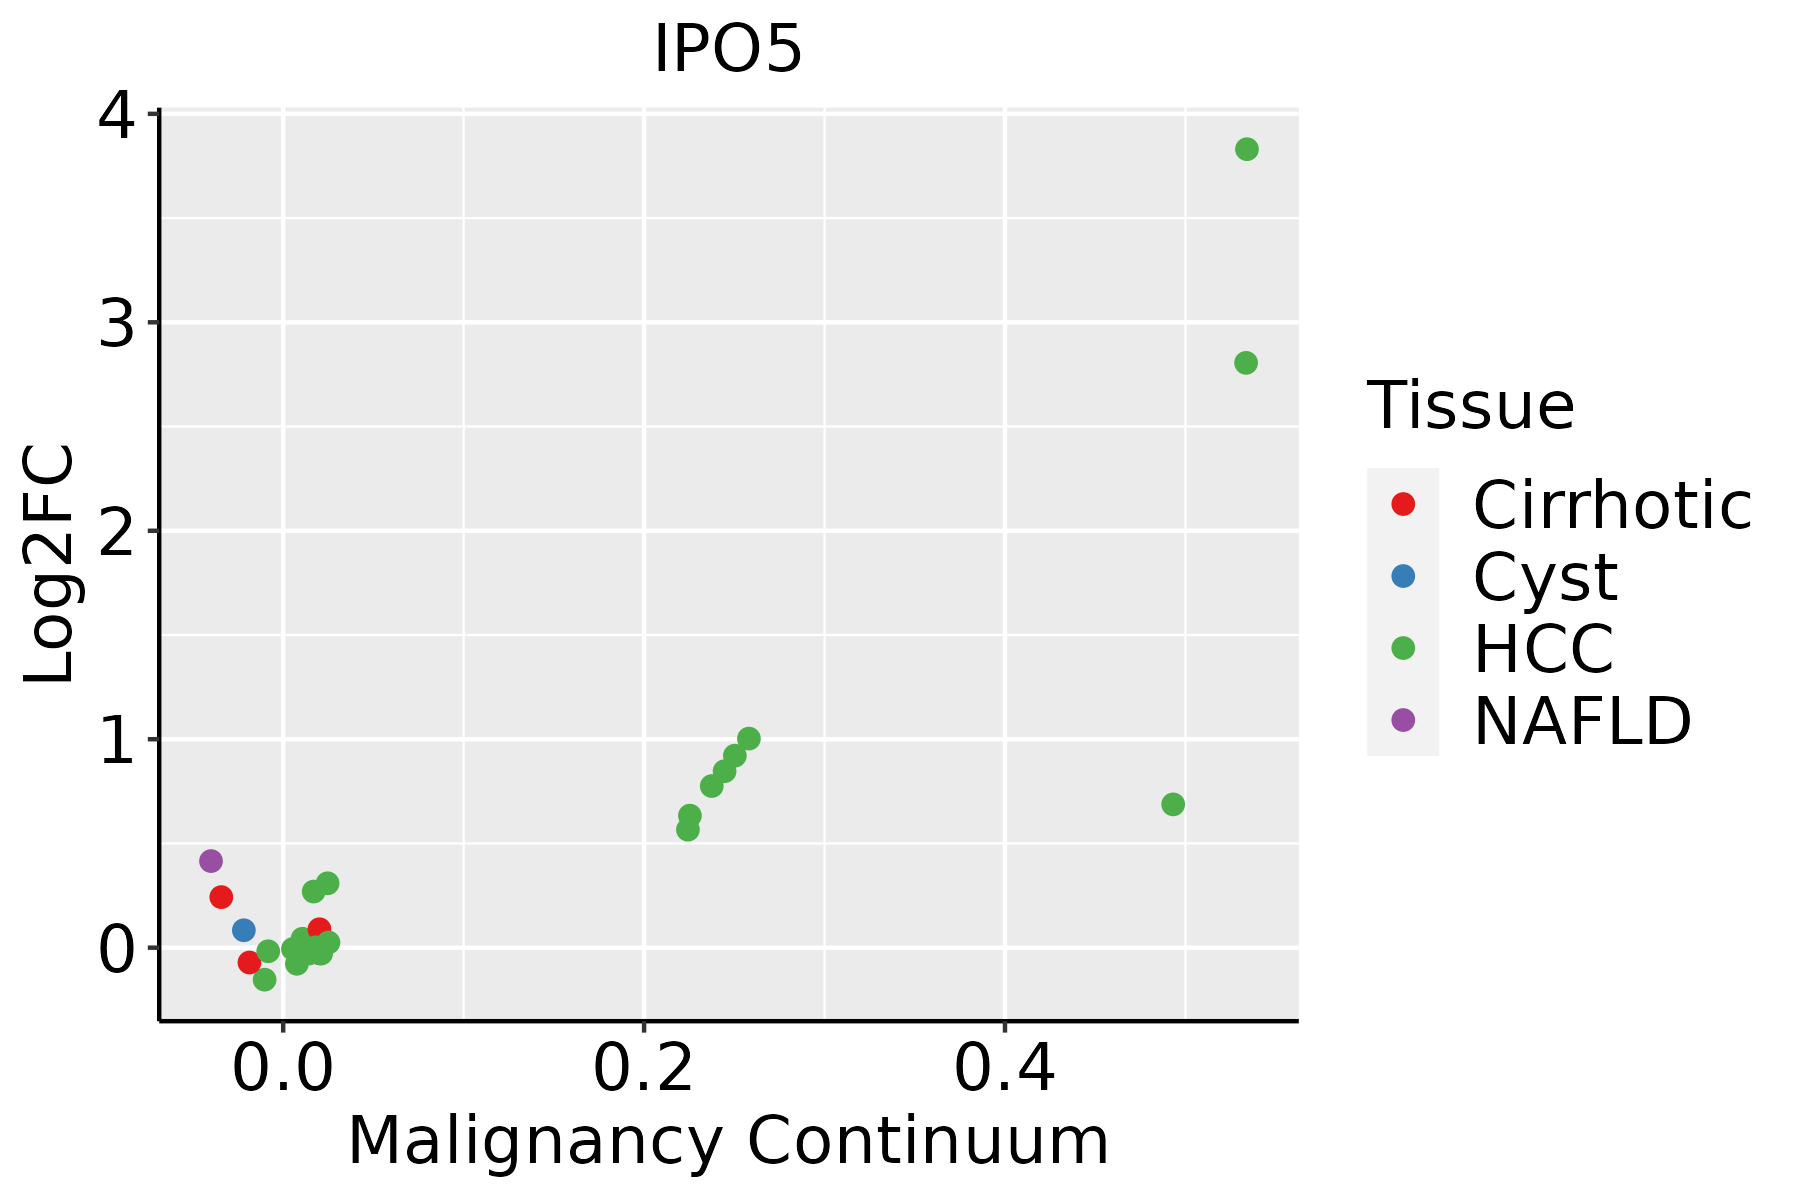 | HCC: Hepatocellular carcinoma |
| NAFLD: Non-alcoholic fatty liver disease | ||
| Oral Cavity |  | EOLP: Erosive Oral lichen planus |
| LP: leukoplakia | ||
| NEOLP: Non-erosive oral lichen planus | ||
| OSCC: Oral squamous cell carcinoma | ||
| Prostate |  | BPH: Benign Prostatic Hyperplasia |
| Skin | 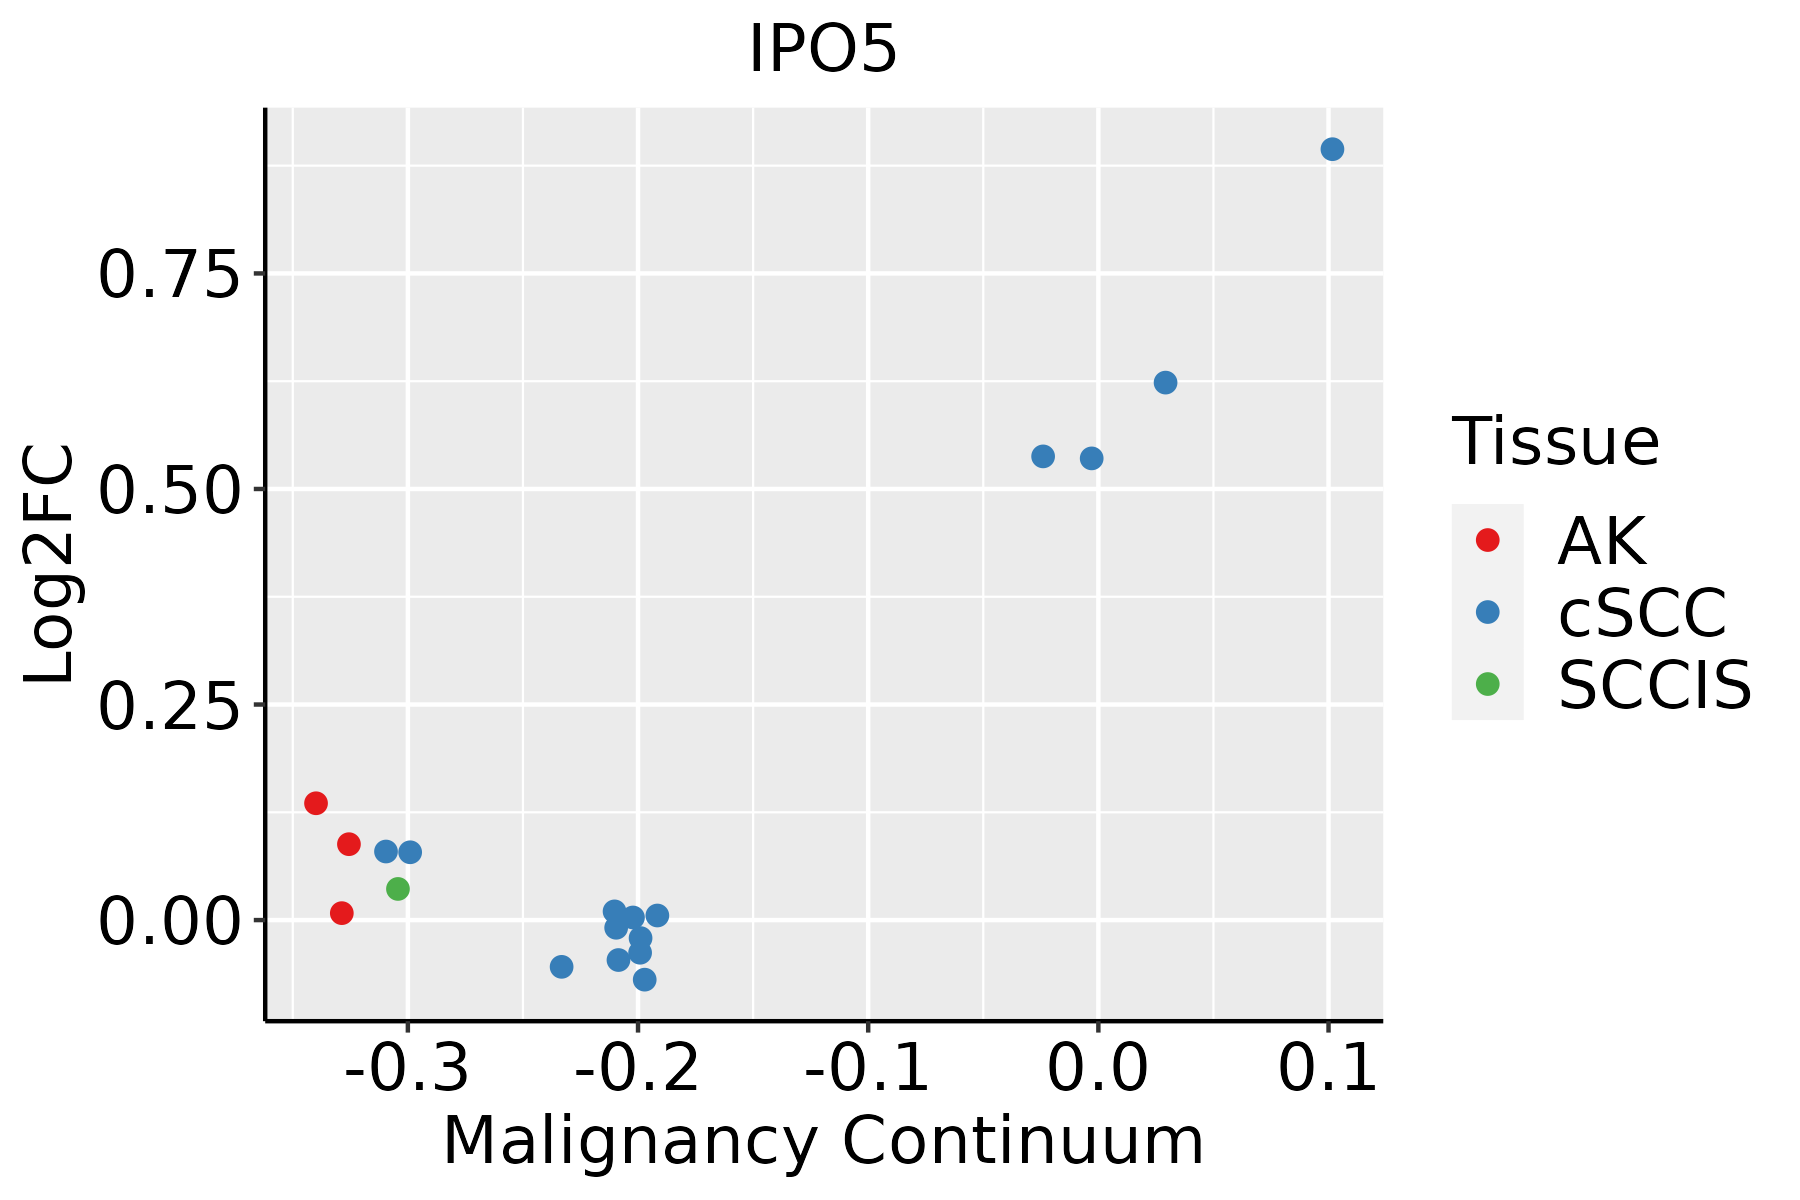 | AK: Actinic keratosis |
| cSCC: Cutaneous squamous cell carcinoma | ||
| SCCIS:squamous cell carcinoma in situ | ||
| Thyroid |  | ATC: Anaplastic thyroid cancer |
| HT: Hashimoto's thyroiditis | ||
| PTC: Papillary thyroid cancer |
| ∗log2FC in expression of this searched gene in stem-like cells from each diseased tissue sample relative to stem-like cells in normal samples in each tissue plotted against the malignancy continuum. Samples are colored based on if they are from different disease stage. |
Top |
Malignant transformation related pathway analysis |
| Find out the enriched GO biological processes and KEGG pathways involved in transition from healthy to precancer to cancer |
| Tissue | Disease Stage | Enriched GO biological Processes |
| Colorectum | AD |  |
| Colorectum | SER |  |
| Colorectum | MSS |  |
| Colorectum | MSI-H |  |
| Colorectum | FAP |  |
| ∗Top 15 enriched GO BP terms are showed in the bar plot of each disease state in each tissue. Each row represents a significant GO biological process which is colored according to the -log10(p.adjust). |
| Page: 1 2 3 4 5 6 7 8 9 |
| GO ID | Tissue | Disease Stage | Description | Gene Ratio | Bg Ratio | pvalue | p.adjust | Count |
| GO:00903169 | Prostate | BPH | positive regulation of intracellular protein transport | 55/3107 | 160/18723 | 3.09e-08 | 8.91e-07 | 55 |
| GO:004682215 | Prostate | BPH | regulation of nucleocytoplasmic transport | 40/3107 | 106/18723 | 1.35e-07 | 3.20e-06 | 40 |
| GO:005134818 | Prostate | BPH | negative regulation of transferase activity | 78/3107 | 268/18723 | 1.94e-07 | 4.29e-06 | 78 |
| GO:00719009 | Prostate | BPH | regulation of protein serine/threonine kinase activity | 97/3107 | 359/18723 | 3.42e-07 | 7.23e-06 | 97 |
| GO:001703810 | Prostate | BPH | protein import | 62/3107 | 206/18723 | 9.72e-07 | 1.77e-05 | 62 |
| GO:004682410 | Prostate | BPH | positive regulation of nucleocytoplasmic transport | 26/3107 | 62/18723 | 2.06e-06 | 3.40e-05 | 26 |
| GO:000646916 | Prostate | BPH | negative regulation of protein kinase activity | 62/3107 | 212/18723 | 2.81e-06 | 4.45e-05 | 62 |
| GO:003367315 | Prostate | BPH | negative regulation of kinase activity | 67/3107 | 237/18723 | 4.15e-06 | 6.25e-05 | 67 |
| GO:19040292 | Prostate | BPH | regulation of cyclin-dependent protein kinase activity | 34/3107 | 98/18723 | 1.00e-05 | 1.39e-04 | 34 |
| GO:00511708 | Prostate | BPH | import into nucleus | 48/3107 | 159/18723 | 1.42e-05 | 1.85e-04 | 48 |
| GO:00000792 | Prostate | BPH | regulation of cyclin-dependent protein serine/threonine kinase activity | 32/3107 | 94/18723 | 2.79e-05 | 3.27e-04 | 32 |
| GO:00066068 | Prostate | BPH | protein import into nucleus | 46/3107 | 155/18723 | 3.42e-05 | 3.82e-04 | 46 |
| GO:19045917 | Prostate | BPH | positive regulation of protein import | 18/3107 | 43/18723 | 7.79e-05 | 7.50e-04 | 18 |
| GO:19045898 | Prostate | BPH | regulation of protein import | 23/3107 | 63/18723 | 1.09e-04 | 9.95e-04 | 23 |
| GO:00423077 | Prostate | BPH | positive regulation of protein import into nucleus | 17/3107 | 41/18723 | 1.41e-04 | 1.26e-03 | 17 |
| GO:00457863 | Prostate | BPH | negative regulation of cell cycle | 91/3107 | 385/18723 | 2.10e-04 | 1.71e-03 | 91 |
| GO:1904030 | Prostate | BPH | negative regulation of cyclin-dependent protein kinase activity | 14/3107 | 33/18723 | 4.08e-04 | 2.97e-03 | 14 |
| GO:00423067 | Prostate | BPH | regulation of protein import into nucleus | 21/3107 | 60/18723 | 4.16e-04 | 3.01e-03 | 21 |
| GO:00011018 | Prostate | BPH | response to acid chemical | 37/3107 | 135/18723 | 1.03e-03 | 6.46e-03 | 37 |
| GO:0045736 | Prostate | BPH | negative regulation of cyclin-dependent protein serine/threonine kinase activity | 13/3107 | 32/18723 | 1.07e-03 | 6.67e-03 | 13 |
| Page: 1 2 3 4 5 6 7 8 9 10 11 12 13 14 15 16 17 18 19 20 21 |
| Pathway ID | Tissue | Disease Stage | Description | Gene Ratio | Bg Ratio | pvalue | p.adjust | qvalue | Count |
| hsa0301321 | Esophagus | ESCC | Nucleocytoplasmic transport | 89/4205 | 108/8465 | 1.20e-12 | 2.37e-11 | 1.21e-11 | 89 |
| hsa0301331 | Esophagus | ESCC | Nucleocytoplasmic transport | 89/4205 | 108/8465 | 1.20e-12 | 2.37e-11 | 1.21e-11 | 89 |
| hsa03013 | Liver | HCC | Nucleocytoplasmic transport | 81/4020 | 108/8465 | 4.28e-09 | 6.83e-08 | 3.80e-08 | 81 |
| hsa030131 | Liver | HCC | Nucleocytoplasmic transport | 81/4020 | 108/8465 | 4.28e-09 | 6.83e-08 | 3.80e-08 | 81 |
| hsa030136 | Oral cavity | OSCC | Nucleocytoplasmic transport | 82/3704 | 108/8465 | 7.93e-12 | 1.33e-10 | 6.77e-11 | 82 |
| hsa0301311 | Oral cavity | OSCC | Nucleocytoplasmic transport | 82/3704 | 108/8465 | 7.93e-12 | 1.33e-10 | 6.77e-11 | 82 |
| Page: 1 |
Top |
Cell-cell communication analysis |
| Identification of potential cell-cell interactions between two cell types and their ligand-receptor pairs for different disease states |
| Ligand | Receptor | LRpair | Pathway | Tissue | Disease Stage |
| Page: 1 |
Top |
Single-cell gene regulatory network inference analysis |
| Find out the significant the regulons (TFs) and the target genes of each regulon across cell types for different disease states |
| TF | Cell Type | Tissue | Disease Stage | Target Gene | RSS | Regulon Activity |
| ∗The dot plots of a searched regulon are shown for all cell subpopulations in each disease state of each tissue based on the regulon specific score inferred using pySCENIC and by calculating the average expression. |
| Page: 1 |
Top |
Somatic mutation of malignant transformation related genes |
| Annotation of somatic variants for genes involved in malignant transformation |
| Hugo Symbol | Variant Class | Variant Classification | dbSNP RS | HGVSc | HGVSp | HGVSp Short | SWISSPROT | BIOTYPE | SIFT | PolyPhen | Tumor Sample Barcode | Tissue | Histology | Sex | Age | Stage | Therapy Types | Drugs | Outcome |
| IPO5 | SNV | Missense_Mutation | rs9584741 | c.2731G>A | p.Glu911Lys | p.E911K | O00410 | protein_coding | deleterious(0) | probably_damaging(0.994) | TCGA-A2-A0EY-01 | Breast | breast invasive carcinoma | Female | <65 | I/II | Chemotherapy | adriamycin | SD |
| IPO5 | SNV | Missense_Mutation | rs371777975 | c.1615N>A | p.Asp539Asn | p.D539N | O00410 | protein_coding | tolerated(0.06) | possibly_damaging(0.867) | TCGA-A8-A08L-01 | Breast | breast invasive carcinoma | Female | >=65 | III/IV | Unknown | Unknown | SD |
| IPO5 | SNV | Missense_Mutation | c.3040T>C | p.Trp1014Arg | p.W1014R | O00410 | protein_coding | deleterious(0) | probably_damaging(0.996) | TCGA-GI-A2C8-01 | Breast | breast invasive carcinoma | Female | <65 | III/IV | Unspecific | Adriamycin | SD | |
| IPO5 | SNV | Missense_Mutation | novel | c.780N>C | p.Glu260Asp | p.E260D | O00410 | protein_coding | tolerated(0.99) | benign(0.14) | TCGA-LL-A740-01 | Breast | breast invasive carcinoma | Female | <65 | I/II | Chemotherapy | adriamycin | CR |
| IPO5 | SNV | Missense_Mutation | novel | c.1470C>A | p.Asp490Glu | p.D490E | O00410 | protein_coding | tolerated(0.22) | possibly_damaging(0.517) | TCGA-2W-A8YY-01 | Cervix | cervical & endocervical cancer | Female | <65 | I/II | Chemotherapy | cisplatin | CR |
| IPO5 | SNV | Missense_Mutation | c.28N>A | p.Glu10Lys | p.E10K | O00410 | protein_coding | deleterious_low_confidence(0) | probably_damaging(0.953) | TCGA-C5-A1BE-01 | Cervix | cervical & endocervical cancer | Female | <65 | I/II | Chemotherapy | cisplatin | PD | |
| IPO5 | SNV | Missense_Mutation | c.1295G>C | p.Arg432Thr | p.R432T | O00410 | protein_coding | deleterious(0) | probably_damaging(0.999) | TCGA-C5-A1MK-01 | Cervix | cervical & endocervical cancer | Female | >=65 | III/IV | Chemotherapy | carboplatin | PD | |
| IPO5 | SNV | Missense_Mutation | c.1145T>C | p.Met382Thr | p.M382T | O00410 | protein_coding | tolerated(0.1) | benign(0.089) | TCGA-EX-A69M-01 | Cervix | cervical & endocervical cancer | Female | <65 | I/II | Unknown | Unknown | PD | |
| IPO5 | SNV | Missense_Mutation | novel | c.1958N>T | p.Ser653Leu | p.S653L | O00410 | protein_coding | deleterious(0) | possibly_damaging(0.543) | TCGA-JW-A5VL-01 | Cervix | cervical & endocervical cancer | Female | <65 | I/II | Unknown | Unknown | SD |
| IPO5 | SNV | Missense_Mutation | rs566255473 | c.1688N>T | p.Ala563Val | p.A563V | O00410 | protein_coding | deleterious(0.03) | possibly_damaging(0.758) | TCGA-A6-2672-01 | Colorectum | colon adenocarcinoma | Female | >=65 | III/IV | Unknown | Unknown | SD |
| Page: 1 2 3 4 5 6 7 8 9 10 |
Top |
Related drugs of malignant transformation related genes |
| Identification of chemicals and drugs interact with genes involved in malignant transfromation |
| (DGIdb 4.0) |
| Entrez ID | Symbol | Category | Interaction Types | Drug Claim Name | Drug Name | PMIDs |
| Page: 1 |

Copyright 2023-Present -The University of Texas Health Science Center at Houston |