
|
|||||
|
 | |
| |
| |
| |
| |
| |
|
Gene: HSD17B1 |
Gene summary for HSD17B1 |
| Gene information | Species | Human | Gene symbol | HSD17B1 | Gene ID | 3292 |
| Gene name | hydroxysteroid 17-beta dehydrogenase 1 | |
| Gene Alias | 17-beta-HSD | |
| Cytomap | 17q21.2 | |
| Gene Type | protein-coding | GO ID | GO:0001501 | UniProtAcc | P14061 |
Top |
Malignant transformation analysis |
| Identification of the aberrant gene expression in precancerous and cancerous lesions by comparing the gene expression of stem-like cells in diseased tissues with normal stem cells |
| Entrez ID | Symbol | Replicates | Species | Organ | Tissue | Adj P-value | Log2FC | Malignancy |
| 3292 | HSD17B1 | LZE4T | Human | Esophagus | ESCC | 2.61e-07 | 1.87e-01 | 0.0811 |
| 3292 | HSD17B1 | P2T-E | Human | Esophagus | ESCC | 2.51e-05 | 1.49e-01 | 0.1177 |
| 3292 | HSD17B1 | P4T-E | Human | Esophagus | ESCC | 7.59e-11 | 3.06e-01 | 0.1323 |
| 3292 | HSD17B1 | P5T-E | Human | Esophagus | ESCC | 5.00e-29 | 5.68e-01 | 0.1327 |
| 3292 | HSD17B1 | P8T-E | Human | Esophagus | ESCC | 6.64e-11 | 1.01e-01 | 0.0889 |
| 3292 | HSD17B1 | P9T-E | Human | Esophagus | ESCC | 5.28e-04 | 1.92e-01 | 0.1131 |
| 3292 | HSD17B1 | P12T-E | Human | Esophagus | ESCC | 1.69e-02 | 2.64e-02 | 0.1122 |
| 3292 | HSD17B1 | P15T-E | Human | Esophagus | ESCC | 2.10e-02 | 6.50e-02 | 0.1149 |
| 3292 | HSD17B1 | P16T-E | Human | Esophagus | ESCC | 3.87e-03 | 3.75e-02 | 0.1153 |
| 3292 | HSD17B1 | P21T-E | Human | Esophagus | ESCC | 9.51e-11 | 2.40e-01 | 0.1617 |
| 3292 | HSD17B1 | P22T-E | Human | Esophagus | ESCC | 2.73e-49 | 8.56e-01 | 0.1236 |
| 3292 | HSD17B1 | P23T-E | Human | Esophagus | ESCC | 4.40e-05 | 2.12e-01 | 0.108 |
| 3292 | HSD17B1 | P24T-E | Human | Esophagus | ESCC | 1.81e-08 | 2.32e-01 | 0.1287 |
| 3292 | HSD17B1 | P26T-E | Human | Esophagus | ESCC | 3.90e-15 | 3.21e-01 | 0.1276 |
| 3292 | HSD17B1 | P27T-E | Human | Esophagus | ESCC | 3.07e-08 | 1.47e-01 | 0.1055 |
| 3292 | HSD17B1 | P28T-E | Human | Esophagus | ESCC | 4.39e-23 | 4.17e-01 | 0.1149 |
| 3292 | HSD17B1 | P30T-E | Human | Esophagus | ESCC | 6.24e-04 | 2.13e-01 | 0.137 |
| 3292 | HSD17B1 | P31T-E | Human | Esophagus | ESCC | 3.13e-07 | 1.08e-01 | 0.1251 |
| 3292 | HSD17B1 | P32T-E | Human | Esophagus | ESCC | 2.65e-24 | 3.65e-01 | 0.1666 |
| 3292 | HSD17B1 | P37T-E | Human | Esophagus | ESCC | 8.23e-08 | 2.31e-01 | 0.1371 |
| Page: 1 2 3 |
| Tissue | Expression Dynamics | Abbreviation |
| Esophagus | 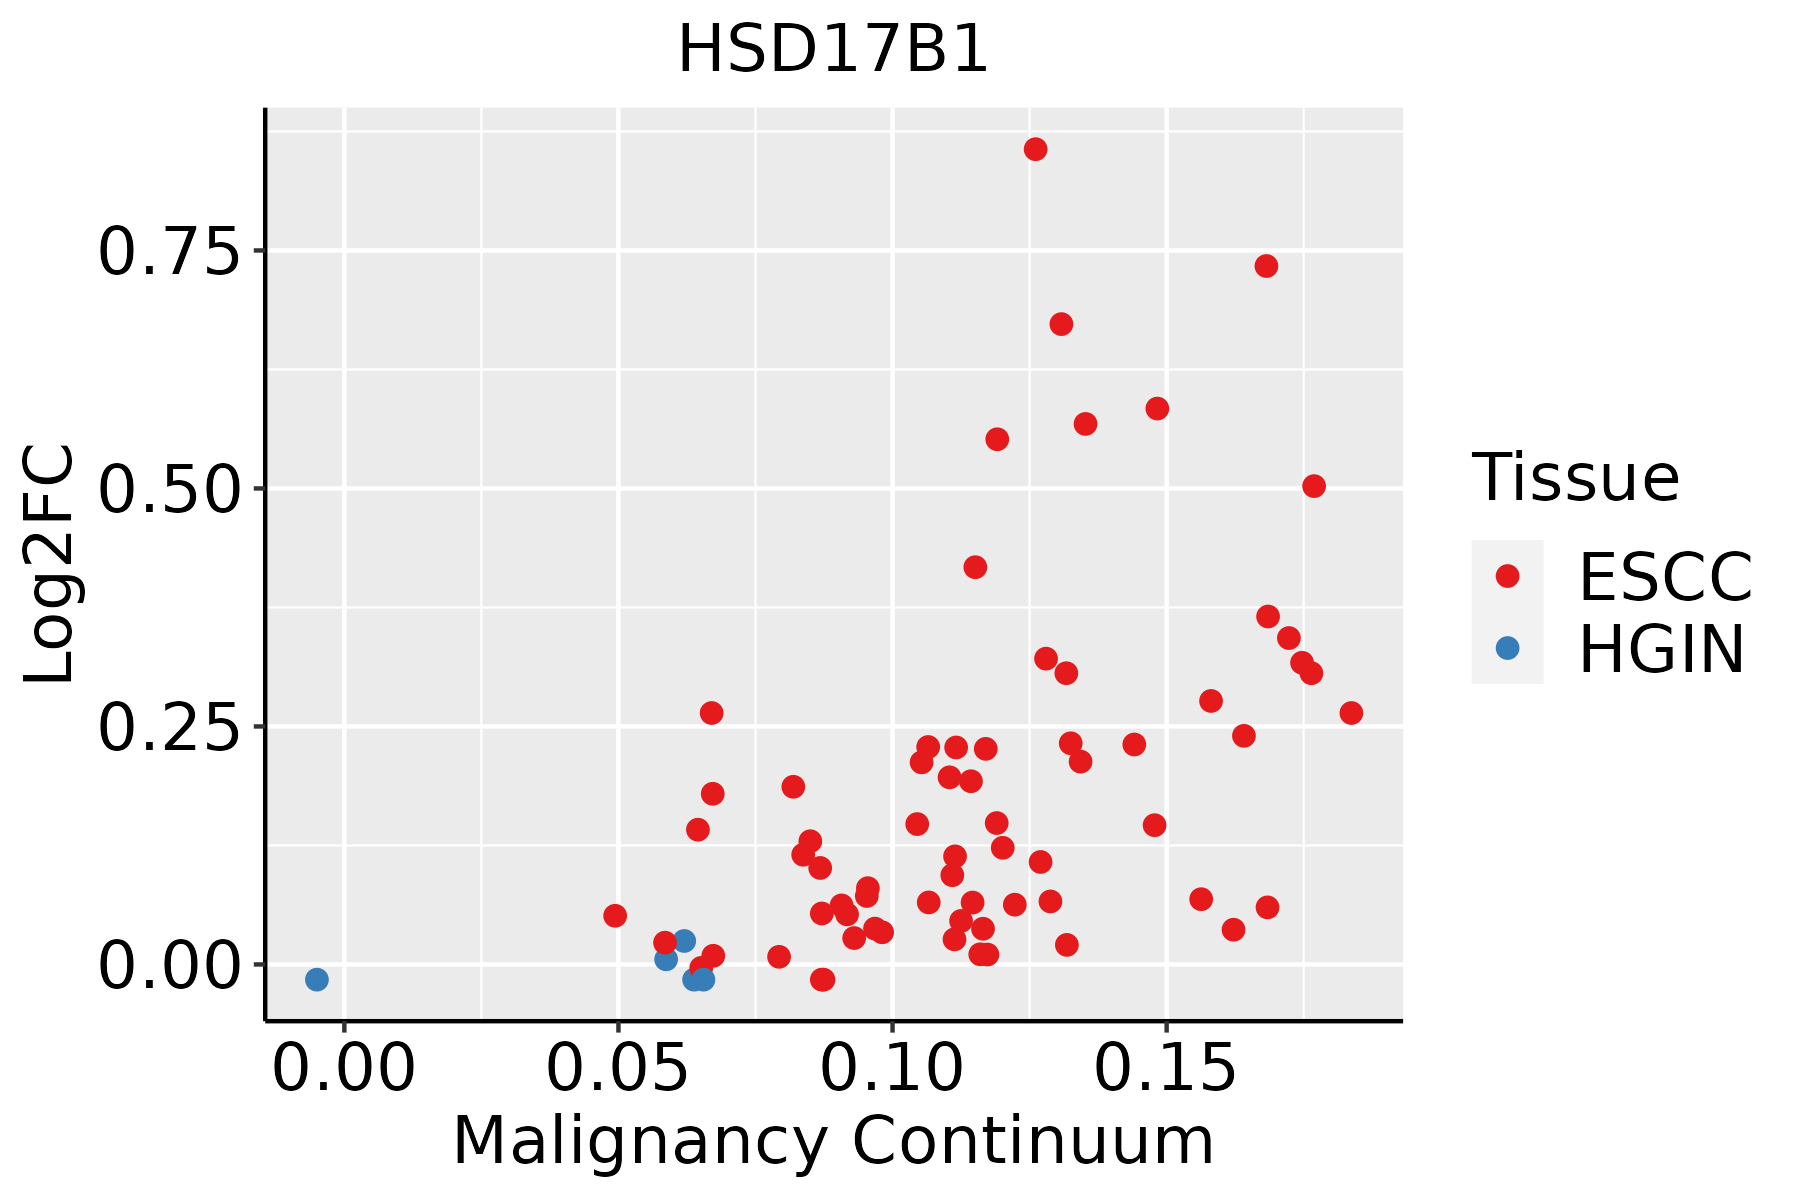 | ESCC: Esophageal squamous cell carcinoma |
| HGIN: High-grade intraepithelial neoplasias | ||
| LGIN: Low-grade intraepithelial neoplasias | ||
| Oral Cavity |  | EOLP: Erosive Oral lichen planus |
| LP: leukoplakia | ||
| NEOLP: Non-erosive oral lichen planus | ||
| OSCC: Oral squamous cell carcinoma |
| ∗log2FC in expression of this searched gene in stem-like cells from each diseased tissue sample relative to stem-like cells in normal samples in each tissue plotted against the malignancy continuum. Samples are colored based on if they are from different disease stage. |
Top |
Malignant transformation related pathway analysis |
| Find out the enriched GO biological processes and KEGG pathways involved in transition from healthy to precancer to cancer |
| Tissue | Disease Stage | Enriched GO biological Processes |
| Colorectum | AD |  |
| Colorectum | SER |  |
| Colorectum | MSS |  |
| Colorectum | MSI-H |  |
| Colorectum | FAP |  |
| ∗Top 15 enriched GO BP terms are showed in the bar plot of each disease state in each tissue. Each row represents a significant GO biological process which is colored according to the -log10(p.adjust). |
| Page: 1 2 3 4 5 6 7 8 9 |
| GO ID | Tissue | Disease Stage | Description | Gene Ratio | Bg Ratio | pvalue | p.adjust | Count |
| GO:00991163 | Esophagus | ESCC | tRNA 5'-end processing | 14/8552 | 16/18723 | 6.78e-04 | 3.56e-03 | 14 |
| GO:00442427 | Esophagus | ESCC | cellular lipid catabolic process | 121/8552 | 214/18723 | 8.63e-04 | 4.43e-03 | 121 |
| GO:0090646 | Esophagus | ESCC | mitochondrial tRNA processing | 11/8552 | 12/18723 | 1.26e-03 | 6.06e-03 | 11 |
| GO:00442827 | Esophagus | ESCC | small molecule catabolic process | 201/8552 | 376/18723 | 1.35e-03 | 6.41e-03 | 201 |
| GO:00512623 | Esophagus | ESCC | protein tetramerization | 54/8552 | 87/18723 | 1.50e-03 | 7.06e-03 | 54 |
| GO:00603485 | Esophagus | ESCC | bone development | 115/8552 | 205/18723 | 1.67e-03 | 7.72e-03 | 115 |
| GO:007124117 | Esophagus | ESCC | cellular response to inorganic substance | 125/8552 | 226/18723 | 2.17e-03 | 9.67e-03 | 125 |
| GO:00066946 | Esophagus | ESCC | steroid biosynthetic process | 98/8552 | 173/18723 | 2.34e-03 | 1.03e-02 | 98 |
| GO:00512592 | Esophagus | ESCC | protein complex oligomerization | 130/8552 | 238/18723 | 3.29e-03 | 1.36e-02 | 130 |
| GO:00302586 | Esophagus | ESCC | lipid modification | 116/8552 | 212/18723 | 4.90e-03 | 1.89e-02 | 116 |
| GO:19016174 | Esophagus | ESCC | organic hydroxy compound biosynthetic process | 128/8552 | 237/18723 | 5.86e-03 | 2.16e-02 | 128 |
| GO:00090836 | Esophagus | ESCC | branched-chain amino acid catabolic process | 12/8552 | 15/18723 | 7.31e-03 | 2.63e-02 | 12 |
| GO:00160427 | Esophagus | ESCC | lipid catabolic process | 168/8552 | 320/18723 | 7.97e-03 | 2.84e-02 | 168 |
| GO:00090815 | Esophagus | ESCC | branched-chain amino acid metabolic process | 14/8552 | 19/18723 | 1.27e-02 | 4.21e-02 | 14 |
| GO:00066374 | Esophagus | ESCC | acyl-CoA metabolic process | 55/8552 | 96/18723 | 1.45e-02 | 4.71e-02 | 55 |
| GO:00353834 | Esophagus | ESCC | thioester metabolic process | 55/8552 | 96/18723 | 1.45e-02 | 4.71e-02 | 55 |
| GO:00066316 | Liver | NAFLD | fatty acid metabolic process | 92/1882 | 390/18723 | 3.38e-15 | 3.29e-12 | 92 |
| GO:00160535 | Liver | NAFLD | organic acid biosynthetic process | 77/1882 | 316/18723 | 1.03e-13 | 6.69e-11 | 77 |
| GO:00463945 | Liver | NAFLD | carboxylic acid biosynthetic process | 75/1882 | 314/18723 | 6.37e-13 | 3.39e-10 | 75 |
| GO:00082023 | Liver | NAFLD | steroid metabolic process | 69/1882 | 319/18723 | 5.90e-10 | 1.28e-07 | 69 |
| Page: 1 2 3 4 5 6 7 8 9 10 11 12 13 14 15 16 17 18 19 20 21 22 23 24 25 26 27 28 29 30 31 32 33 34 35 |
| Pathway ID | Tissue | Disease Stage | Description | Gene Ratio | Bg Ratio | pvalue | p.adjust | qvalue | Count |
| Page: 1 |
Top |
Cell-cell communication analysis |
| Identification of potential cell-cell interactions between two cell types and their ligand-receptor pairs for different disease states |
| Ligand | Receptor | LRpair | Pathway | Tissue | Disease Stage |
| Page: 1 |
Top |
Single-cell gene regulatory network inference analysis |
| Find out the significant the regulons (TFs) and the target genes of each regulon across cell types for different disease states |
| TF | Cell Type | Tissue | Disease Stage | Target Gene | RSS | Regulon Activity |
| ∗The dot plots of a searched regulon are shown for all cell subpopulations in each disease state of each tissue based on the regulon specific score inferred using pySCENIC and by calculating the average expression. |
| Page: 1 |
Top |
Somatic mutation of malignant transformation related genes |
| Annotation of somatic variants for genes involved in malignant transformation |
| Hugo Symbol | Variant Class | Variant Classification | dbSNP RS | HGVSc | HGVSp | HGVSp Short | SWISSPROT | BIOTYPE | SIFT | PolyPhen | Tumor Sample Barcode | Tissue | Histology | Sex | Age | Stage | Therapy Types | Drugs | Outcome |
| HSD17B1 | SNV | Missense_Mutation | novel | c.367N>A | p.Leu123Met | p.L123M | protein_coding | deleterious(0.04) | possibly_damaging(0.697) | TCGA-2W-A8YY-01 | Cervix | cervical & endocervical cancer | Female | <65 | I/II | Chemotherapy | cisplatin | CR | |
| HSD17B1 | SNV | Missense_Mutation | c.400N>A | p.Gly134Ser | p.G134S | protein_coding | tolerated(0.13) | benign(0.206) | TCGA-AZ-6601-01 | Colorectum | colon adenocarcinoma | Male | >=65 | I/II | Unknown | Unknown | PD | ||
| HSD17B1 | SNV | Missense_Mutation | c.144N>T | p.Glu48Asp | p.E48D | protein_coding | tolerated(0.07) | possibly_damaging(0.717) | TCGA-G4-6302-01 | Colorectum | colon adenocarcinoma | Female | >=65 | I/II | Unknown | Unknown | SD | ||
| HSD17B1 | SNV | Missense_Mutation | c.609G>T | p.Glu203Asp | p.E203D | protein_coding | tolerated(0.62) | benign(0) | TCGA-AP-A0LM-01 | Endometrium | uterine corpus endometrioid carcinoma | Female | <65 | III/IV | Chemotherapy | cisplatin | SD | ||
| HSD17B1 | SNV | Missense_Mutation | rs773613890 | c.530N>G | p.Phe177Cys | p.F177C | protein_coding | deleterious(0) | probably_damaging(0.975) | TCGA-AX-A2H2-01 | Endometrium | uterine corpus endometrioid carcinoma | Female | >=65 | I/II | Unknown | Unknown | SD | |
| HSD17B1 | SNV | Missense_Mutation | c.320N>T | p.Ala107Val | p.A107V | protein_coding | deleterious(0.02) | possibly_damaging(0.571) | TCGA-BG-A0M4-01 | Endometrium | uterine corpus endometrioid carcinoma | Female | <65 | I/II | Chemotherapy | carboplatin | SD | ||
| HSD17B1 | SNV | Missense_Mutation | novel | c.337N>A | p.Asp113Asn | p.D113N | protein_coding | deleterious(0.04) | benign(0.359) | TCGA-BG-A222-01 | Endometrium | uterine corpus endometrioid carcinoma | Female | <65 | I/II | Unknown | Unknown | SD | |
| HSD17B1 | SNV | Missense_Mutation | novel | c.283G>T | p.Gly95Cys | p.G95C | protein_coding | deleterious(0) | probably_damaging(0.998) | TCGA-EO-A3KX-01 | Endometrium | uterine corpus endometrioid carcinoma | Female | >=65 | I/II | Unknown | Unknown | SD | |
| HSD17B1 | SNV | Missense_Mutation | c.404N>G | p.Ser135Trp | p.S135W | protein_coding | tolerated(0.05) | benign(0.35) | TCGA-44-A47A-01 | Lung | lung adenocarcinoma | Female | >=65 | I/II | Unknown | Unknown | PD | ||
| HSD17B1 | SNV | Missense_Mutation | c.868C>T | p.Pro290Ser | p.P290S | protein_coding | tolerated(0.15) | benign(0.023) | TCGA-86-A4JF-01 | Lung | lung adenocarcinoma | Male | <65 | I/II | Chemotherapy | unknown | PD |
| Page: 1 2 |
Top |
Related drugs of malignant transformation related genes |
| Identification of chemicals and drugs interact with genes involved in malignant transfromation |
| (DGIdb 4.0) |
| Entrez ID | Symbol | Category | Interaction Types | Drug Claim Name | Drug Name | PMIDs |
| Page: 1 |

Copyright 2023-Present -The University of Texas Health Science Center at Houston |