| Tissue | Expression Dynamics | Abbreviation |
| Cervix | 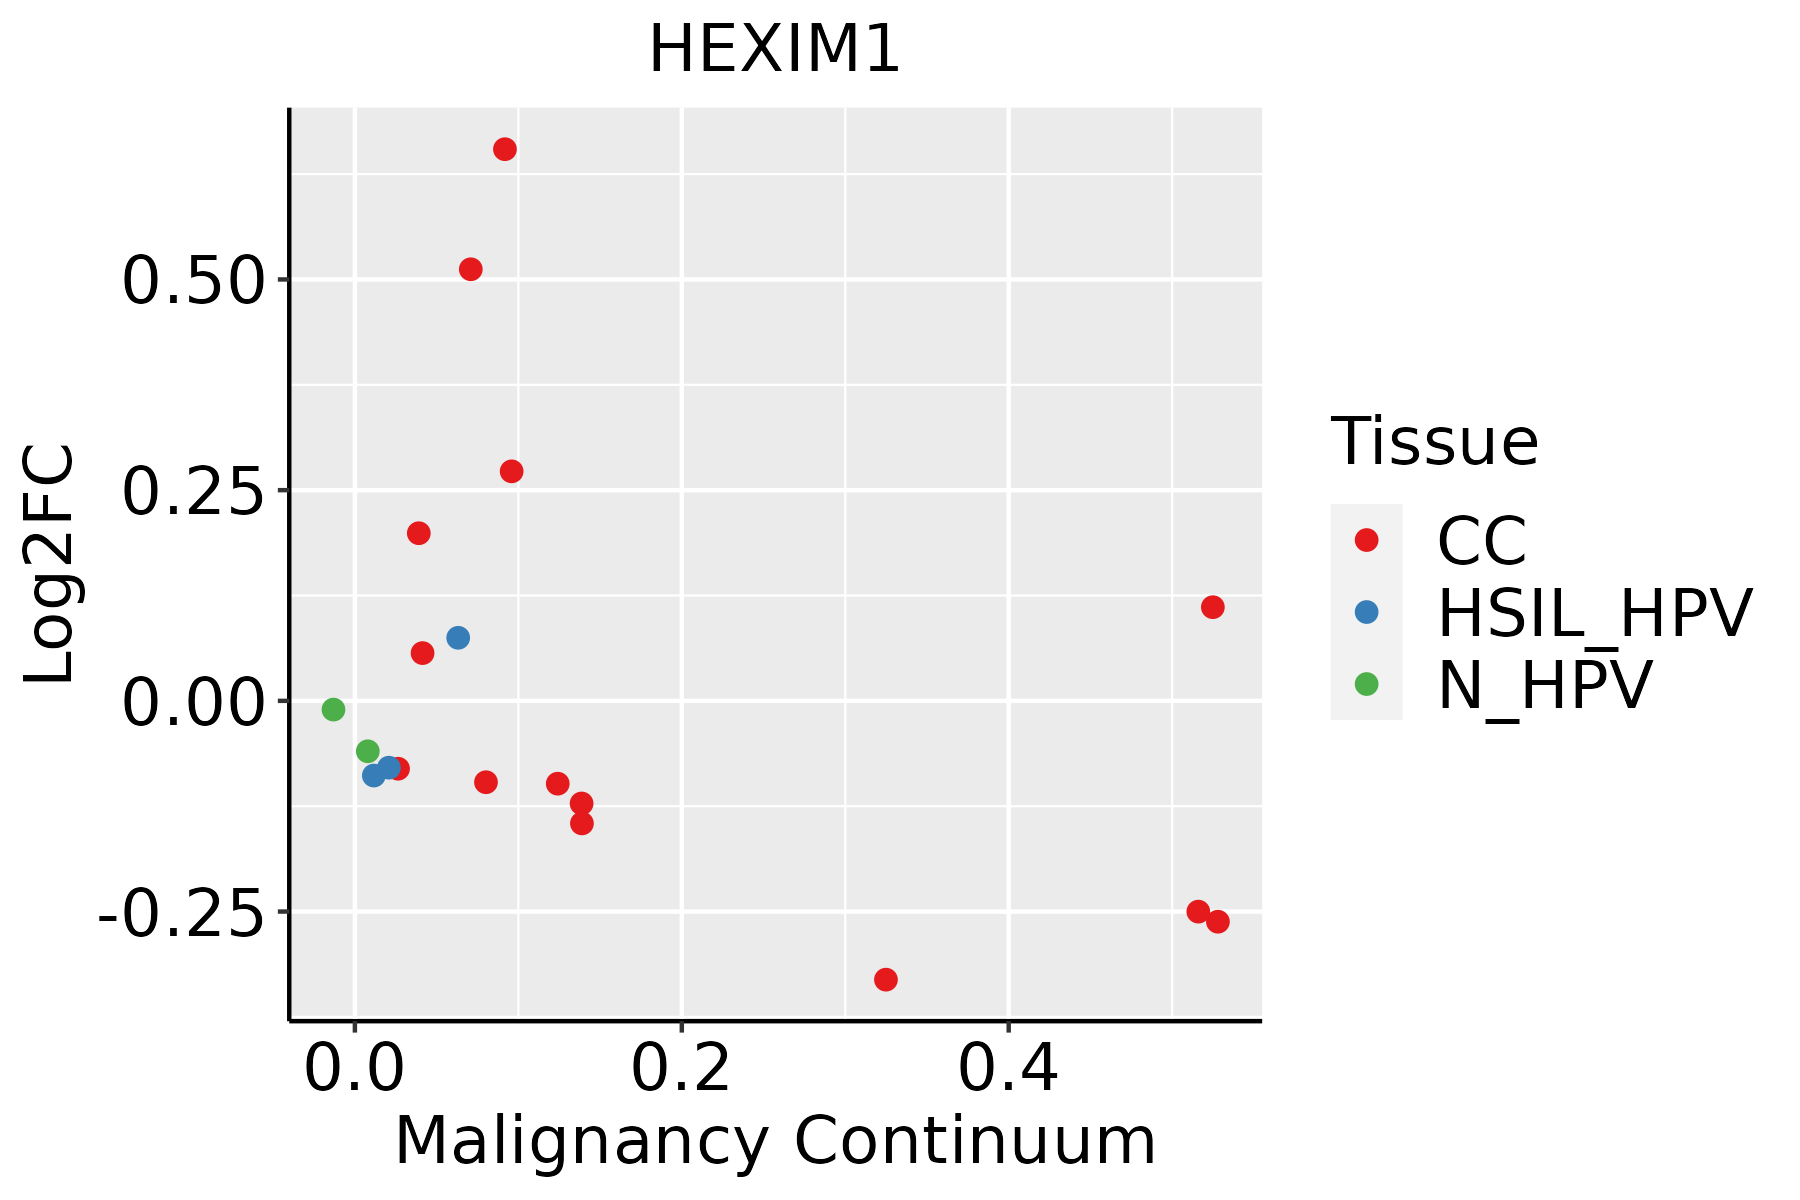 | CC: Cervix cancer |
| HSIL_HPV: HPV-infected high-grade squamous intraepithelial lesions |
| N_HPV: HPV-infected normal cervix |
| Esophagus | 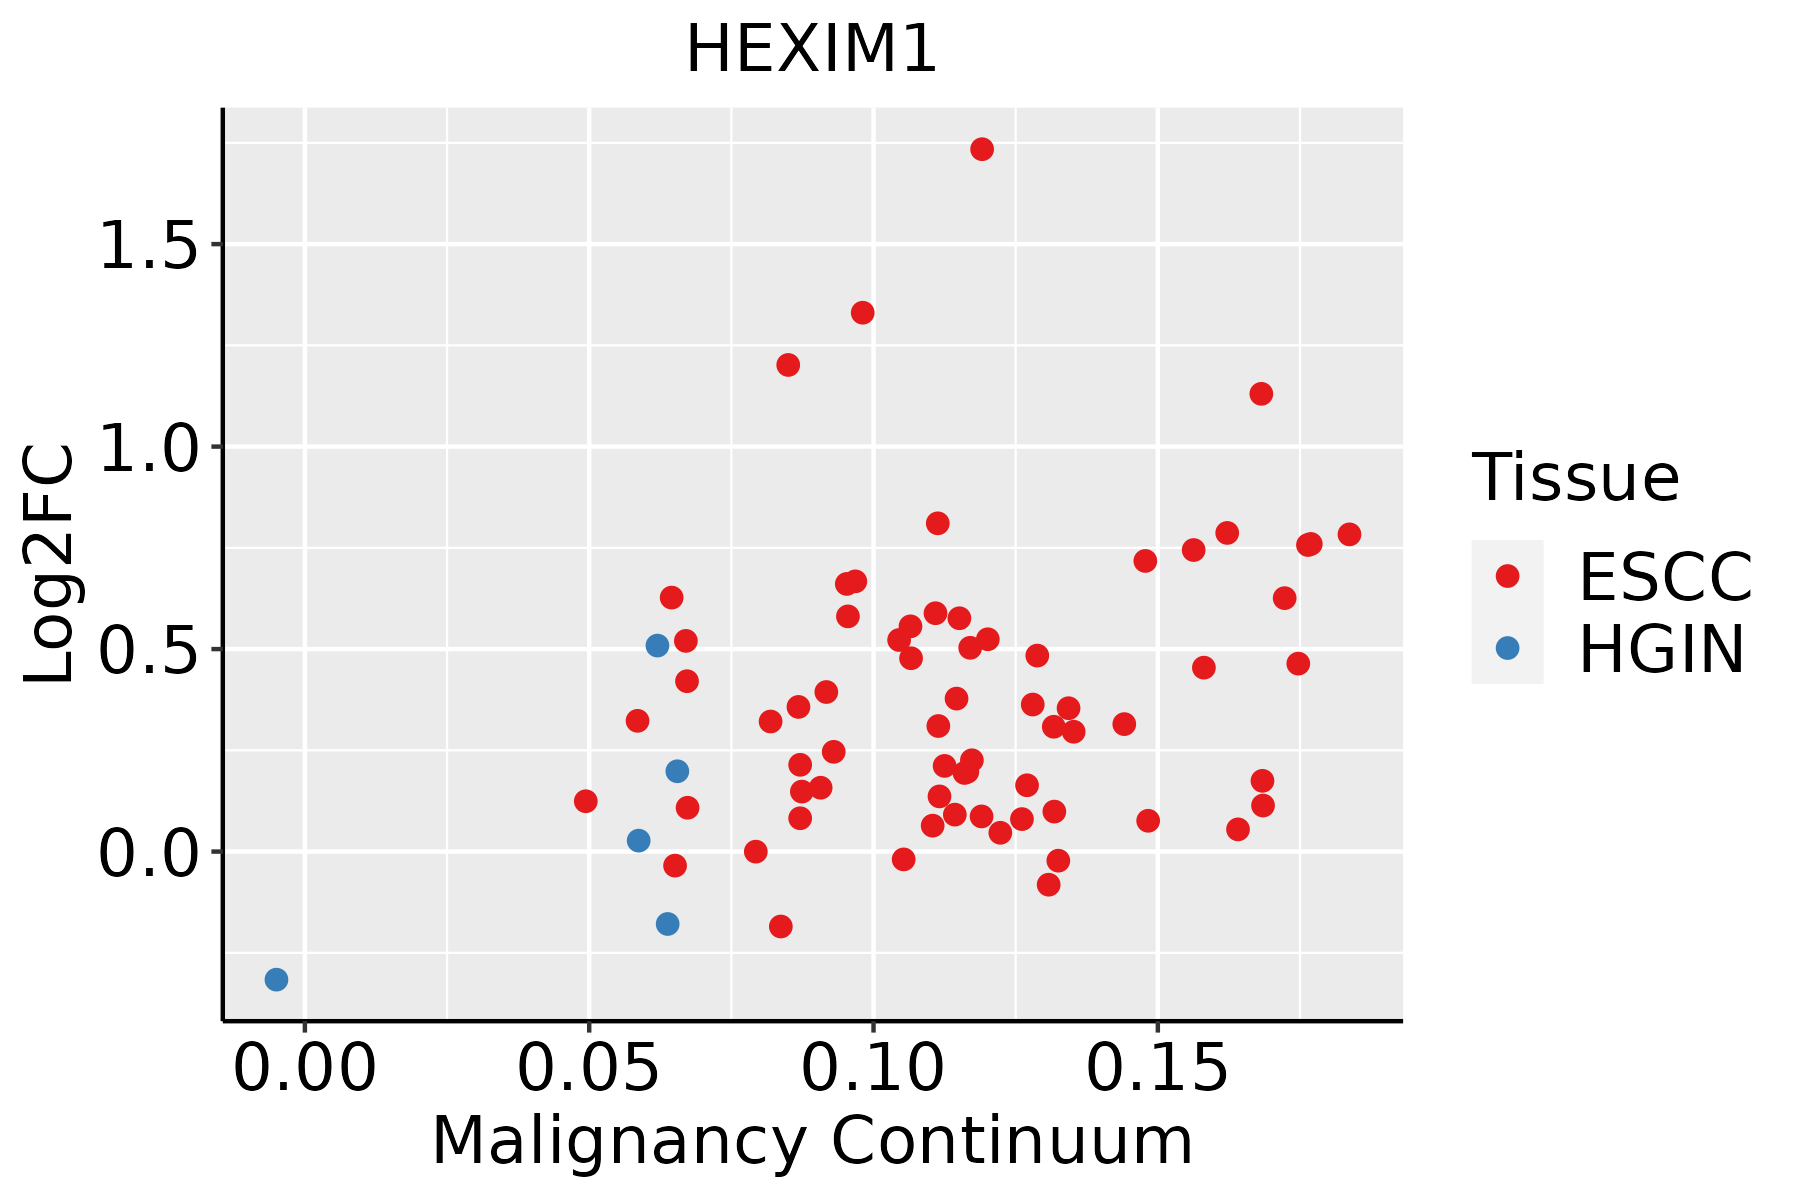 | ESCC: Esophageal squamous cell carcinoma |
| HGIN: High-grade intraepithelial neoplasias |
| LGIN: Low-grade intraepithelial neoplasias |
| Liver | 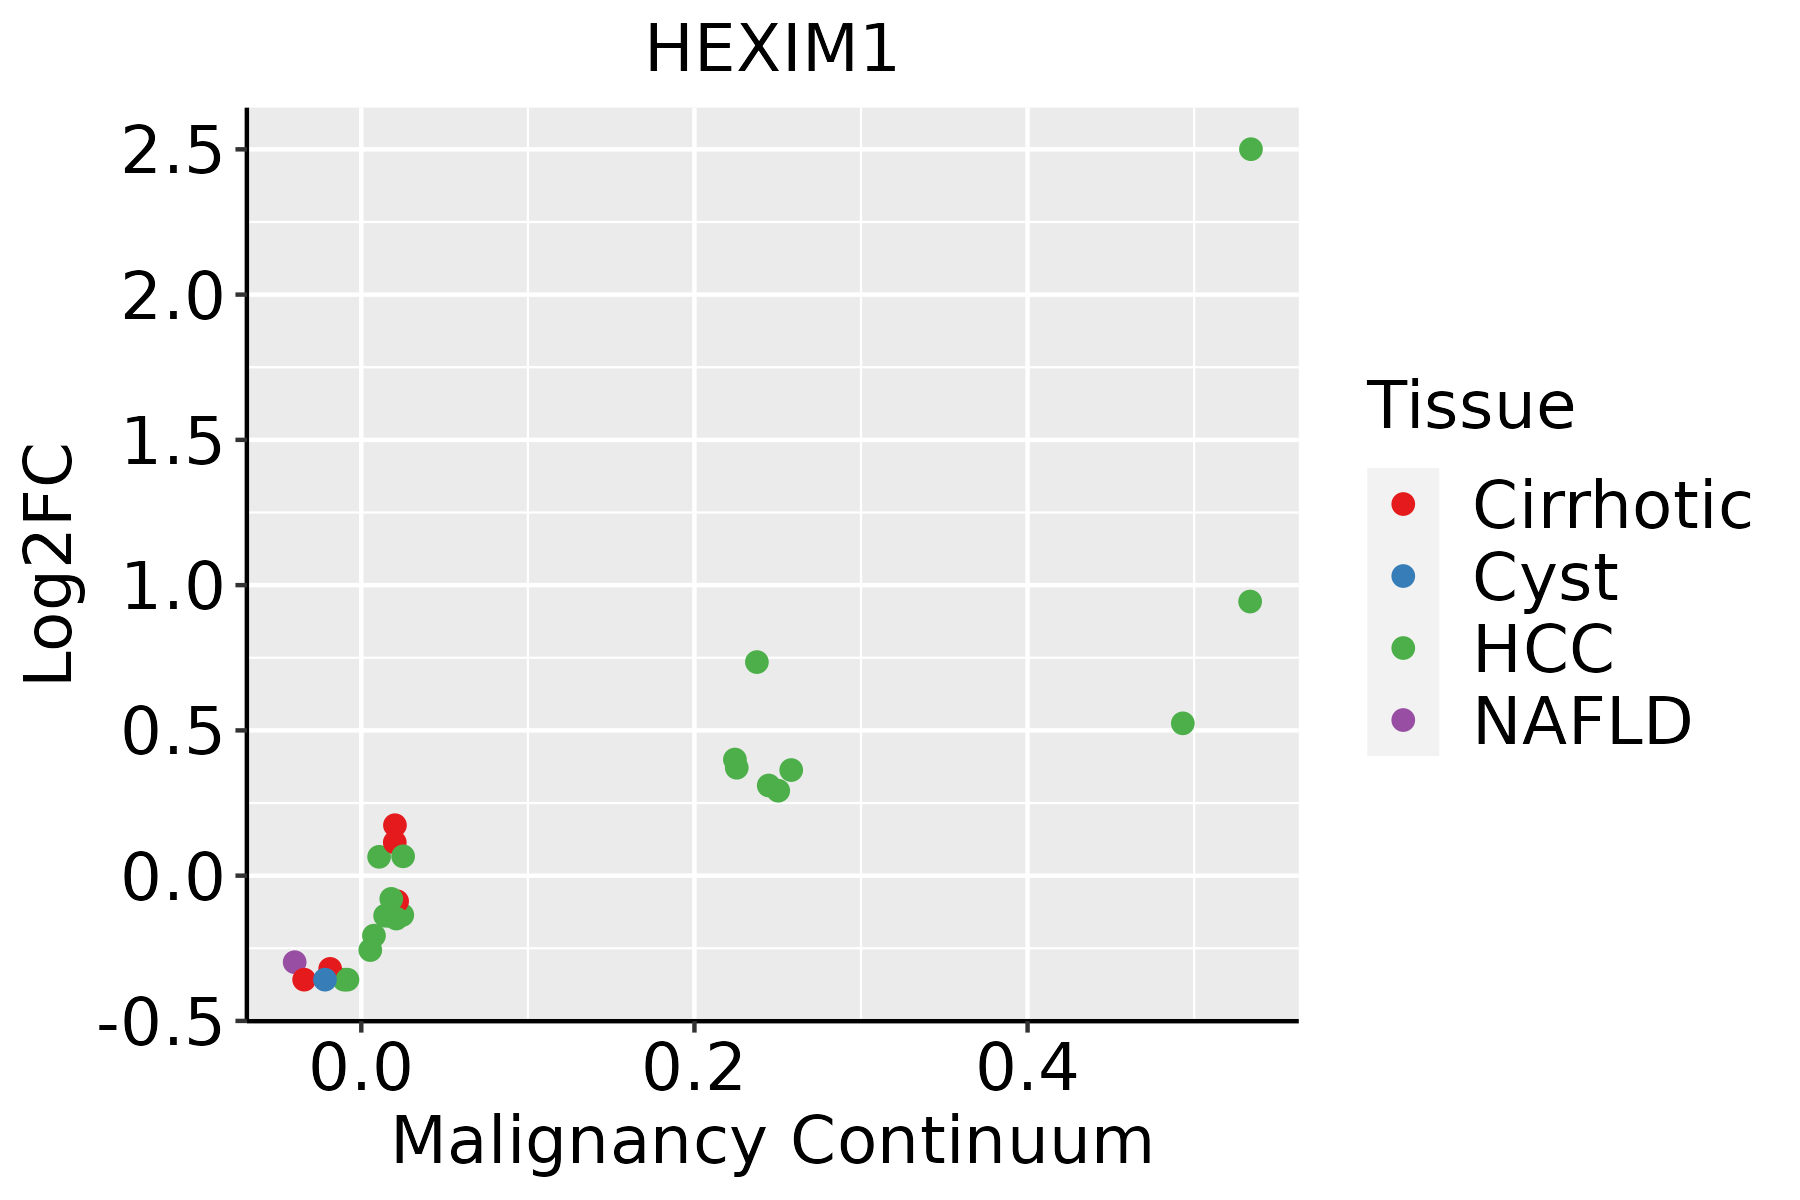 | HCC: Hepatocellular carcinoma |
| NAFLD: Non-alcoholic fatty liver disease |
| Oral Cavity |  | EOLP: Erosive Oral lichen planus |
| LP: leukoplakia |
| NEOLP: Non-erosive oral lichen planus |
| OSCC: Oral squamous cell carcinoma |
| Prostate | 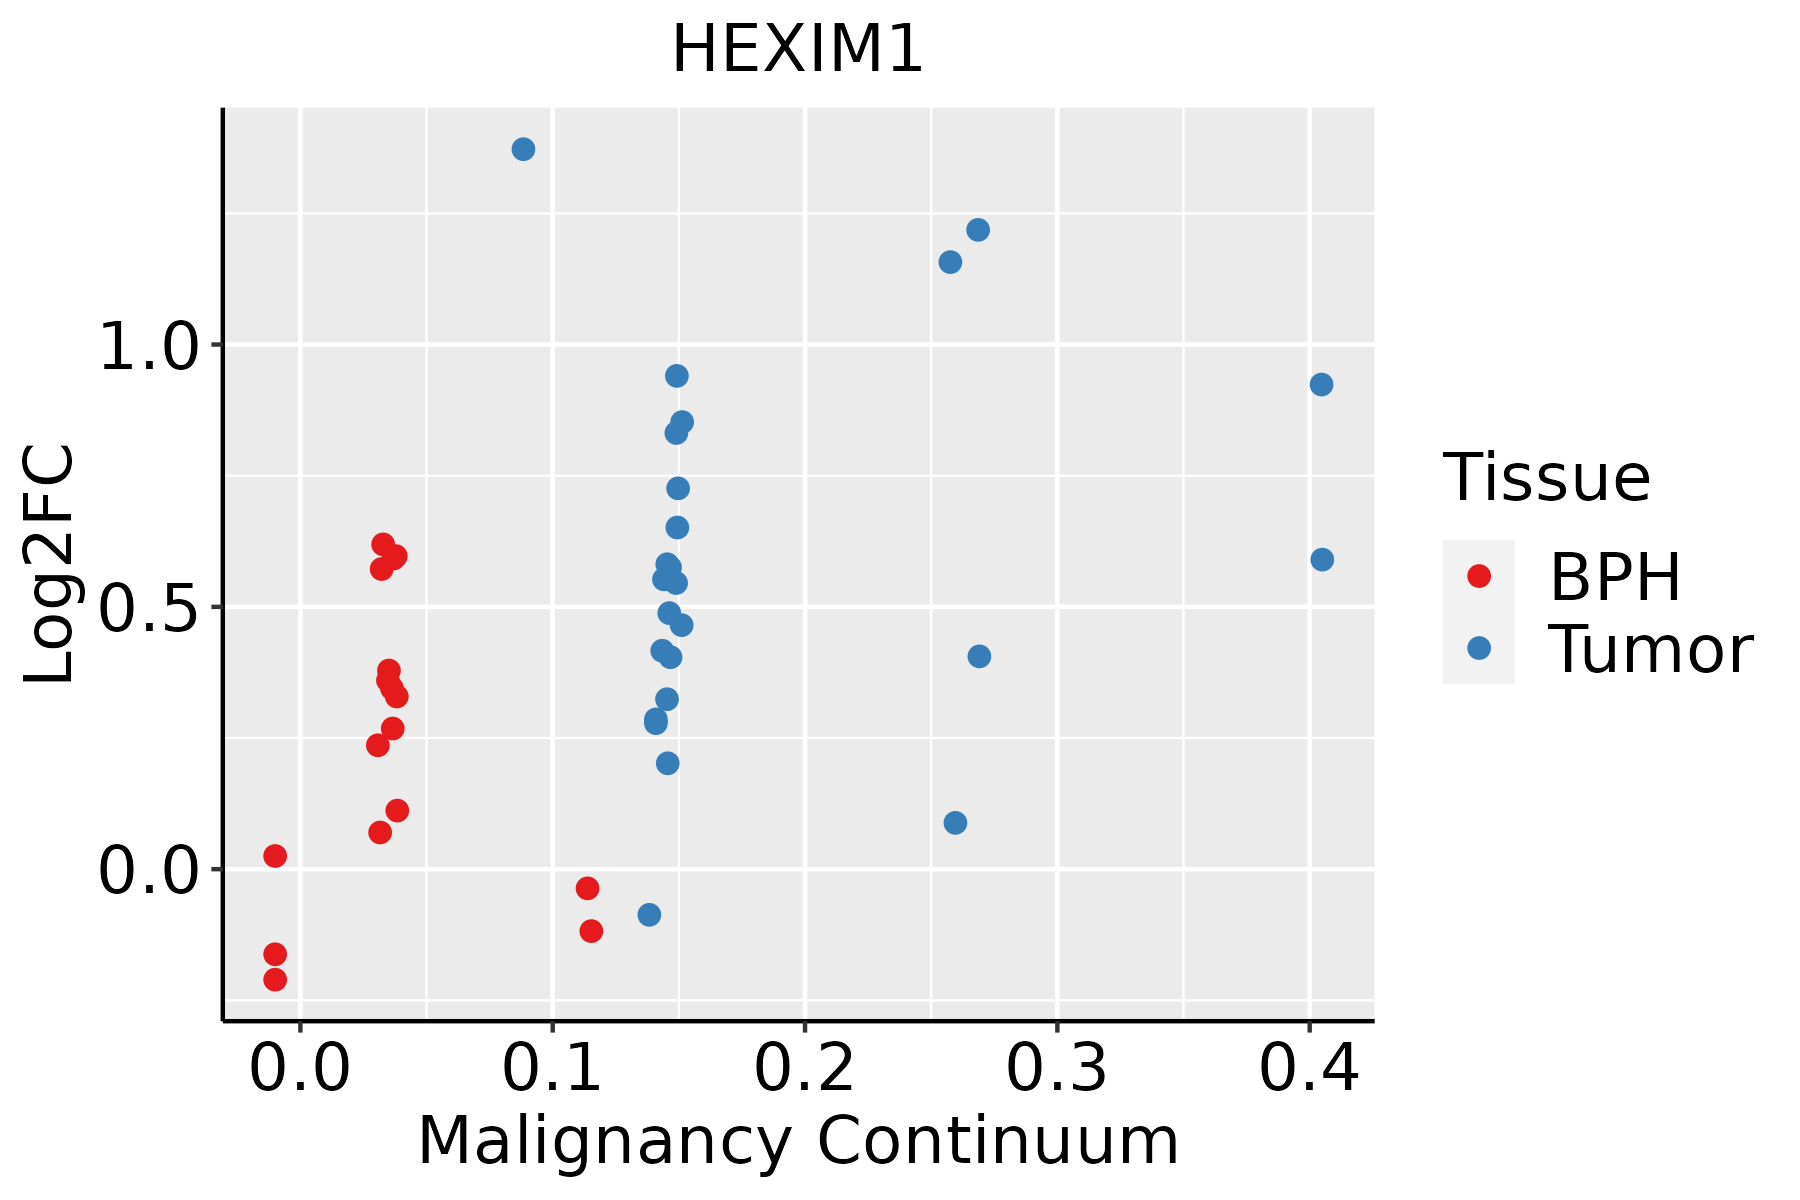 | BPH: Benign Prostatic Hyperplasia |
| Thyroid |  | ATC: Anaplastic thyroid cancer |
| HT: Hashimoto's thyroiditis |
| PTC: Papillary thyroid cancer |
| GO ID | Tissue | Disease Stage | Description | Gene Ratio | Bg Ratio | pvalue | p.adjust | Count |
| GO:00719011 | Prostate | Tumor | negative regulation of protein serine/threonine kinase activity | 35/3246 | 120/18723 | 9.20e-04 | 6.08e-03 | 35 |
| GO:00457361 | Prostate | Tumor | negative regulation of cyclin-dependent protein serine/threonine kinase activity | 13/3246 | 32/18723 | 1.62e-03 | 9.79e-03 | 13 |
| GO:00327841 | Prostate | Tumor | regulation of DNA-templated transcription, elongation | 18/3246 | 53/18723 | 2.59e-03 | 1.43e-02 | 18 |
| GO:00190832 | Prostate | Tumor | viral transcription | 17/3246 | 50/18723 | 3.32e-03 | 1.73e-02 | 17 |
| GO:00342431 | Prostate | Tumor | regulation of transcription elongation from RNA polymerase II promoter | 12/3246 | 32/18723 | 5.30e-03 | 2.54e-02 | 12 |
| GO:00485258 | Prostate | Tumor | negative regulation of viral process | 26/3246 | 92/18723 | 6.22e-03 | 2.87e-02 | 26 |
| GO:00028316 | Prostate | Tumor | regulation of response to biotic stimulus | 74/3246 | 327/18723 | 8.03e-03 | 3.54e-02 | 74 |
| GO:001603230 | Thyroid | HT | viral process | 81/1272 | 415/18723 | 3.08e-18 | 2.45e-15 | 81 |
| GO:005134830 | Thyroid | HT | negative regulation of transferase activity | 45/1272 | 268/18723 | 1.49e-08 | 1.20e-06 | 45 |
| GO:007233130 | Thyroid | HT | signal transduction by p53 class mediator | 31/1272 | 163/18723 | 1.52e-07 | 8.45e-06 | 31 |
| GO:005079227 | Thyroid | HT | regulation of viral process | 31/1272 | 164/18723 | 1.75e-07 | 9.37e-06 | 31 |
| GO:190179830 | Thyroid | HT | positive regulation of signal transduction by p53 class mediator | 11/1272 | 25/18723 | 2.50e-07 | 1.21e-05 | 11 |
| GO:190179630 | Thyroid | HT | regulation of signal transduction by p53 class mediator | 20/1272 | 93/18723 | 3.39e-06 | 1.13e-04 | 20 |
| GO:00321039 | Thyroid | HT | positive regulation of response to external stimulus | 55/1272 | 427/18723 | 3.50e-06 | 1.16e-04 | 55 |
| GO:00313497 | Thyroid | HT | positive regulation of defense response | 40/1272 | 278/18723 | 5.40e-06 | 1.66e-04 | 40 |
| GO:000646924 | Thyroid | HT | negative regulation of protein kinase activity | 33/1272 | 212/18723 | 6.62e-06 | 1.95e-04 | 33 |
| GO:003367324 | Thyroid | HT | negative regulation of kinase activity | 35/1272 | 237/18723 | 1.16e-05 | 3.05e-04 | 35 |
| GO:000193327 | Thyroid | HT | negative regulation of protein phosphorylation | 45/1272 | 342/18723 | 1.54e-05 | 3.80e-04 | 45 |
| GO:004232627 | Thyroid | HT | negative regulation of phosphorylation | 49/1272 | 385/18723 | 1.62e-05 | 3.95e-04 | 49 |
| GO:004593629 | Thyroid | HT | negative regulation of phosphate metabolic process | 54/1272 | 441/18723 | 1.86e-05 | 4.39e-04 | 54 |
| Hugo Symbol | Variant Class | Variant Classification | dbSNP RS | HGVSc | HGVSp | HGVSp Short | SWISSPROT | BIOTYPE | SIFT | PolyPhen | Tumor Sample Barcode | Tissue | Histology | Sex | Age | Stage | Therapy Types | Drugs | Outcome |
| HEXIM1 | deletion | Frame_Shift_Del | novel | c.762delG | p.Met255TrpfsTer28 | p.M255Wfs*28 | O94992 | protein_coding | | | TCGA-EW-A2FV-01 | Breast | breast invasive carcinoma | Female | <65 | III/IV | Chemotherapy | docetaxel | SD |
| HEXIM1 | deletion | Frame_Shift_Del | novel | c.709_712delNNNN | p.Ser237MetfsTer45 | p.S237Mfs*45 | O94992 | protein_coding | | | TCGA-OL-A5RW-01 | Breast | breast invasive carcinoma | Female | <65 | I/II | Chemotherapy | adriamycin | CR |
| HEXIM1 | SNV | Missense_Mutation | | c.124G>C | p.Glu42Gln | p.E42Q | O94992 | protein_coding | tolerated_low_confidence(0.07) | benign(0.003) | TCGA-EK-A3GK-01 | Cervix | cervical & endocervical cancer | Female | <65 | I/II | Unknown | Unknown | SD |
| HEXIM1 | SNV | Missense_Mutation | | c.276G>C | p.Gln92His | p.Q92H | O94992 | protein_coding | deleterious_low_confidence(0.05) | benign(0.001) | TCGA-VS-A953-01 | Cervix | cervical & endocervical cancer | Female | <65 | I/II | Unknown | Unknown | PD |
| HEXIM1 | SNV | Missense_Mutation | | c.856G>A | p.Glu286Lys | p.E286K | O94992 | protein_coding | deleterious(0) | possibly_damaging(0.908) | TCGA-CK-4951-01 | Colorectum | colon adenocarcinoma | Female | >=65 | I/II | Unknown | Unknown | PD |
| HEXIM1 | deletion | In_Frame_Del | | c.966_971delNNNNNN | p.Arg323_Glu324del | p.R323_E324del | O94992 | protein_coding | | | TCGA-A6-5665-01 | Colorectum | colon adenocarcinoma | Female | >=65 | I/II | Unknown | Unknown | PD |
| HEXIM1 | SNV | Missense_Mutation | novel | c.630N>T | p.Met210Ile | p.M210I | O94992 | protein_coding | tolerated(0.05) | probably_damaging(0.946) | TCGA-A5-A0G1-01 | Endometrium | uterine corpus endometrioid carcinoma | Female | >=65 | I/II | Unknown | Unknown | SD |
| HEXIM1 | SNV | Missense_Mutation | novel | c.940N>T | p.Arg314Trp | p.R314W | O94992 | protein_coding | tolerated(0.06) | possibly_damaging(0.861) | TCGA-A5-A0G1-01 | Endometrium | uterine corpus endometrioid carcinoma | Female | >=65 | I/II | Unknown | Unknown | SD |
| HEXIM1 | SNV | Missense_Mutation | novel | c.445N>A | p.Gly149Arg | p.G149R | O94992 | protein_coding | deleterious(0.02) | probably_damaging(0.995) | TCGA-AP-A0LS-01 | Endometrium | uterine corpus endometrioid carcinoma | Female | <65 | I/II | Unknown | Unknown | SD |
| HEXIM1 | SNV | Missense_Mutation | rs756233346 | c.225N>C | p.Gln75His | p.Q75H | O94992 | protein_coding | tolerated_low_confidence(0.13) | benign(0.192) | TCGA-BG-A222-01 | Endometrium | uterine corpus endometrioid carcinoma | Female | <65 | I/II | Unknown | Unknown | SD |


