
|
|||||
|
 | |
| |
| |
| |
| |
| |
|
Gene: HES1 |
Gene summary for HES1 |
| Gene information | Species | Human | Gene symbol | HES1 | Gene ID | 3280 |
| Gene name | hes family bHLH transcription factor 1 | |
| Gene Alias | HES-1 | |
| Cytomap | 3q29 | |
| Gene Type | protein-coding | GO ID | GO:0000003 | UniProtAcc | Q14469 |
Top |
Malignant transformation analysis |
| Identification of the aberrant gene expression in precancerous and cancerous lesions by comparing the gene expression of stem-like cells in diseased tissues with normal stem cells |
| Entrez ID | Symbol | Replicates | Species | Organ | Tissue | Adj P-value | Log2FC | Malignancy |
| 3280 | HES1 | GSM4909280 | Human | Breast | Precancer | 1.24e-09 | 7.25e-01 | 0.0305 |
| 3280 | HES1 | GSM4909281 | Human | Breast | IDC | 2.60e-02 | -3.20e-01 | 0.21 |
| 3280 | HES1 | GSM4909282 | Human | Breast | IDC | 4.87e-42 | 9.48e-01 | -0.0288 |
| 3280 | HES1 | GSM4909285 | Human | Breast | IDC | 3.20e-14 | 5.48e-01 | 0.21 |
| 3280 | HES1 | GSM4909286 | Human | Breast | IDC | 6.93e-26 | 5.81e-01 | 0.1081 |
| 3280 | HES1 | GSM4909287 | Human | Breast | IDC | 3.33e-03 | -3.80e-01 | 0.2057 |
| 3280 | HES1 | GSM4909291 | Human | Breast | IDC | 4.29e-26 | 8.63e-01 | 0.1753 |
| 3280 | HES1 | GSM4909293 | Human | Breast | IDC | 2.65e-03 | 3.49e-01 | 0.1581 |
| 3280 | HES1 | GSM4909296 | Human | Breast | IDC | 2.33e-09 | 5.06e-01 | 0.1524 |
| 3280 | HES1 | GSM4909297 | Human | Breast | IDC | 1.57e-04 | 6.48e-02 | 0.1517 |
| 3280 | HES1 | GSM4909298 | Human | Breast | IDC | 2.18e-16 | 6.32e-01 | 0.1551 |
| 3280 | HES1 | GSM4909299 | Human | Breast | IDC | 8.40e-18 | 6.74e-01 | 0.035 |
| 3280 | HES1 | GSM4909300 | Human | Breast | IDC | 9.96e-17 | 8.13e-01 | 0.0334 |
| 3280 | HES1 | GSM4909301 | Human | Breast | IDC | 4.01e-04 | 4.03e-01 | 0.1577 |
| 3280 | HES1 | GSM4909303 | Human | Breast | IDC | 4.29e-04 | 5.59e-01 | 0.0438 |
| 3280 | HES1 | GSM4909304 | Human | Breast | IDC | 1.04e-02 | -3.24e-01 | 0.1636 |
| 3280 | HES1 | GSM4909306 | Human | Breast | IDC | 2.45e-15 | 5.41e-01 | 0.1564 |
| 3280 | HES1 | GSM4909308 | Human | Breast | IDC | 9.15e-04 | 2.67e-01 | 0.158 |
| 3280 | HES1 | GSM4909311 | Human | Breast | IDC | 6.51e-19 | 3.81e-01 | 0.1534 |
| 3280 | HES1 | GSM4909312 | Human | Breast | IDC | 3.87e-18 | 6.28e-01 | 0.1552 |
| Page: 1 2 3 4 5 6 7 8 9 10 11 |
| Tissue | Expression Dynamics | Abbreviation |
| Breast | 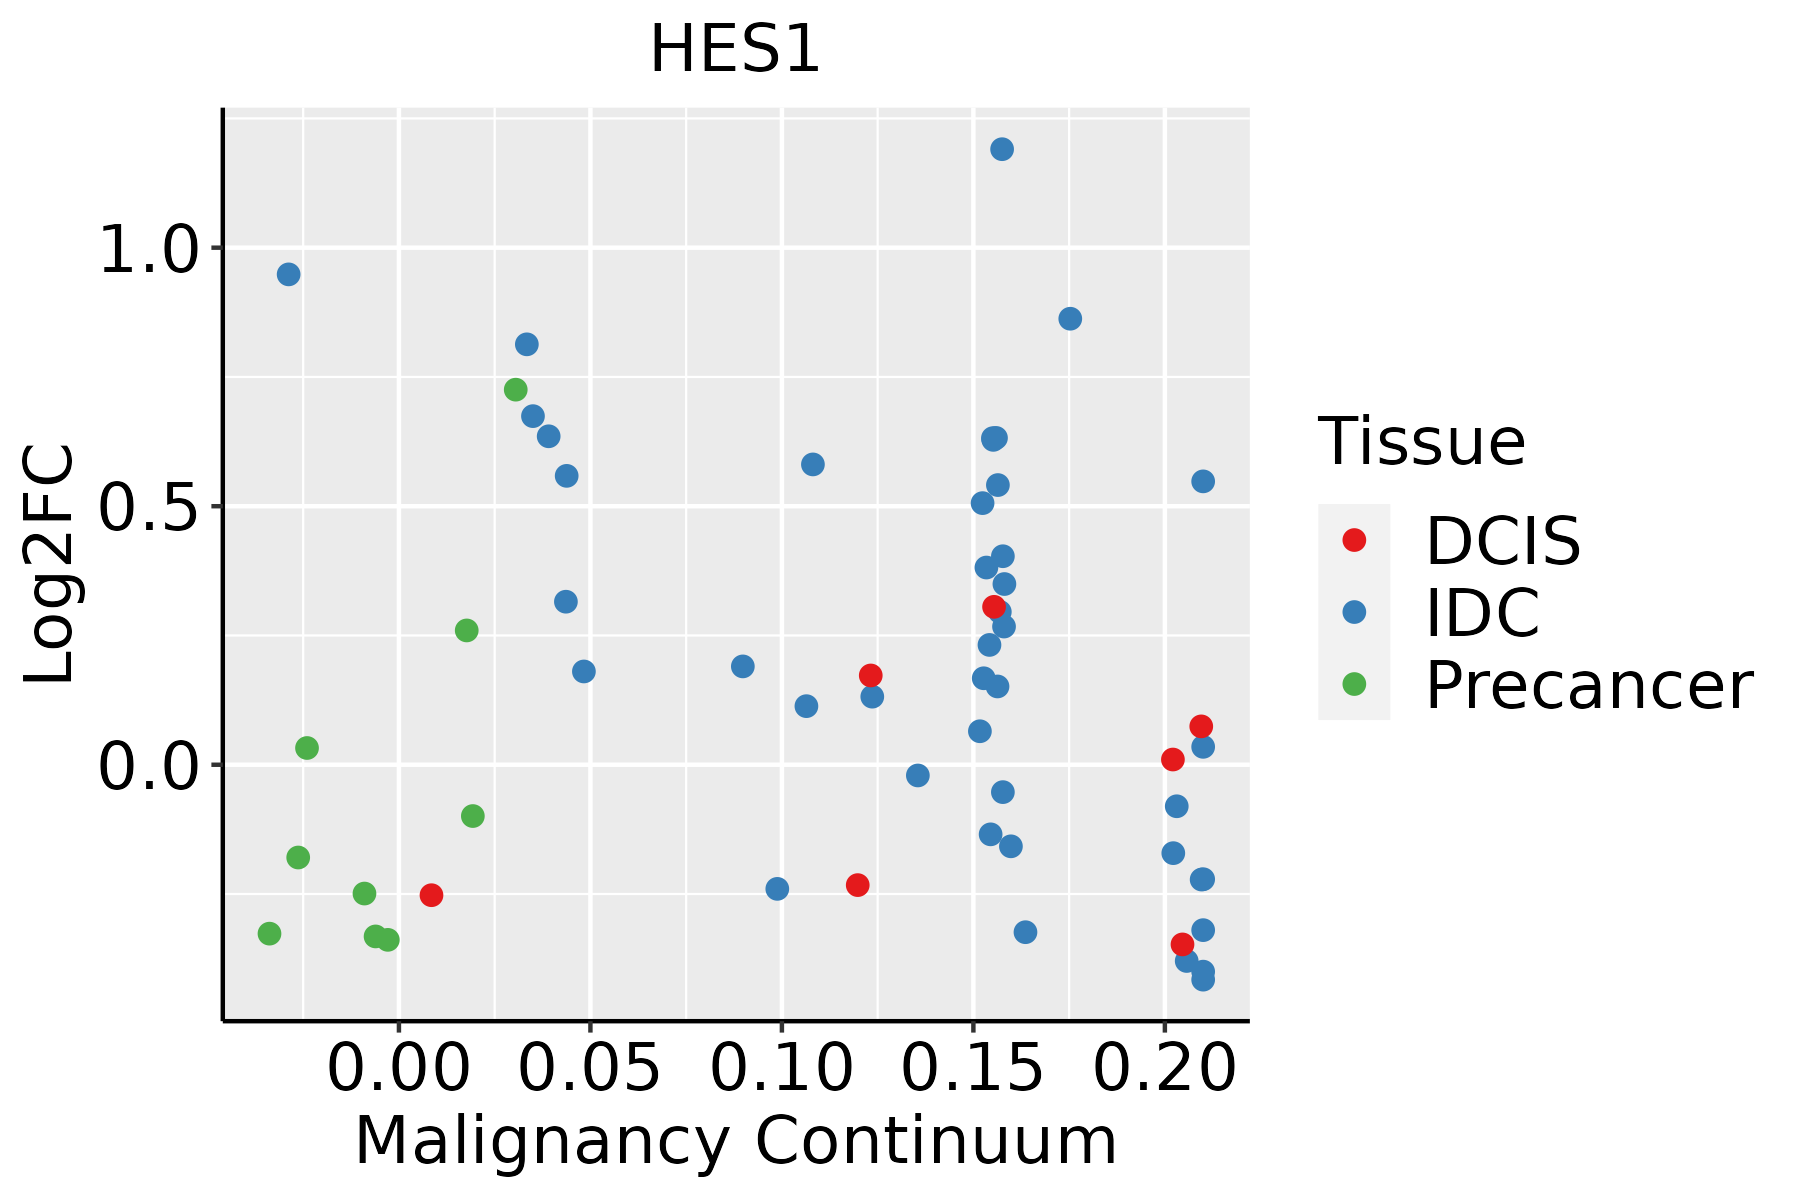 | IDC: Invasive ductal carcinoma |
| DCIS: Ductal carcinoma in situ | ||
| Precancer(BRCA1-mut): Precancerous lesion from BRCA1 mutation carriers | ||
| Cervix | 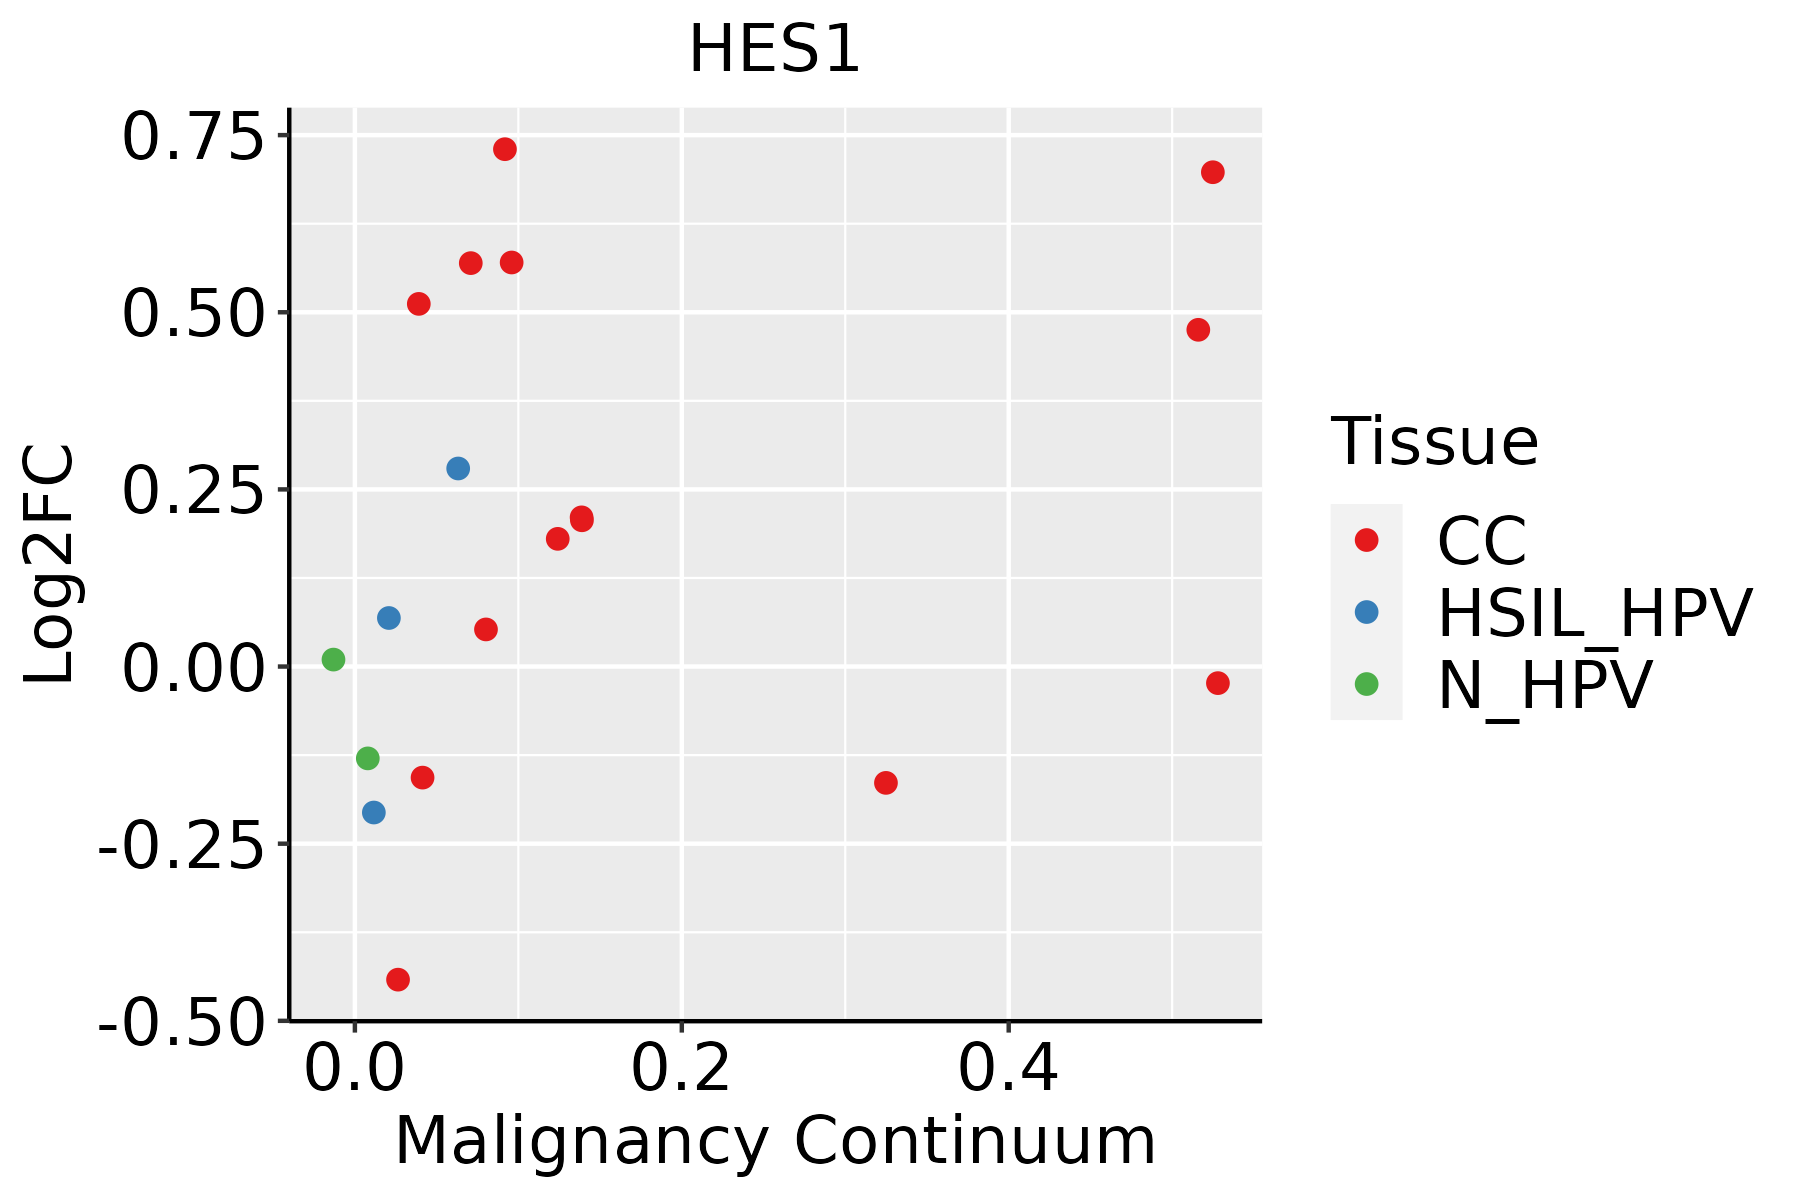 | CC: Cervix cancer |
| HSIL_HPV: HPV-infected high-grade squamous intraepithelial lesions | ||
| N_HPV: HPV-infected normal cervix | ||
| Colorectum (GSE201348) |  | FAP: Familial adenomatous polyposis |
| CRC: Colorectal cancer | ||
| Colorectum (HTA11) |  | AD: Adenomas |
| SER: Sessile serrated lesions | ||
| MSI-H: Microsatellite-high colorectal cancer | ||
| MSS: Microsatellite stable colorectal cancer | ||
| Esophagus |  | ESCC: Esophageal squamous cell carcinoma |
| HGIN: High-grade intraepithelial neoplasias | ||
| LGIN: Low-grade intraepithelial neoplasias | ||
| GC | 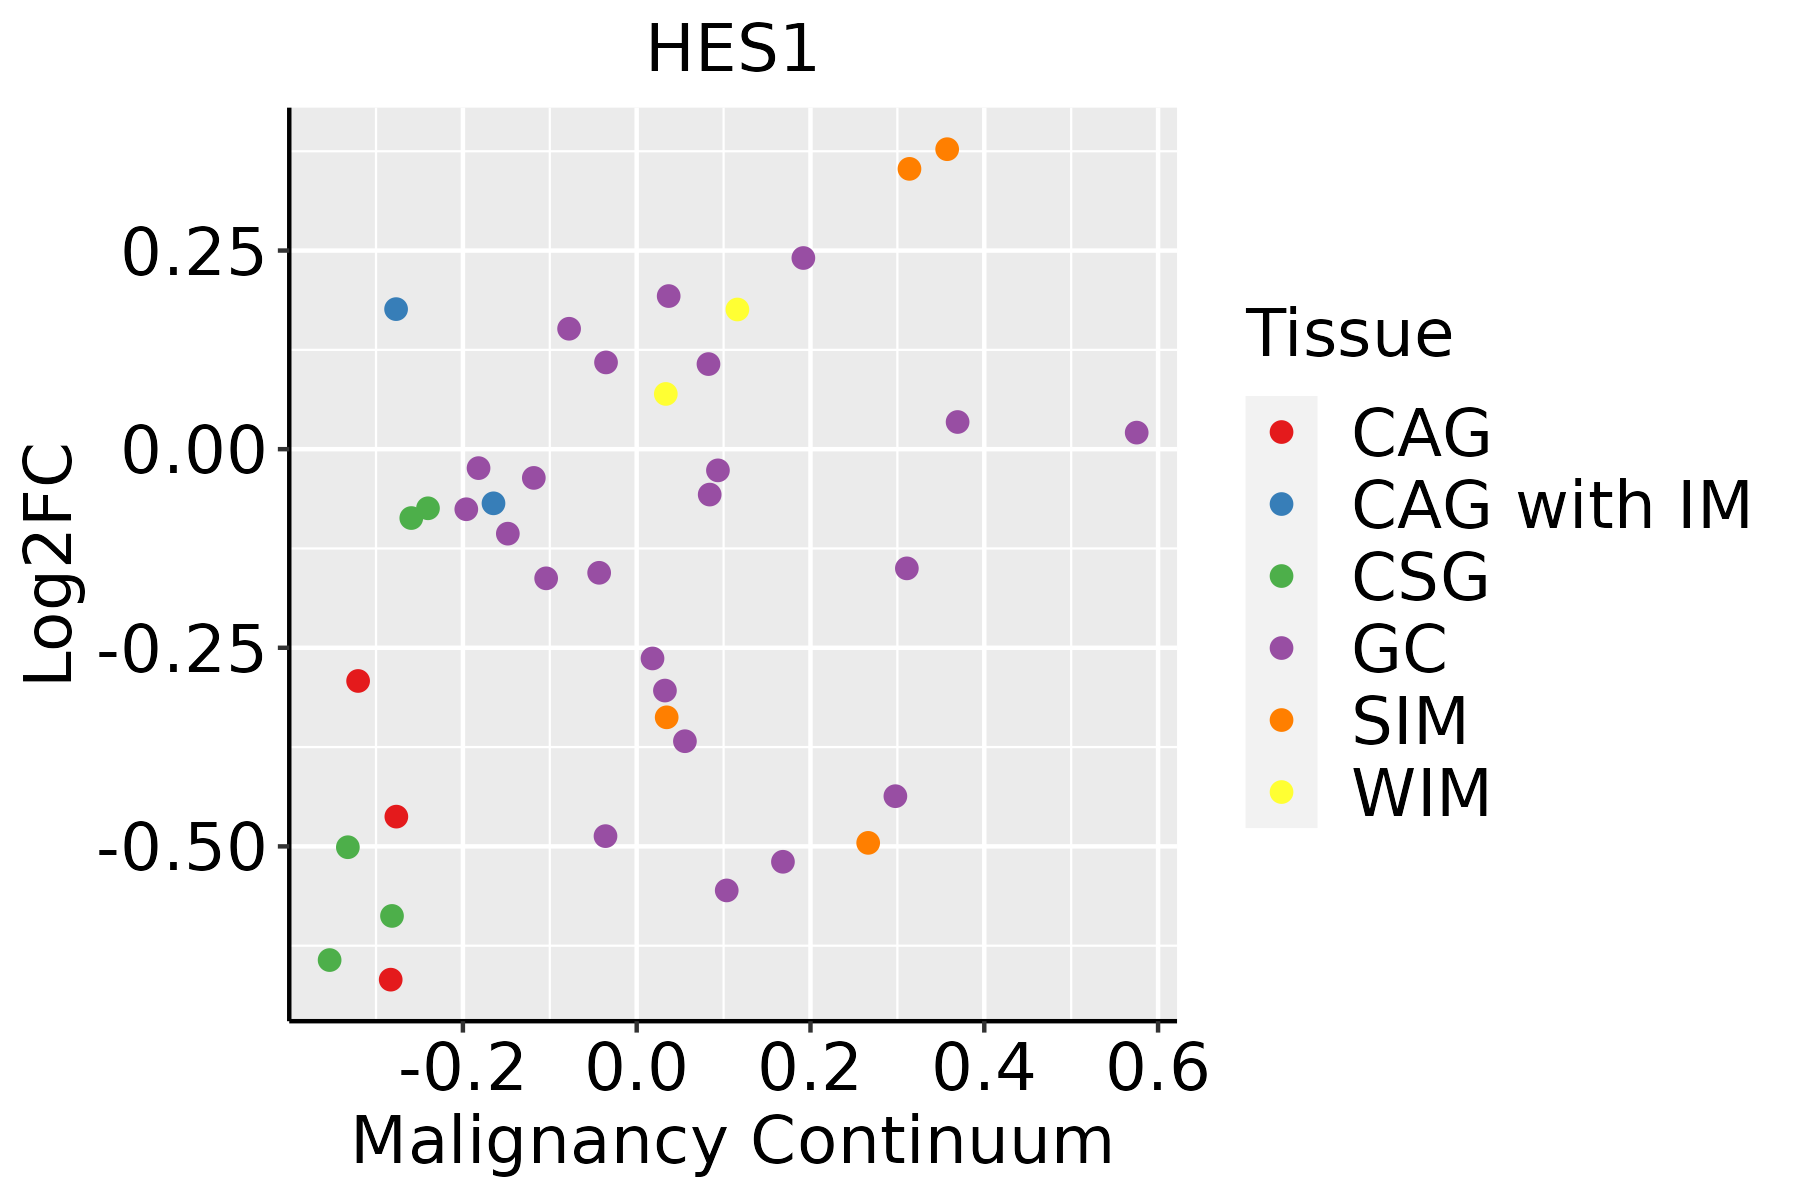 | CAG: Chronic atrophic gastritis |
| CAG with IM: Chronic atrophic gastritis with intestinal metaplasia | ||
| CSG: Chronic superficial gastritis | ||
| GC: Gastric cancer | ||
| SIM: Severe intestinal metaplasia | ||
| WIM: Wild intestinal metaplasia | ||
| Liver | 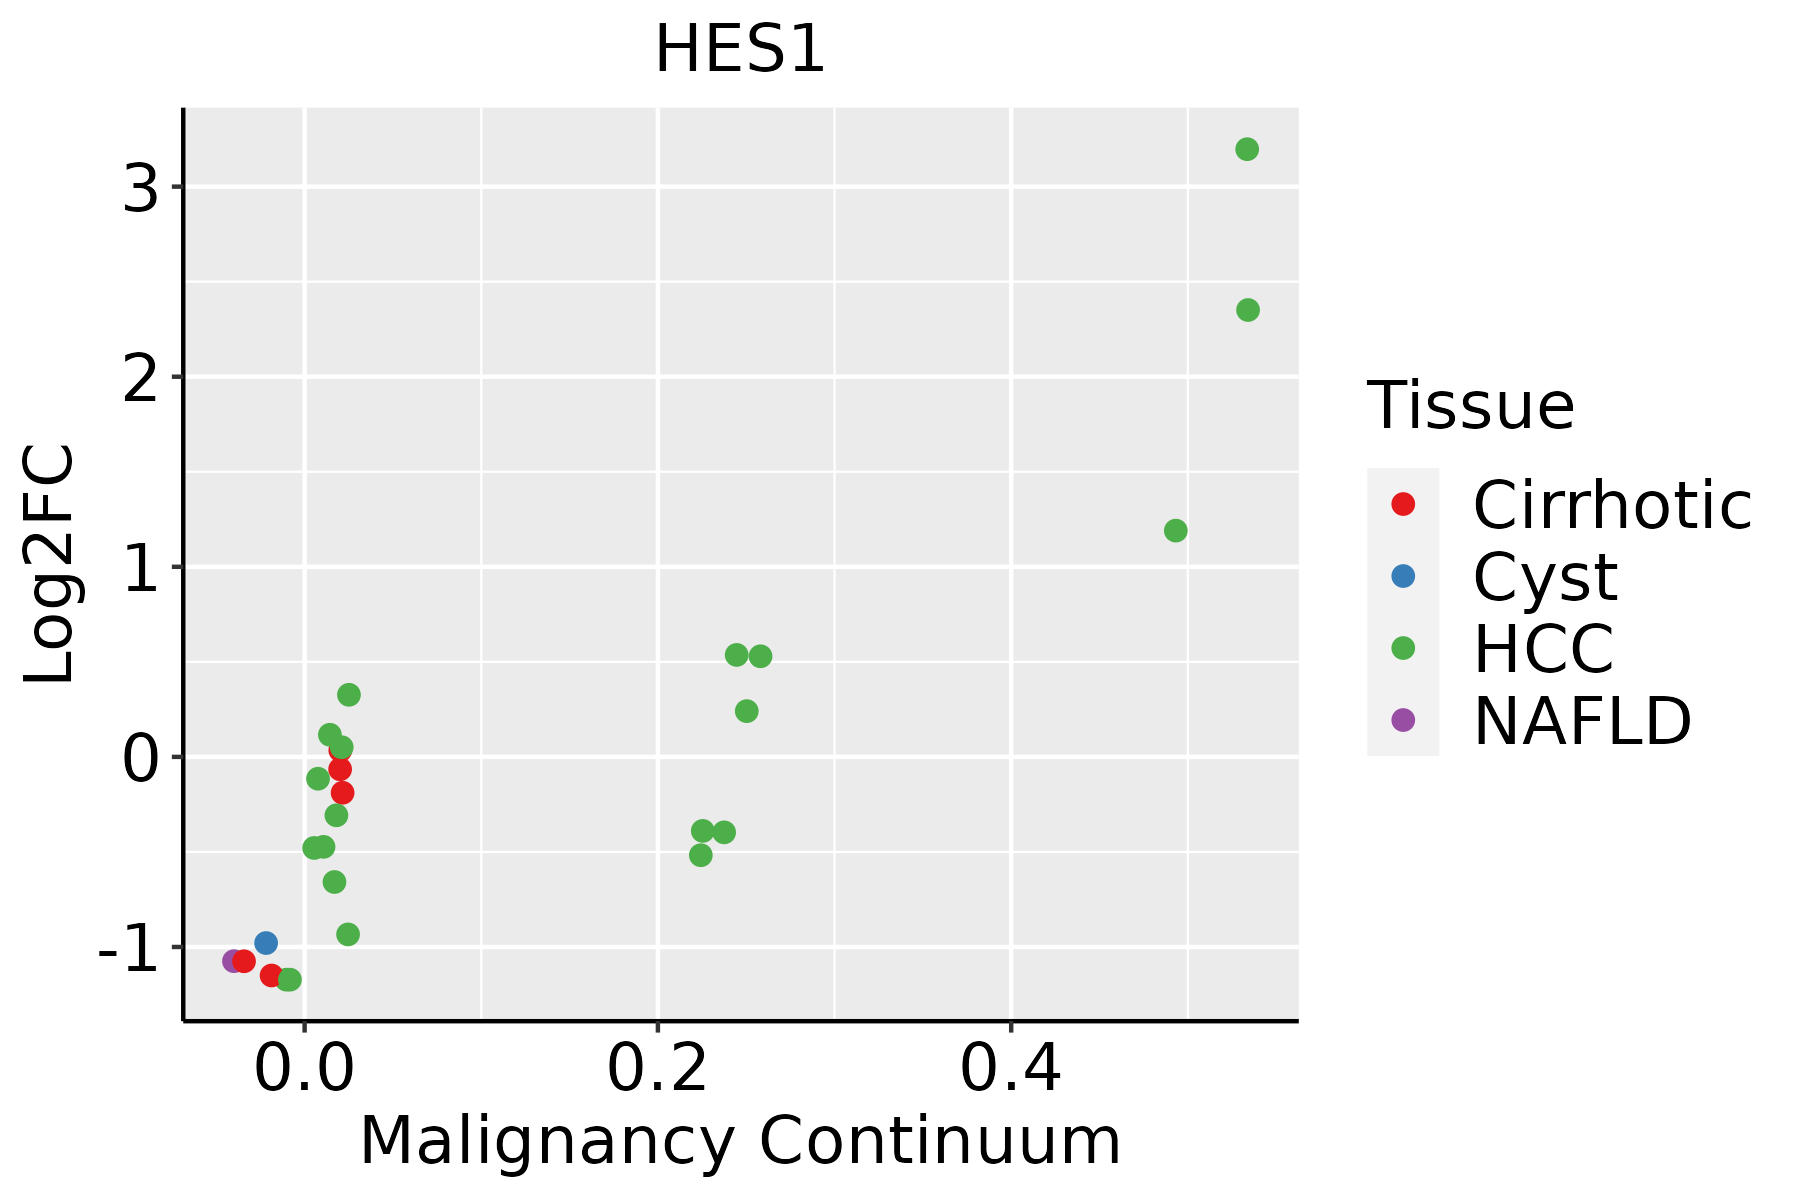 | HCC: Hepatocellular carcinoma |
| NAFLD: Non-alcoholic fatty liver disease | ||
| Oral Cavity | 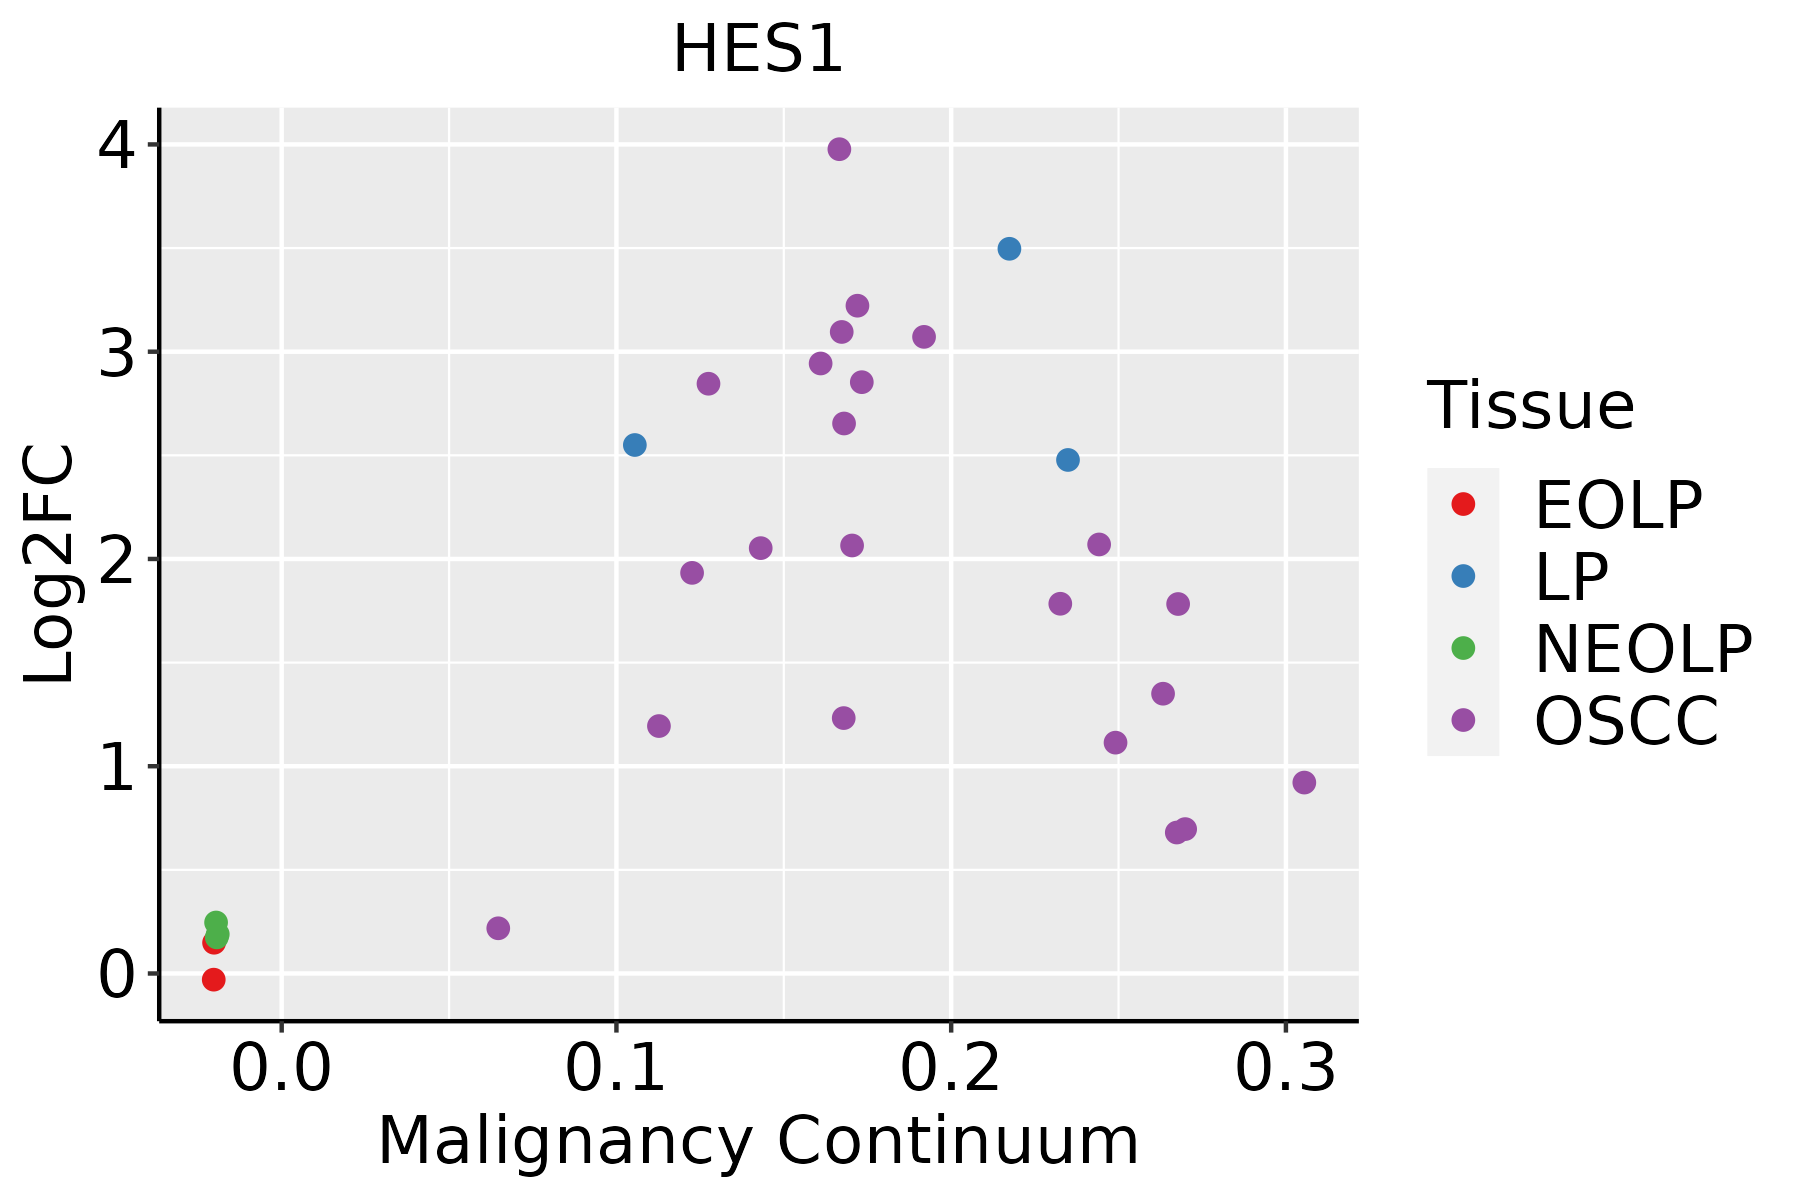 | EOLP: Erosive Oral lichen planus |
| LP: leukoplakia | ||
| NEOLP: Non-erosive oral lichen planus | ||
| OSCC: Oral squamous cell carcinoma | ||
| Prostate |  | BPH: Benign Prostatic Hyperplasia |
| Skin |  | AK: Actinic keratosis |
| cSCC: Cutaneous squamous cell carcinoma | ||
| SCCIS:squamous cell carcinoma in situ | ||
| Thyroid | 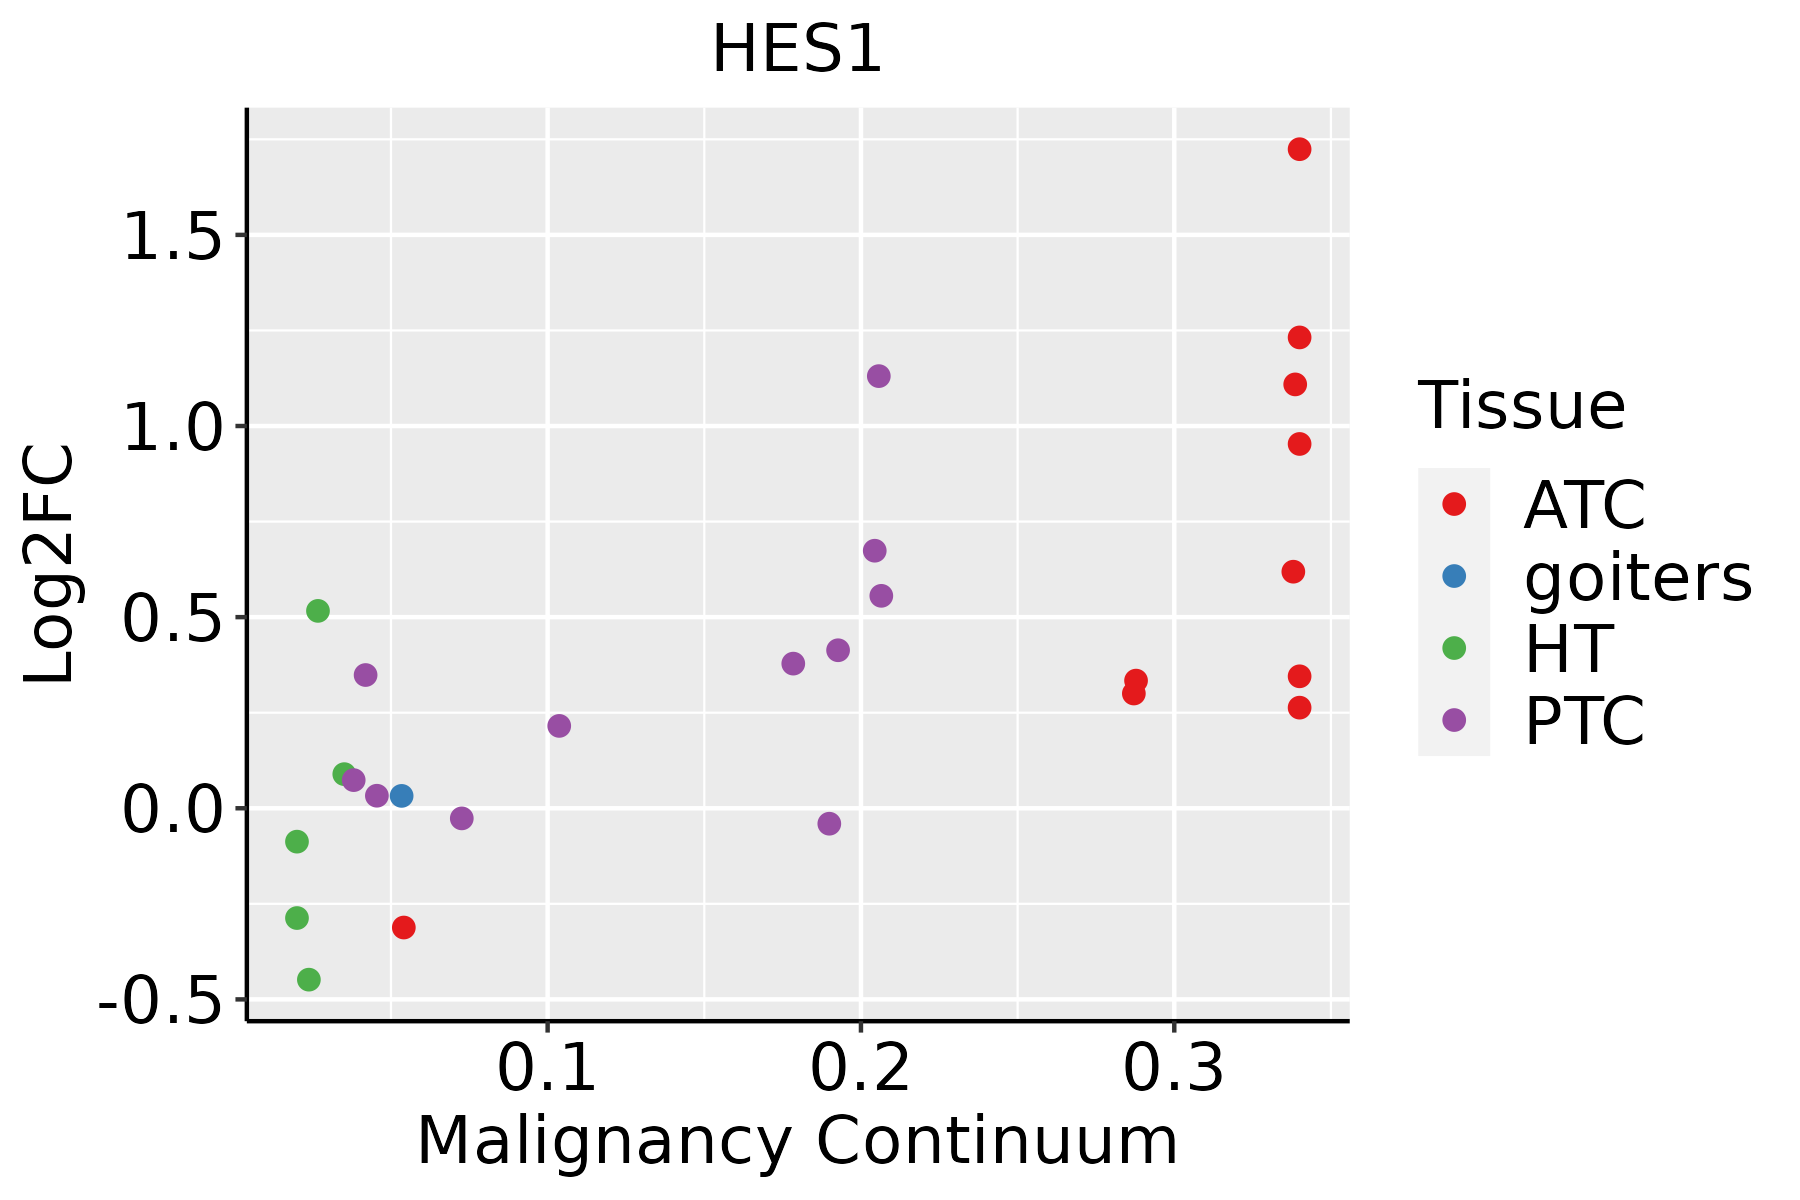 | ATC: Anaplastic thyroid cancer |
| HT: Hashimoto's thyroiditis | ||
| PTC: Papillary thyroid cancer |
| ∗log2FC in expression of this searched gene in stem-like cells from each diseased tissue sample relative to stem-like cells in normal samples in each tissue plotted against the malignancy continuum. Samples are colored based on if they are from different disease stage. |
Top |
Malignant transformation related pathway analysis |
| Find out the enriched GO biological processes and KEGG pathways involved in transition from healthy to precancer to cancer |
| Tissue | Disease Stage | Enriched GO biological Processes |
| Colorectum | AD |  |
| Colorectum | SER |  |
| Colorectum | MSS |  |
| Colorectum | MSI-H |  |
| Colorectum | FAP |  |
| ∗Top 15 enriched GO BP terms are showed in the bar plot of each disease state in each tissue. Each row represents a significant GO biological process which is colored according to the -log10(p.adjust). |
| Page: 1 2 3 4 5 6 7 8 9 |
| GO ID | Tissue | Disease Stage | Description | Gene Ratio | Bg Ratio | pvalue | p.adjust | Count |
| GO:00506713 | Cervix | CC | positive regulation of lymphocyte proliferation | 27/2311 | 137/18723 | 8.99e-03 | 4.57e-02 | 27 |
| GO:00487624 | Cervix | CC | mesenchymal cell differentiation | 42/2311 | 236/18723 | 9.12e-03 | 4.60e-02 | 42 |
| GO:00329463 | Cervix | CC | positive regulation of mononuclear cell proliferation | 27/2311 | 138/18723 | 9.89e-03 | 4.85e-02 | 27 |
| GO:0072170 | Cervix | CC | metanephric tubule development | 7/2311 | 21/18723 | 1.04e-02 | 4.97e-02 | 7 |
| GO:0072243 | Cervix | CC | metanephric nephron epithelium development | 7/2311 | 21/18723 | 1.04e-02 | 4.97e-02 | 7 |
| GO:0048732 | Colorectum | AD | gland development | 149/3918 | 436/18723 | 6.07e-11 | 6.33e-09 | 149 |
| GO:0051098 | Colorectum | AD | regulation of binding | 126/3918 | 363/18723 | 6.01e-10 | 4.88e-08 | 126 |
| GO:0051099 | Colorectum | AD | positive regulation of binding | 66/3918 | 173/18723 | 1.47e-07 | 6.64e-06 | 66 |
| GO:0007163 | Colorectum | AD | establishment or maintenance of cell polarity | 77/3918 | 218/18723 | 5.72e-07 | 2.08e-05 | 77 |
| GO:0061008 | Colorectum | AD | hepaticobiliary system development | 55/3918 | 150/18723 | 6.34e-06 | 1.59e-04 | 55 |
| GO:0001889 | Colorectum | AD | liver development | 54/3918 | 147/18723 | 7.20e-06 | 1.77e-04 | 54 |
| GO:0001701 | Colorectum | AD | in utero embryonic development | 110/3918 | 367/18723 | 2.36e-05 | 4.62e-04 | 110 |
| GO:0001890 | Colorectum | AD | placenta development | 51/3918 | 144/18723 | 3.99e-05 | 7.16e-04 | 51 |
| GO:0001892 | Colorectum | AD | embryonic placenta development | 33/3918 | 82/18723 | 5.30e-05 | 9.01e-04 | 33 |
| GO:0030010 | Colorectum | AD | establishment of cell polarity | 50/3918 | 143/18723 | 6.90e-05 | 1.11e-03 | 50 |
| GO:0051101 | Colorectum | AD | regulation of DNA binding | 42/3918 | 118/18723 | 1.62e-04 | 2.23e-03 | 42 |
| GO:0035315 | Colorectum | AD | hair cell differentiation | 21/3918 | 47/18723 | 2.14e-04 | 2.82e-03 | 21 |
| GO:0045785 | Colorectum | AD | positive regulation of cell adhesion | 122/3918 | 437/18723 | 2.65e-04 | 3.28e-03 | 122 |
| GO:0010720 | Colorectum | AD | positive regulation of cell development | 87/3918 | 298/18723 | 4.17e-04 | 4.71e-03 | 87 |
| GO:0043388 | Colorectum | AD | positive regulation of DNA binding | 23/3918 | 56/18723 | 4.91e-04 | 5.32e-03 | 23 |
| Page: 1 2 3 4 5 6 7 8 9 10 11 12 13 14 15 16 17 18 19 20 21 22 23 24 25 26 27 28 29 30 31 32 33 34 35 36 37 38 39 40 41 42 43 44 45 46 47 48 49 50 51 52 53 54 55 56 57 58 59 60 61 62 63 64 65 66 67 68 69 70 71 72 73 74 75 76 77 78 79 80 |
| Pathway ID | Tissue | Disease Stage | Description | Gene Ratio | Bg Ratio | pvalue | p.adjust | qvalue | Count |
| hsa0516918 | Breast | Precancer | Epstein-Barr virus infection | 35/684 | 202/8465 | 1.15e-05 | 1.26e-04 | 9.64e-05 | 35 |
| hsa0516919 | Breast | Precancer | Epstein-Barr virus infection | 35/684 | 202/8465 | 1.15e-05 | 1.26e-04 | 9.64e-05 | 35 |
| hsa0516922 | Breast | IDC | Epstein-Barr virus infection | 45/867 | 202/8465 | 3.16e-07 | 6.05e-06 | 4.52e-06 | 45 |
| hsa0516932 | Breast | IDC | Epstein-Barr virus infection | 45/867 | 202/8465 | 3.16e-07 | 6.05e-06 | 4.52e-06 | 45 |
| hsa0516941 | Breast | DCIS | Epstein-Barr virus infection | 46/846 | 202/8465 | 5.60e-08 | 1.13e-06 | 8.33e-07 | 46 |
| hsa0516951 | Breast | DCIS | Epstein-Barr virus infection | 46/846 | 202/8465 | 5.60e-08 | 1.13e-06 | 8.33e-07 | 46 |
| hsa0516920 | Cervix | CC | Epstein-Barr virus infection | 57/1267 | 202/8465 | 7.30e-07 | 7.39e-06 | 4.37e-06 | 57 |
| hsa051657 | Cervix | CC | Human papillomavirus infection | 74/1267 | 331/8465 | 1.70e-04 | 1.02e-03 | 6.03e-04 | 74 |
| hsa04330 | Cervix | CC | Notch signaling pathway | 17/1267 | 62/8465 | 7.99e-03 | 2.56e-02 | 1.51e-02 | 17 |
| hsa05224 | Cervix | CC | Breast cancer | 32/1267 | 147/8465 | 1.66e-02 | 4.88e-02 | 2.88e-02 | 32 |
| hsa05169110 | Cervix | CC | Epstein-Barr virus infection | 57/1267 | 202/8465 | 7.30e-07 | 7.39e-06 | 4.37e-06 | 57 |
| hsa0516512 | Cervix | CC | Human papillomavirus infection | 74/1267 | 331/8465 | 1.70e-04 | 1.02e-03 | 6.03e-04 | 74 |
| hsa043301 | Cervix | CC | Notch signaling pathway | 17/1267 | 62/8465 | 7.99e-03 | 2.56e-02 | 1.51e-02 | 17 |
| hsa052241 | Cervix | CC | Breast cancer | 32/1267 | 147/8465 | 1.66e-02 | 4.88e-02 | 2.88e-02 | 32 |
| hsa05169 | Colorectum | MSS | Epstein-Barr virus infection | 63/1875 | 202/8465 | 1.63e-03 | 8.98e-03 | 5.50e-03 | 63 |
| hsa051691 | Colorectum | MSS | Epstein-Barr virus infection | 63/1875 | 202/8465 | 1.63e-03 | 8.98e-03 | 5.50e-03 | 63 |
| hsa05169210 | Esophagus | ESCC | Epstein-Barr virus infection | 151/4205 | 202/8465 | 1.55e-13 | 3.45e-12 | 1.77e-12 | 151 |
| hsa0516510 | Esophagus | ESCC | Human papillomavirus infection | 215/4205 | 331/8465 | 7.86e-09 | 7.12e-08 | 3.65e-08 | 215 |
| hsa043306 | Esophagus | ESCC | Notch signaling pathway | 42/4205 | 62/8465 | 2.97e-03 | 7.97e-03 | 4.08e-03 | 42 |
| hsa0516937 | Esophagus | ESCC | Epstein-Barr virus infection | 151/4205 | 202/8465 | 1.55e-13 | 3.45e-12 | 1.77e-12 | 151 |
| Page: 1 2 3 4 |
Top |
Cell-cell communication analysis |
| Identification of potential cell-cell interactions between two cell types and their ligand-receptor pairs for different disease states |
| Ligand | Receptor | LRpair | Pathway | Tissue | Disease Stage |
| Page: 1 |
Top |
Single-cell gene regulatory network inference analysis |
| Find out the significant the regulons (TFs) and the target genes of each regulon across cell types for different disease states |
| TF | Cell Type | Tissue | Disease Stage | Target Gene | RSS | Regulon Activity |
| HES1 | DC | Breast | Healthy | HSPB1,CCL3L1,IFI30, etc. | 3.35e-01 |  |
| HES1 | DC | Breast | IDC | HSPB1,CCL3L1,IFI30, etc. | 9.06e-02 |  |
| HES1 | ASC | Colorectum | CRC | ZFP36L2,CNIH3,NBEA, etc. | 3.30e-01 |  |
| HES1 | SURF | Endometrium | AEH | HLA-DRB1,OAT,EPS8L1, etc. | 3.01e-01 |  |
| HES1 | QUIE | Esophagus | ESCC | ZNF750,RHOV,IER2, etc. | 7.38e-02 |  |
| HES1 | PRO | Esophagus | Healthy | DNAJB1,ZFP36,DUSP1, etc. | 1.93e-01 |  |
| HES1 | MAIT | Lung | ADJ | SMIM25,DNAJB1,CALHM6, etc. | 3.68e-02 |  |
| HES1 | LC | Lung | AIS | P2RY11,SDS,AL353135.2, etc. | 2.56e-01 |  |
| HES1 | MAST | Lung | AIS | P2RY11,SDS,AL353135.2, etc. | 3.66e-01 | |
| HES1 | pDC | Lung | AIS | P2RY11,SDS,AL353135.2, etc. | 1.04e-02 | |
| ∗The dot plots of a searched regulon are shown for all cell subpopulations in each disease state of each tissue based on the regulon specific score inferred using pySCENIC and by calculating the average expression. |
| Page: 1 2 3 4 |
Top |
Somatic mutation of malignant transformation related genes |
| Annotation of somatic variants for genes involved in malignant transformation |
| Hugo Symbol | Variant Class | Variant Classification | dbSNP RS | HGVSc | HGVSp | HGVSp Short | SWISSPROT | BIOTYPE | SIFT | PolyPhen | Tumor Sample Barcode | Tissue | Histology | Sex | Age | Stage | Therapy Types | Drugs | Outcome |
| HES1 | SNV | Missense_Mutation | c.137G>A | p.Arg46Gln | p.R46Q | Q14469 | protein_coding | deleterious(0) | probably_damaging(1) | TCGA-BH-A2L8-01 | Breast | breast invasive carcinoma | Female | <65 | I/II | Chemotherapy | cytoxan | CR | |
| HES1 | SNV | Missense_Mutation | novel | c.387G>T | p.Glu129Asp | p.E129D | Q14469 | protein_coding | tolerated(0.31) | benign(0.05) | TCGA-2W-A8YY-01 | Cervix | cervical & endocervical cancer | Female | <65 | I/II | Chemotherapy | cisplatin | CR |
| HES1 | SNV | Missense_Mutation | c.104N>A | p.Arg35Lys | p.R35K | Q14469 | protein_coding | tolerated(0.06) | probably_damaging(0.988) | TCGA-LP-A4AV-01 | Cervix | cervical & endocervical cancer | Female | <65 | I/II | Unknown | Unknown | SD | |
| HES1 | SNV | Missense_Mutation | c.412C>G | p.Arg138Gly | p.R138G | Q14469 | protein_coding | deleterious(0.02) | possibly_damaging(0.627) | TCGA-Q1-A73O-01 | Cervix | cervical & endocervical cancer | Female | <65 | I/II | Chemotherapy | cisplatin | CR | |
| HES1 | SNV | Missense_Mutation | c.778N>A | p.Ala260Thr | p.A260T | Q14469 | protein_coding | tolerated(0.08) | benign(0.222) | TCGA-AA-3492-01 | Colorectum | colon adenocarcinoma | Female | >=65 | I/II | Unknown | Unknown | SD | |
| HES1 | SNV | Missense_Mutation | c.329A>G | p.Tyr110Cys | p.Y110C | Q14469 | protein_coding | deleterious(0) | probably_damaging(0.999) | TCGA-AA-3672-01 | Colorectum | colon adenocarcinoma | Female | >=65 | III/IV | Unknown | Unknown | SD | |
| HES1 | SNV | Missense_Mutation | c.725N>A | p.Gly242Asp | p.G242D | Q14469 | protein_coding | deleterious(0.02) | possibly_damaging(0.697) | TCGA-CA-5256-01 | Colorectum | colon adenocarcinoma | Female | <65 | I/II | Chemotherapy | oxaliplatin | CR | |
| HES1 | SNV | Missense_Mutation | c.13N>C | p.Ile5Leu | p.I5L | Q14469 | protein_coding | tolerated_low_confidence(0.34) | benign(0) | TCGA-B5-A11N-01 | Endometrium | uterine corpus endometrioid carcinoma | Female | >=65 | I/II | Unknown | Unknown | SD | |
| HES1 | SNV | Missense_Mutation | novel | c.202G>T | p.Asp68Tyr | p.D68Y | Q14469 | protein_coding | deleterious(0) | probably_damaging(0.999) | TCGA-BK-A6W3-01 | Endometrium | uterine corpus endometrioid carcinoma | Female | <65 | I/II | Unknown | Unknown | SD |
| HES1 | SNV | Missense_Mutation | c.778G>A | p.Ala260Thr | p.A260T | Q14469 | protein_coding | tolerated(0.08) | benign(0.222) | TCGA-D1-A2G0-01 | Endometrium | uterine corpus endometrioid carcinoma | Female | >=65 | I/II | Unknown | Unknown | SD |
| Page: 1 2 |
Top |
Related drugs of malignant transformation related genes |
| Identification of chemicals and drugs interact with genes involved in malignant transfromation |
| (DGIdb 4.0) |
| Entrez ID | Symbol | Category | Interaction Types | Drug Claim Name | Drug Name | PMIDs |
| 3280 | HES1 | TRANSCRIPTION FACTOR | ALL-TRANS-RETINOIC ACID | 12080040 |
| Page: 1 |

Copyright 2023-Present -The University of Texas Health Science Center at Houston |