
|
|||||
|
 | |
| |
| |
| |
| |
| |
|
Gene: HAX1 |
Gene summary for HAX1 |
| Gene information | Species | Human | Gene symbol | HAX1 | Gene ID | 10456 |
| Gene name | HCLS1 associated protein X-1 | |
| Gene Alias | HCLSBP1 | |
| Cytomap | 1q21.3 | |
| Gene Type | protein-coding | GO ID | GO:0000422 | UniProtAcc | A0A0S2Z565 |
Top |
Malignant transformation analysis |
| Identification of the aberrant gene expression in precancerous and cancerous lesions by comparing the gene expression of stem-like cells in diseased tissues with normal stem cells |
| Entrez ID | Symbol | Replicates | Species | Organ | Tissue | Adj P-value | Log2FC | Malignancy |
| 10456 | HAX1 | HTA11_2487_2000001011 | Human | Colorectum | SER | 1.86e-02 | 1.95e-01 | -0.1808 |
| 10456 | HAX1 | HTA11_2951_2000001011 | Human | Colorectum | AD | 2.75e-04 | 3.95e-01 | 0.0216 |
| 10456 | HAX1 | HTA11_1938_2000001011 | Human | Colorectum | AD | 1.41e-09 | 3.95e-01 | -0.0811 |
| 10456 | HAX1 | HTA11_78_2000001011 | Human | Colorectum | AD | 4.86e-03 | 1.52e-01 | -0.1088 |
| 10456 | HAX1 | HTA11_347_2000001011 | Human | Colorectum | AD | 1.07e-15 | 3.54e-01 | -0.1954 |
| 10456 | HAX1 | HTA11_2112_2000001011 | Human | Colorectum | SER | 1.32e-04 | 4.87e-01 | -0.2196 |
| 10456 | HAX1 | HTA11_3361_2000001011 | Human | Colorectum | AD | 5.97e-05 | 2.42e-01 | -0.1207 |
| 10456 | HAX1 | HTA11_83_2000001011 | Human | Colorectum | SER | 5.79e-04 | 3.13e-01 | -0.1526 |
| 10456 | HAX1 | HTA11_696_2000001011 | Human | Colorectum | AD | 6.31e-18 | 4.11e-01 | -0.1464 |
| 10456 | HAX1 | HTA11_866_2000001011 | Human | Colorectum | AD | 7.52e-05 | 2.25e-01 | -0.1001 |
| 10456 | HAX1 | HTA11_1391_2000001011 | Human | Colorectum | AD | 2.72e-16 | 5.37e-01 | -0.059 |
| 10456 | HAX1 | HTA11_2992_2000001011 | Human | Colorectum | SER | 3.08e-05 | 3.76e-01 | -0.1706 |
| 10456 | HAX1 | HTA11_5216_2000001011 | Human | Colorectum | SER | 3.54e-03 | 3.95e-01 | -0.1462 |
| 10456 | HAX1 | HTA11_546_2000001011 | Human | Colorectum | AD | 3.68e-06 | 3.01e-01 | -0.0842 |
| 10456 | HAX1 | HTA11_9341_2000001011 | Human | Colorectum | SER | 4.24e-02 | 2.85e-01 | -0.00410000000000005 |
| 10456 | HAX1 | HTA11_7862_2000001011 | Human | Colorectum | AD | 1.05e-02 | 2.59e-01 | -0.0179 |
| 10456 | HAX1 | HTA11_866_3004761011 | Human | Colorectum | AD | 2.13e-16 | 4.31e-01 | 0.096 |
| 10456 | HAX1 | HTA11_4255_2000001011 | Human | Colorectum | SER | 1.69e-03 | 3.43e-01 | 0.0446 |
| 10456 | HAX1 | HTA11_10711_2000001011 | Human | Colorectum | AD | 6.55e-05 | 2.12e-01 | 0.0338 |
| 10456 | HAX1 | HTA11_7696_3000711011 | Human | Colorectum | AD | 6.81e-11 | 3.15e-01 | 0.0674 |
| Page: 1 2 3 4 5 6 7 8 9 |
| Tissue | Expression Dynamics | Abbreviation |
| Colorectum (GSE201348) |  | FAP: Familial adenomatous polyposis |
| CRC: Colorectal cancer | ||
| Colorectum (HTA11) |  | AD: Adenomas |
| SER: Sessile serrated lesions | ||
| MSI-H: Microsatellite-high colorectal cancer | ||
| MSS: Microsatellite stable colorectal cancer | ||
| Esophagus |  | ESCC: Esophageal squamous cell carcinoma |
| HGIN: High-grade intraepithelial neoplasias | ||
| LGIN: Low-grade intraepithelial neoplasias | ||
| Liver | 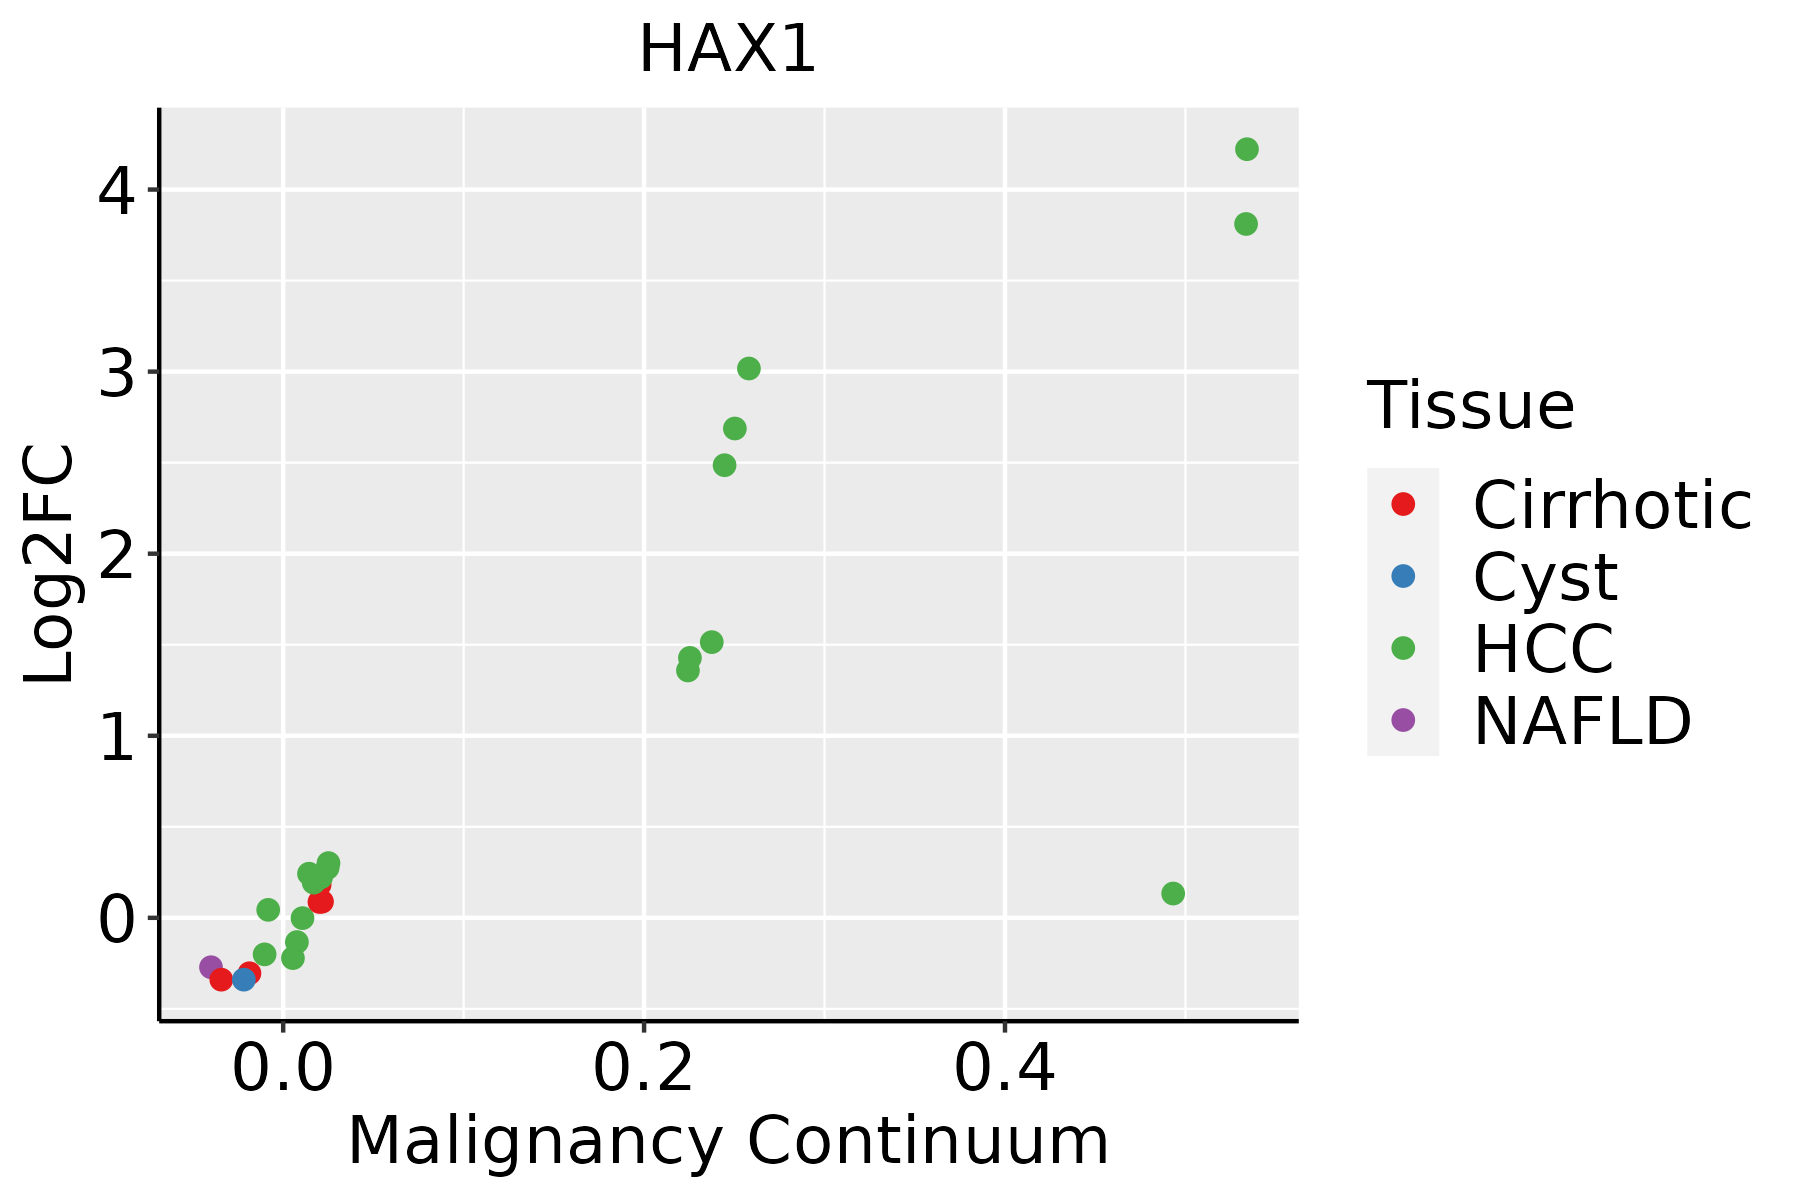 | HCC: Hepatocellular carcinoma |
| NAFLD: Non-alcoholic fatty liver disease | ||
| Oral Cavity | 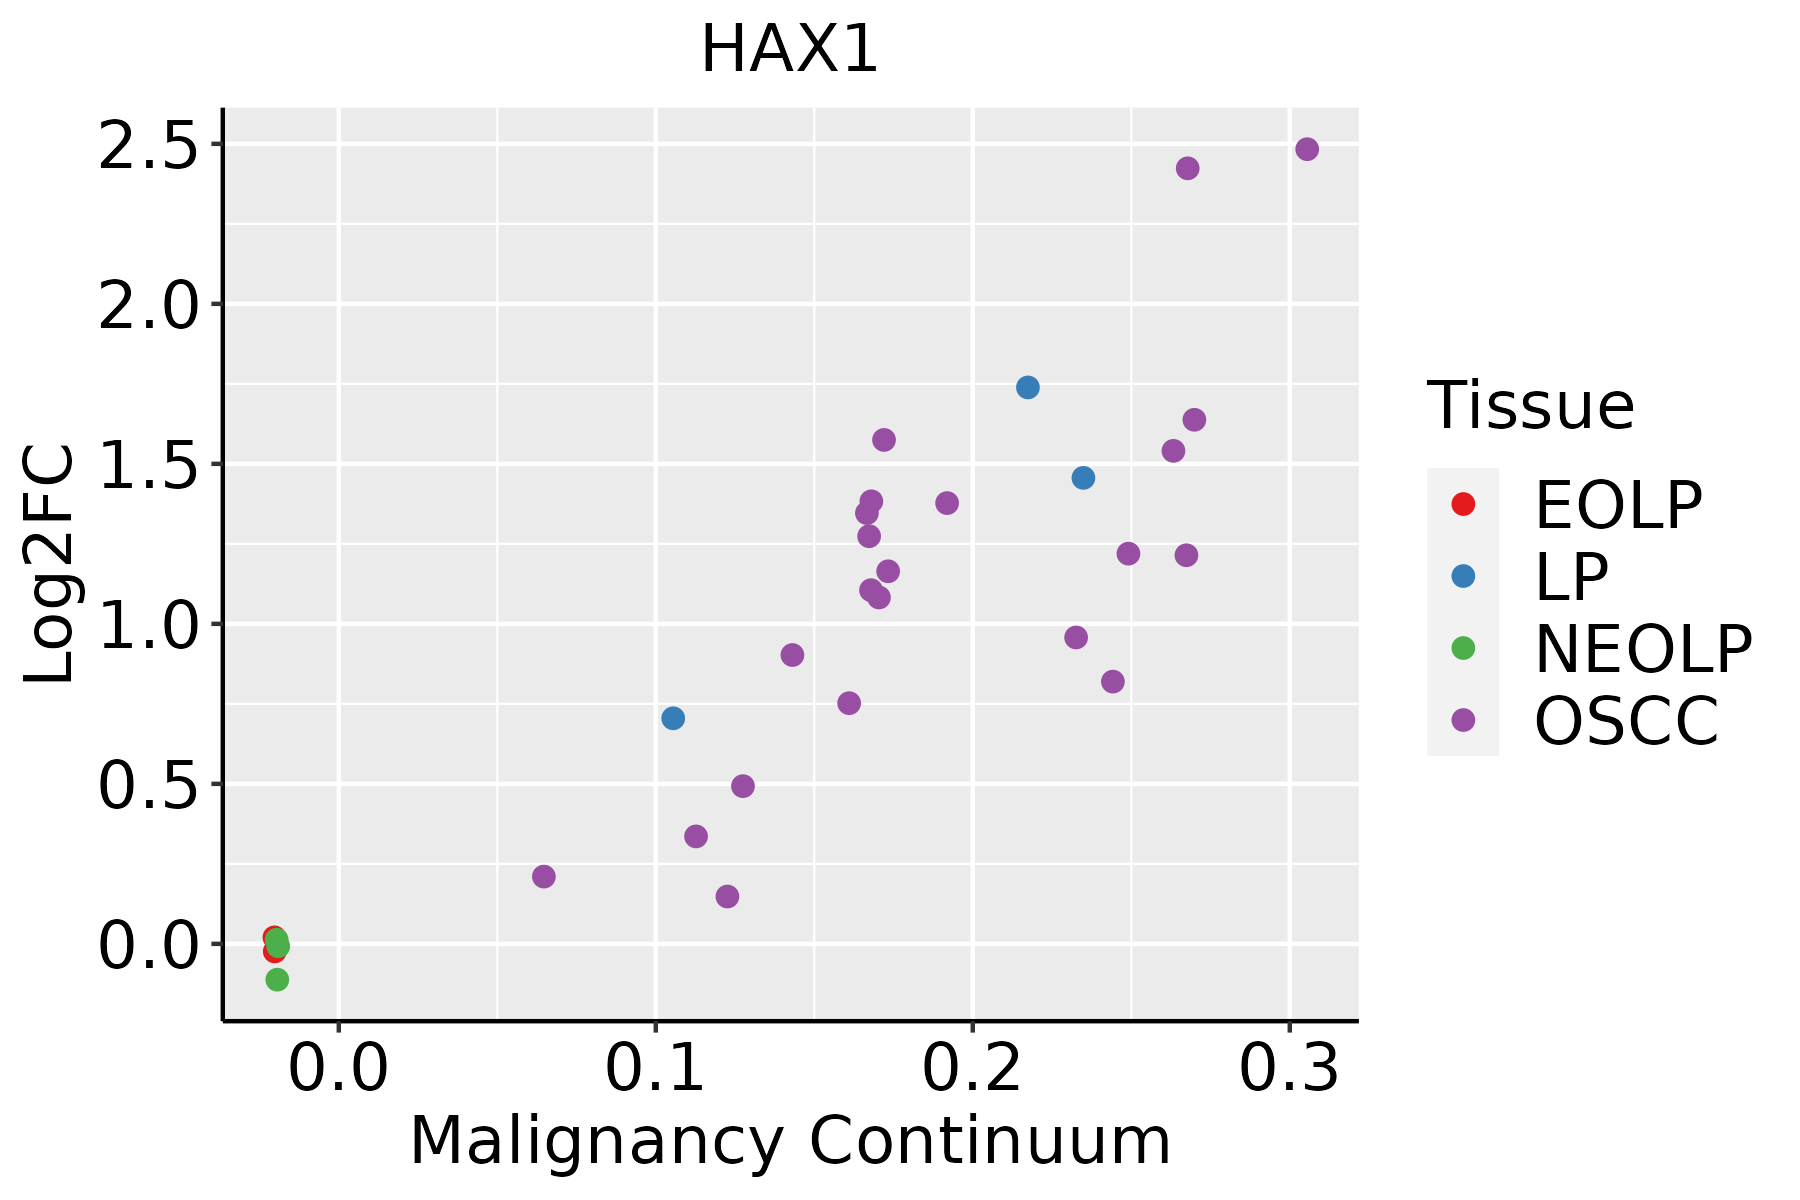 | EOLP: Erosive Oral lichen planus |
| LP: leukoplakia | ||
| NEOLP: Non-erosive oral lichen planus | ||
| OSCC: Oral squamous cell carcinoma | ||
| Skin |  | AK: Actinic keratosis |
| cSCC: Cutaneous squamous cell carcinoma | ||
| SCCIS:squamous cell carcinoma in situ | ||
| Thyroid |  | ATC: Anaplastic thyroid cancer |
| HT: Hashimoto's thyroiditis | ||
| PTC: Papillary thyroid cancer |
| ∗log2FC in expression of this searched gene in stem-like cells from each diseased tissue sample relative to stem-like cells in normal samples in each tissue plotted against the malignancy continuum. Samples are colored based on if they are from different disease stage. |
Top |
Malignant transformation related pathway analysis |
| Find out the enriched GO biological processes and KEGG pathways involved in transition from healthy to precancer to cancer |
| Tissue | Disease Stage | Enriched GO biological Processes |
| Colorectum | AD |  |
| Colorectum | SER |  |
| Colorectum | MSS |  |
| Colorectum | MSI-H |  |
| Colorectum | FAP |  |
| ∗Top 15 enriched GO BP terms are showed in the bar plot of each disease state in each tissue. Each row represents a significant GO biological process which is colored according to the -log10(p.adjust). |
| Page: 1 2 3 4 5 6 7 8 9 |
| GO ID | Tissue | Disease Stage | Description | Gene Ratio | Bg Ratio | pvalue | p.adjust | Count |
| GO:00456395 | Liver | Cirrhotic | positive regulation of myeloid cell differentiation | 37/4634 | 103/18723 | 7.38e-03 | 3.52e-02 | 37 |
| GO:00456377 | Liver | Cirrhotic | regulation of myeloid cell differentiation | 68/4634 | 210/18723 | 7.40e-03 | 3.53e-02 | 68 |
| GO:007259422 | Liver | HCC | establishment of protein localization to organelle | 299/7958 | 422/18723 | 1.06e-32 | 6.10e-30 | 299 |
| GO:000660512 | Liver | HCC | protein targeting | 219/7958 | 314/18723 | 7.74e-23 | 1.49e-20 | 219 |
| GO:003238621 | Liver | HCC | regulation of intracellular transport | 231/7958 | 337/18723 | 1.99e-22 | 3.40e-20 | 231 |
| GO:000683912 | Liver | HCC | mitochondrial transport | 184/7958 | 254/18723 | 2.30e-22 | 3.83e-20 | 184 |
| GO:003315721 | Liver | HCC | regulation of intracellular protein transport | 165/7958 | 229/18723 | 8.37e-20 | 1.15e-17 | 165 |
| GO:002241112 | Liver | HCC | cellular component disassembly | 282/7958 | 443/18723 | 1.02e-19 | 1.38e-17 | 282 |
| GO:007265512 | Liver | HCC | establishment of protein localization to mitochondrion | 98/7958 | 120/18723 | 1.18e-18 | 1.46e-16 | 98 |
| GO:007058512 | Liver | HCC | protein localization to mitochondrion | 101/7958 | 125/18723 | 1.53e-18 | 1.86e-16 | 101 |
| GO:001050621 | Liver | HCC | regulation of autophagy | 210/7958 | 317/18723 | 7.59e-18 | 8.45e-16 | 210 |
| GO:000662612 | Liver | HCC | protein targeting to mitochondrion | 82/7958 | 100/18723 | 4.93e-16 | 4.05e-14 | 82 |
| GO:004325422 | Liver | HCC | regulation of protein-containing complex assembly | 264/7958 | 428/18723 | 5.47e-16 | 4.39e-14 | 264 |
| GO:190300811 | Liver | HCC | organelle disassembly | 89/7958 | 114/18723 | 8.68e-15 | 5.73e-13 | 89 |
| GO:000042211 | Liver | HCC | autophagy of mitochondrion | 64/7958 | 81/18723 | 1.96e-11 | 7.72e-10 | 64 |
| GO:006172611 | Liver | HCC | mitochondrion disassembly | 64/7958 | 81/18723 | 1.96e-11 | 7.72e-10 | 64 |
| GO:005125822 | Liver | HCC | protein polymerization | 182/7958 | 297/18723 | 4.17e-11 | 1.58e-09 | 182 |
| GO:190290322 | Liver | HCC | regulation of supramolecular fiber organization | 224/7958 | 383/18723 | 1.54e-10 | 5.33e-09 | 224 |
| GO:000701522 | Liver | HCC | actin filament organization | 252/7958 | 442/18723 | 3.83e-10 | 1.25e-08 | 252 |
| GO:001082112 | Liver | HCC | regulation of mitochondrion organization | 96/7958 | 144/18723 | 3.82e-09 | 1.02e-07 | 96 |
| Page: 1 2 3 4 5 6 7 8 9 10 11 12 13 14 15 16 17 18 19 20 21 22 23 24 25 26 |
| Pathway ID | Tissue | Disease Stage | Description | Gene Ratio | Bg Ratio | pvalue | p.adjust | qvalue | Count |
| Page: 1 |
Top |
Cell-cell communication analysis |
| Identification of potential cell-cell interactions between two cell types and their ligand-receptor pairs for different disease states |
| Ligand | Receptor | LRpair | Pathway | Tissue | Disease Stage |
| Page: 1 |
Top |
Single-cell gene regulatory network inference analysis |
| Find out the significant the regulons (TFs) and the target genes of each regulon across cell types for different disease states |
| TF | Cell Type | Tissue | Disease Stage | Target Gene | RSS | Regulon Activity |
| ∗The dot plots of a searched regulon are shown for all cell subpopulations in each disease state of each tissue based on the regulon specific score inferred using pySCENIC and by calculating the average expression. |
| Page: 1 |
Top |
Somatic mutation of malignant transformation related genes |
| Annotation of somatic variants for genes involved in malignant transformation |
| Hugo Symbol | Variant Class | Variant Classification | dbSNP RS | HGVSc | HGVSp | HGVSp Short | SWISSPROT | BIOTYPE | SIFT | PolyPhen | Tumor Sample Barcode | Tissue | Histology | Sex | Age | Stage | Therapy Types | Drugs | Outcome |
| HAX1 | SNV | Missense_Mutation | novel | c.511N>A | p.Asp171Asn | p.D171N | O00165 | protein_coding | deleterious(0.01) | probably_damaging(0.999) | TCGA-5L-AAT1-01 | Breast | breast invasive carcinoma | Female | <65 | III/IV | Hormone Therapy | letrozol | SD |
| HAX1 | SNV | Missense_Mutation | novel | c.775C>G | p.Pro259Ala | p.P259A | O00165 | protein_coding | deleterious(0.04) | possibly_damaging(0.561) | TCGA-C8-A3M7-01 | Breast | breast invasive carcinoma | Female | <65 | III/IV | Unknown | Unknown | PD |
| HAX1 | insertion | Nonsense_Mutation | novel | c.492_493insACTATGGAAATTCTAATTCCCTCCCAGTCCAGCTAGCATACAA | p.Pro165ThrfsTer12 | p.P165Tfs*12 | O00165 | protein_coding | TCGA-A2-A0CU-01 | Breast | breast invasive carcinoma | Female | >=65 | I/II | Hormone Therapy | tamoxiphen | SD | ||
| HAX1 | insertion | Frame_Shift_Ins | novel | c.173dupC | p.Glu59Ter | p.E59* | O00165 | protein_coding | TCGA-BH-A18G-01 | Breast | breast invasive carcinoma | Female | >=65 | I/II | Unknown | Unknown | SD | ||
| HAX1 | SNV | Missense_Mutation | c.64N>T | p.Pro22Ser | p.P22S | O00165 | protein_coding | deleterious(0.01) | probably_damaging(0.998) | TCGA-DS-A0VN-01 | Cervix | cervical & endocervical cancer | Female | <65 | I/II | Chemotherapy | cisplatin | SD | |
| HAX1 | SNV | Missense_Mutation | rs769438062 | c.196N>G | p.Ser66Gly | p.S66G | O00165 | protein_coding | tolerated(0.13) | benign(0) | TCGA-AA-A01R-01 | Colorectum | colon adenocarcinoma | Male | <65 | III/IV | Chemotherapy | 5-fluorouracil | PD |
| HAX1 | SNV | Missense_Mutation | c.827N>C | p.Phe276Ser | p.F276S | O00165 | protein_coding | deleterious(0.04) | benign(0.094) | TCGA-AZ-6598-01 | Colorectum | colon adenocarcinoma | Female | >=65 | I/II | Unknown | Unknown | SD | |
| HAX1 | SNV | Missense_Mutation | novel | c.259N>T | p.Asp87Tyr | p.D87Y | O00165 | protein_coding | deleterious(0) | probably_damaging(0.999) | TCGA-CA-6717-01 | Colorectum | colon adenocarcinoma | Male | <65 | I/II | Chemotherapy | oxaliplatin | CR |
| HAX1 | SNV | Missense_Mutation | novel | c.560T>C | p.Leu187Pro | p.L187P | O00165 | protein_coding | deleterious(0) | probably_damaging(1) | TCGA-AJ-A3IA-01 | Endometrium | uterine corpus endometrioid carcinoma | Female | >=65 | I/II | Unknown | Unknown | SD |
| HAX1 | SNV | Missense_Mutation | c.289N>A | p.Ala97Thr | p.A97T | O00165 | protein_coding | tolerated(0.28) | possibly_damaging(0.651) | TCGA-AP-A0LM-01 | Endometrium | uterine corpus endometrioid carcinoma | Female | <65 | III/IV | Chemotherapy | cisplatin | SD |
| Page: 1 2 3 4 |
Top |
Related drugs of malignant transformation related genes |
| Identification of chemicals and drugs interact with genes involved in malignant transfromation |
| (DGIdb 4.0) |
| Entrez ID | Symbol | Category | Interaction Types | Drug Claim Name | Drug Name | PMIDs |
| Page: 1 |

Copyright 2023-Present -The University of Texas Health Science Center at Houston |