
|
|||||
|
 | |
| |
| |
| |
| |
| |
|
Gene: GADD45B |
Gene summary for GADD45B |
| Gene information | Species | Human | Gene symbol | GADD45B | Gene ID | 4616 |
| Gene name | growth arrest and DNA damage inducible beta | |
| Gene Alias | GADD45BETA | |
| Cytomap | 19p13.3 | |
| Gene Type | protein-coding | GO ID | GO:0000165 | UniProtAcc | O75293 |
Top |
Malignant transformation analysis |
| Identification of the aberrant gene expression in precancerous and cancerous lesions by comparing the gene expression of stem-like cells in diseased tissues with normal stem cells |
| Entrez ID | Symbol | Replicates | Species | Organ | Tissue | Adj P-value | Log2FC | Malignancy |
| 4616 | GADD45B | GSM4909281 | Human | Breast | IDC | 3.30e-06 | -4.79e-01 | 0.21 |
| 4616 | GADD45B | GSM4909285 | Human | Breast | IDC | 1.03e-22 | -8.42e-01 | 0.21 |
| 4616 | GADD45B | GSM4909286 | Human | Breast | IDC | 8.44e-17 | -7.42e-01 | 0.1081 |
| 4616 | GADD45B | GSM4909288 | Human | Breast | IDC | 7.74e-07 | -7.01e-01 | 0.0988 |
| 4616 | GADD45B | GSM4909289 | Human | Breast | IDC | 1.77e-02 | -6.71e-01 | 0.1064 |
| 4616 | GADD45B | GSM4909290 | Human | Breast | IDC | 9.46e-23 | -8.68e-01 | 0.2096 |
| 4616 | GADD45B | GSM4909293 | Human | Breast | IDC | 9.06e-17 | -6.99e-01 | 0.1581 |
| 4616 | GADD45B | GSM4909294 | Human | Breast | IDC | 8.44e-17 | -7.39e-01 | 0.2022 |
| 4616 | GADD45B | GSM4909296 | Human | Breast | IDC | 4.74e-02 | -3.54e-01 | 0.1524 |
| 4616 | GADD45B | GSM4909297 | Human | Breast | IDC | 6.44e-04 | -2.41e-01 | 0.1517 |
| 4616 | GADD45B | GSM4909298 | Human | Breast | IDC | 5.37e-13 | -5.69e-01 | 0.1551 |
| 4616 | GADD45B | GSM4909302 | Human | Breast | IDC | 4.99e-11 | -5.65e-01 | 0.1545 |
| 4616 | GADD45B | GSM4909304 | Human | Breast | IDC | 5.54e-11 | -5.93e-01 | 0.1636 |
| 4616 | GADD45B | GSM4909306 | Human | Breast | IDC | 7.89e-04 | 3.64e-02 | 0.1564 |
| 4616 | GADD45B | GSM4909307 | Human | Breast | IDC | 3.04e-08 | -6.01e-01 | 0.1569 |
| 4616 | GADD45B | GSM4909308 | Human | Breast | IDC | 1.05e-02 | 2.79e-01 | 0.158 |
| 4616 | GADD45B | GSM4909309 | Human | Breast | IDC | 7.98e-03 | -3.78e-01 | 0.0483 |
| 4616 | GADD45B | GSM4909311 | Human | Breast | IDC | 1.03e-35 | -8.86e-01 | 0.1534 |
| 4616 | GADD45B | GSM4909312 | Human | Breast | IDC | 1.67e-06 | -4.89e-01 | 0.1552 |
| 4616 | GADD45B | GSM4909315 | Human | Breast | IDC | 1.35e-11 | -5.97e-01 | 0.21 |
| Page: 1 2 3 4 5 6 7 8 9 10 11 |
| Tissue | Expression Dynamics | Abbreviation |
| Breast |  | IDC: Invasive ductal carcinoma |
| DCIS: Ductal carcinoma in situ | ||
| Precancer(BRCA1-mut): Precancerous lesion from BRCA1 mutation carriers | ||
| Cervix | 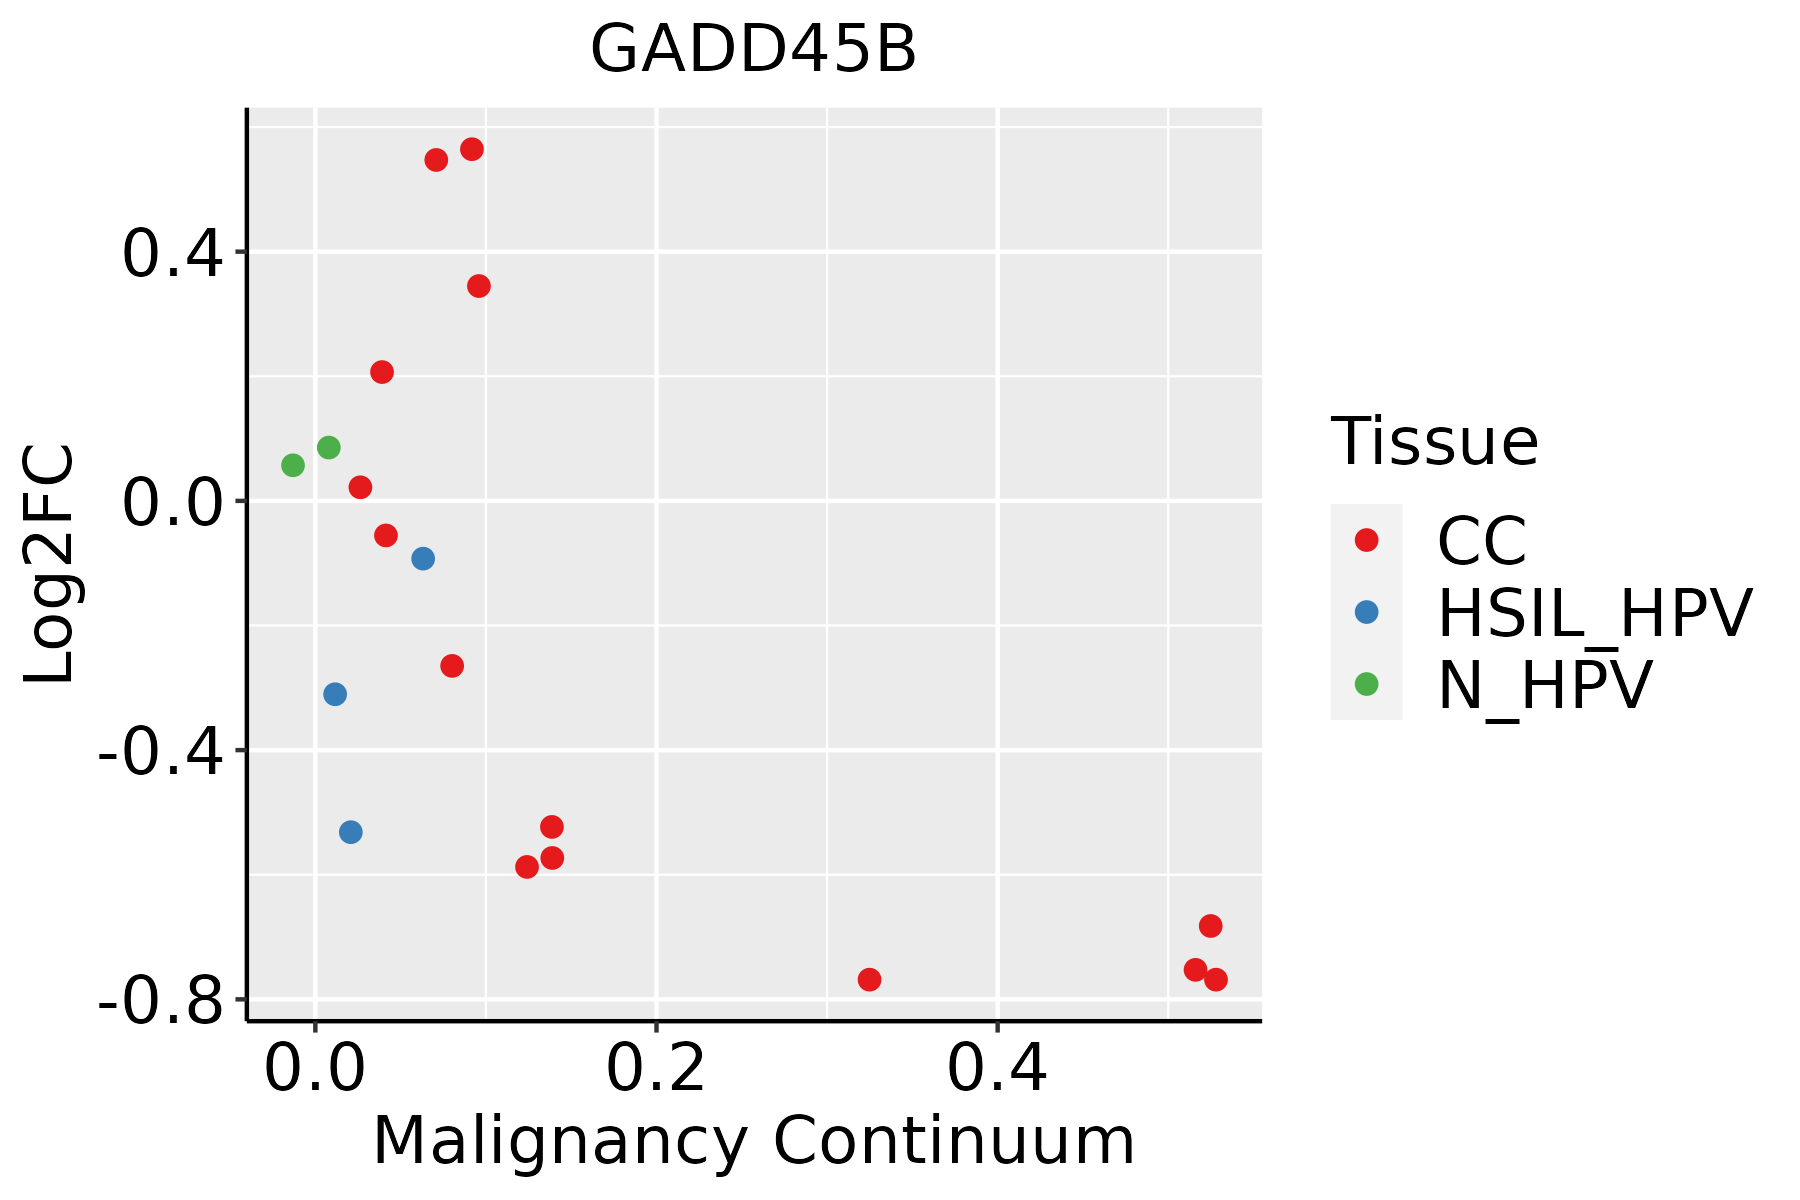 | CC: Cervix cancer |
| HSIL_HPV: HPV-infected high-grade squamous intraepithelial lesions | ||
| N_HPV: HPV-infected normal cervix | ||
| Endometrium | 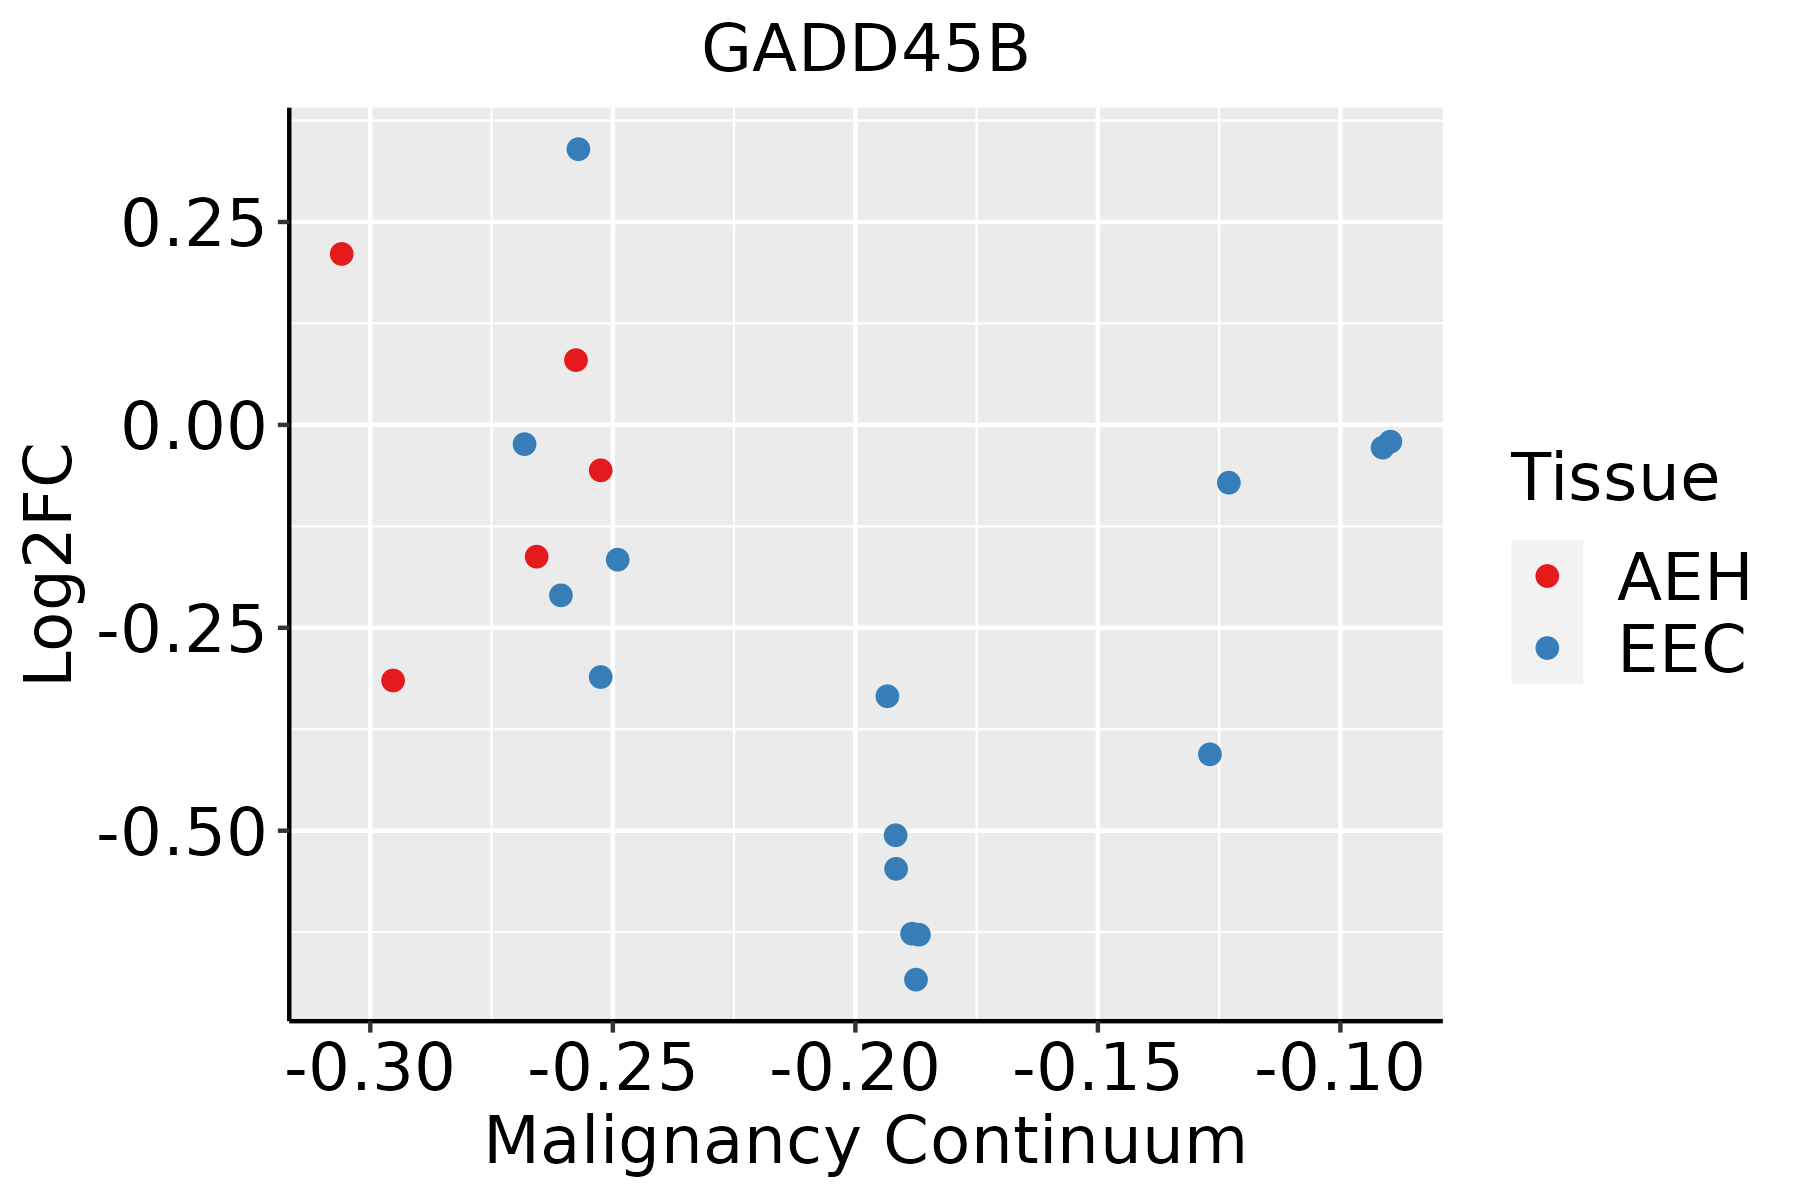 | AEH: Atypical endometrial hyperplasia |
| EEC: Endometrioid Cancer | ||
| Esophagus |  | ESCC: Esophageal squamous cell carcinoma |
| HGIN: High-grade intraepithelial neoplasias | ||
| LGIN: Low-grade intraepithelial neoplasias | ||
| Liver |  | HCC: Hepatocellular carcinoma |
| NAFLD: Non-alcoholic fatty liver disease | ||
| Lung |  | AAH: Atypical adenomatous hyperplasia |
| AIS: Adenocarcinoma in situ | ||
| IAC: Invasive lung adenocarcinoma | ||
| MIA: Minimally invasive adenocarcinoma | ||
| Oral Cavity | 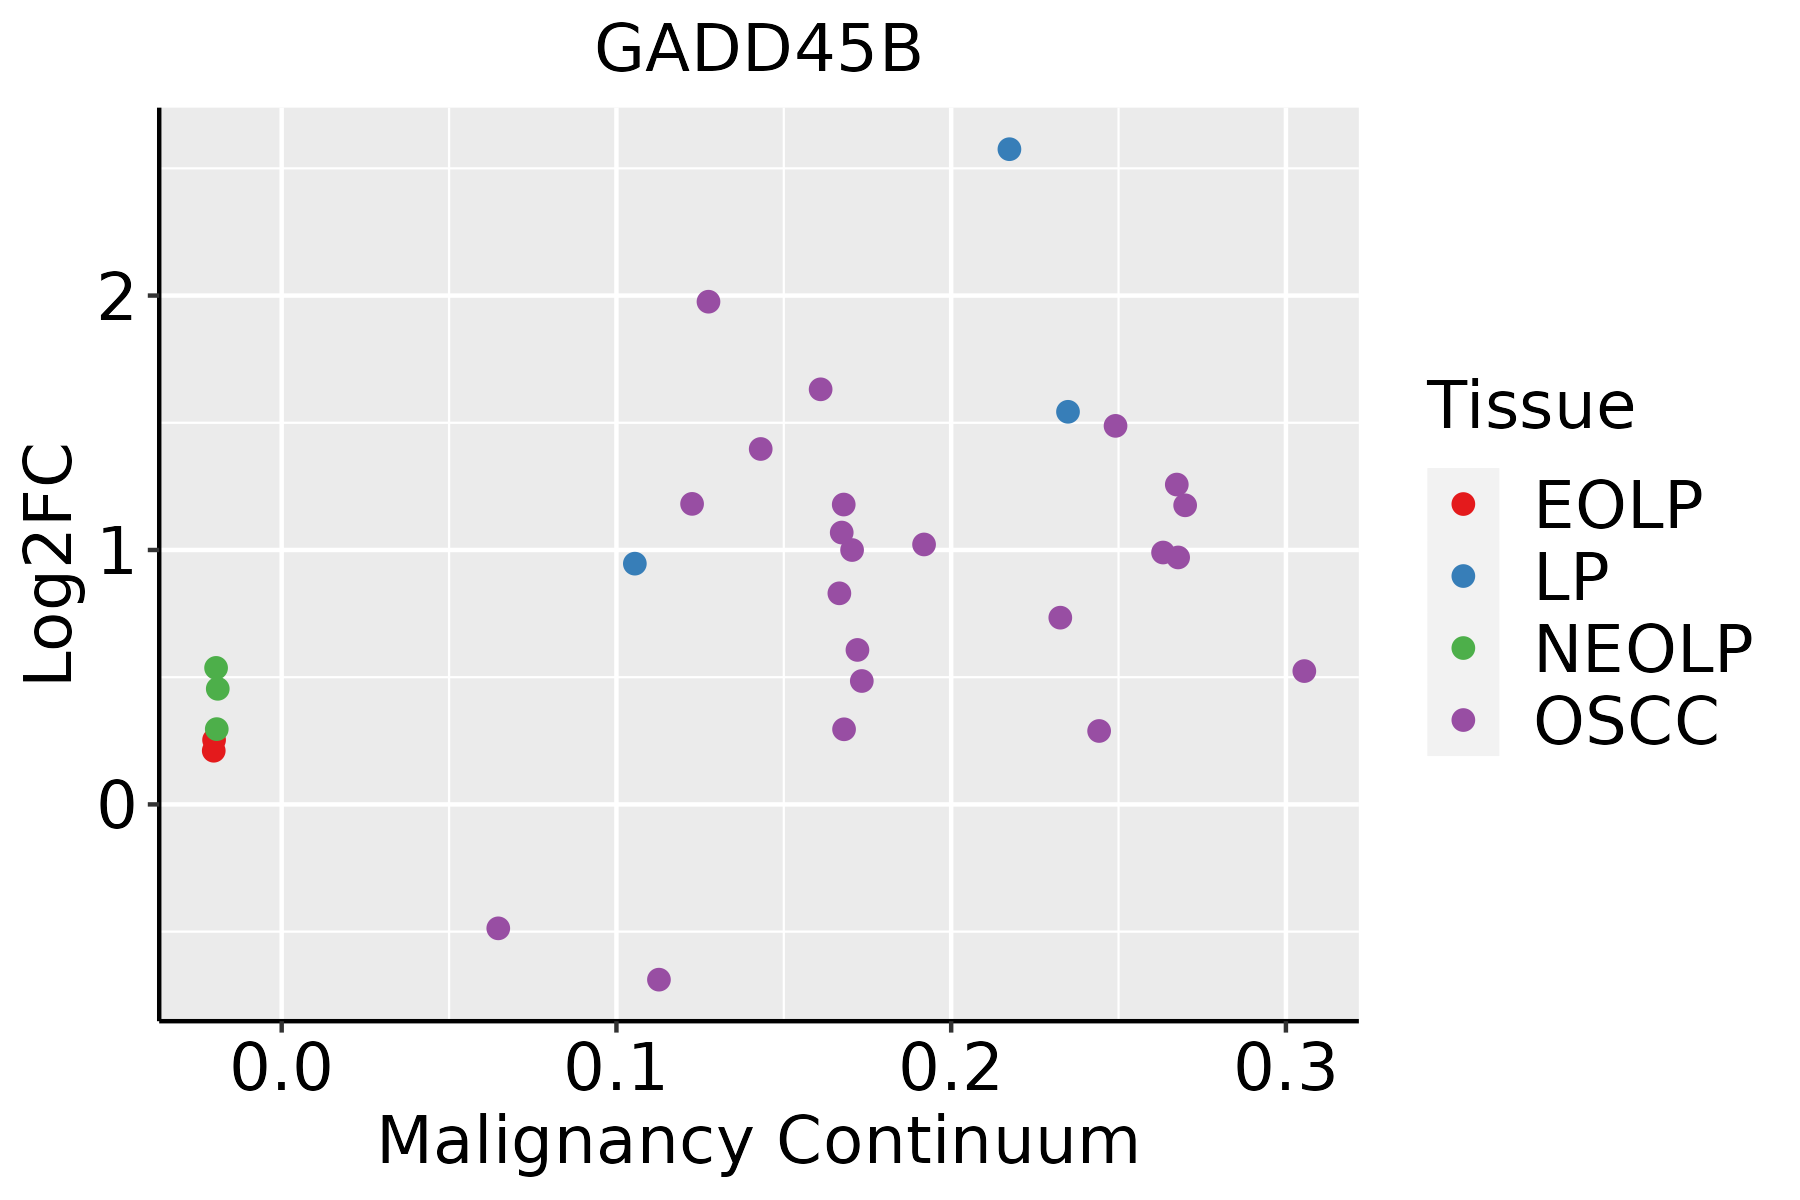 | EOLP: Erosive Oral lichen planus |
| LP: leukoplakia | ||
| NEOLP: Non-erosive oral lichen planus | ||
| OSCC: Oral squamous cell carcinoma | ||
| Prostate |  | BPH: Benign Prostatic Hyperplasia |
| Skin |  | AK: Actinic keratosis |
| cSCC: Cutaneous squamous cell carcinoma | ||
| SCCIS:squamous cell carcinoma in situ | ||
| Thyroid | 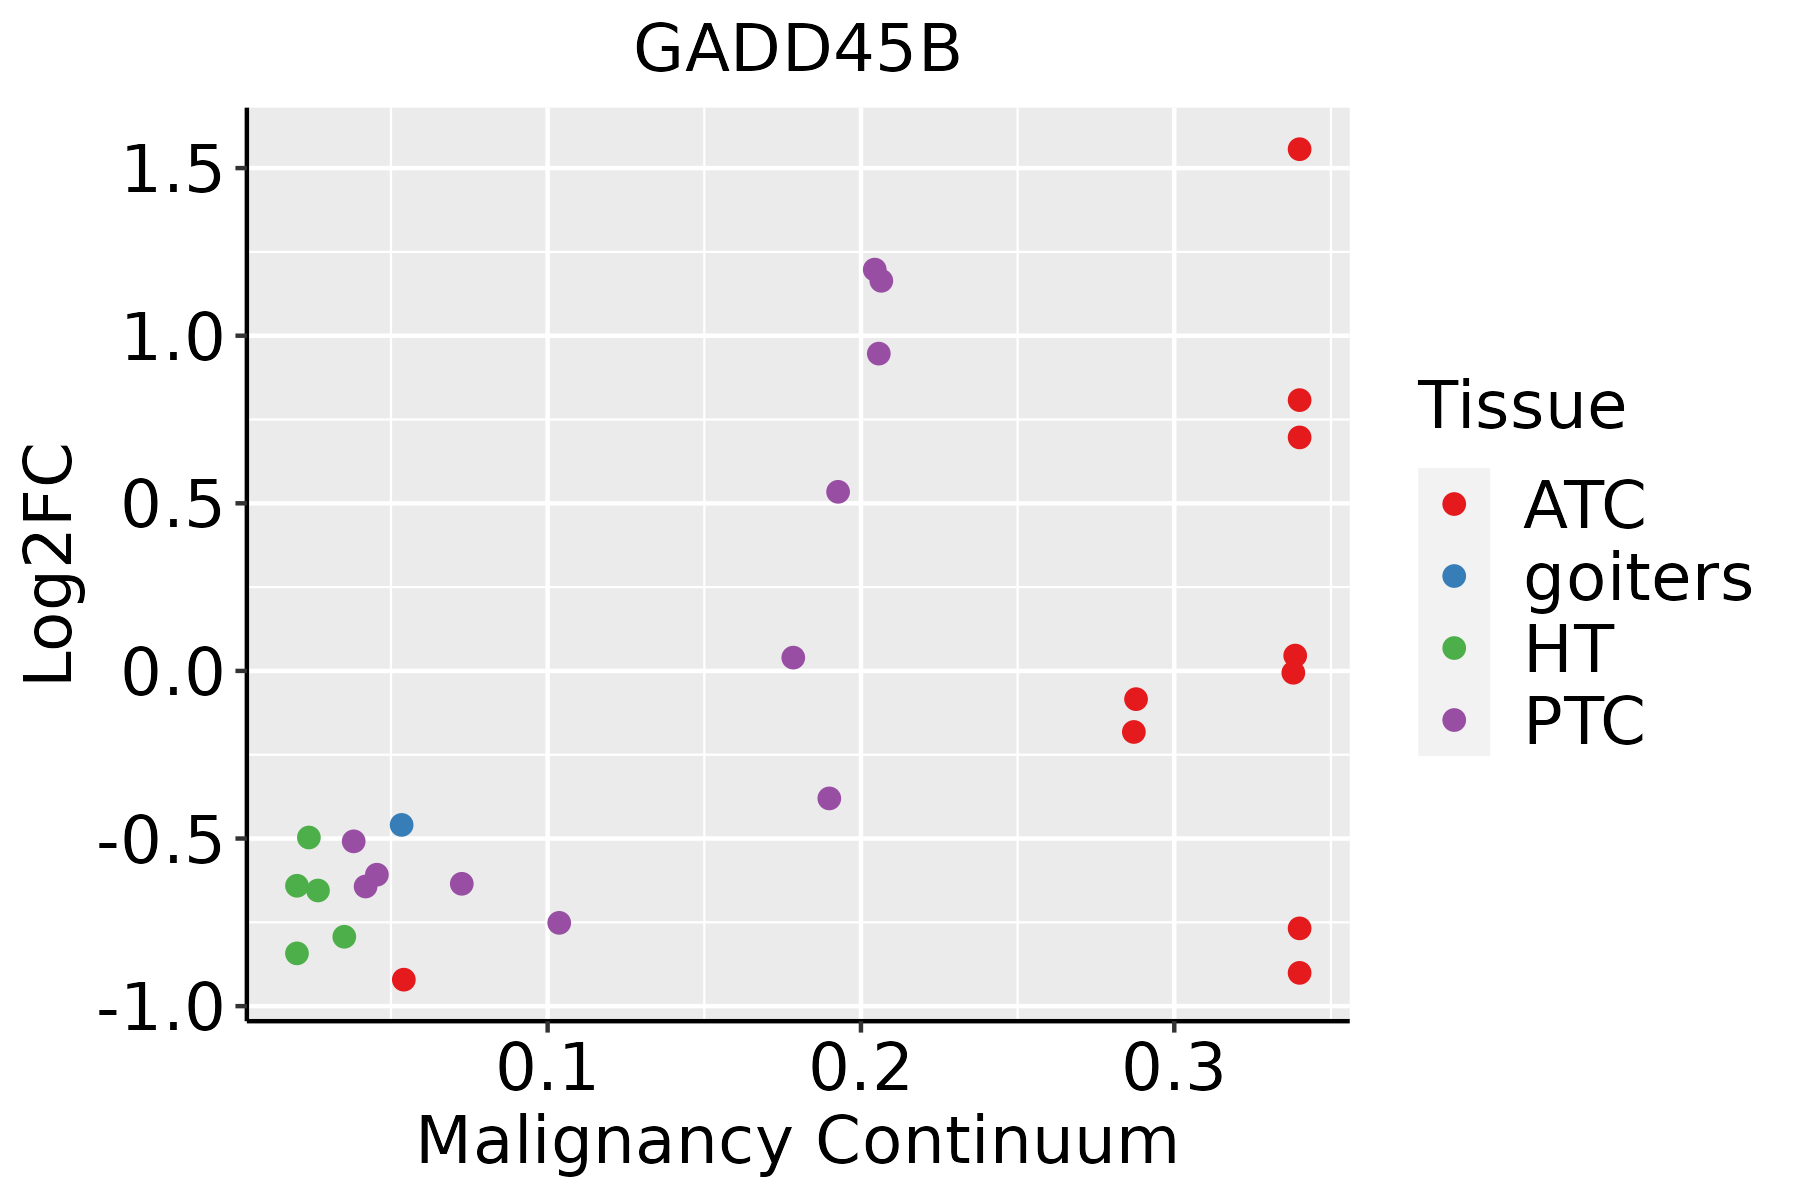 | ATC: Anaplastic thyroid cancer |
| HT: Hashimoto's thyroiditis | ||
| PTC: Papillary thyroid cancer |
| ∗log2FC in expression of this searched gene in stem-like cells from each diseased tissue sample relative to stem-like cells in normal samples in each tissue plotted against the malignancy continuum. Samples are colored based on if they are from different disease stage. |
Top |
Malignant transformation related pathway analysis |
| Find out the enriched GO biological processes and KEGG pathways involved in transition from healthy to precancer to cancer |
| Tissue | Disease Stage | Enriched GO biological Processes |
| Colorectum | AD |  |
| Colorectum | SER |  |
| Colorectum | MSS |  |
| Colorectum | MSI-H |  |
| Colorectum | FAP |  |
| ∗Top 15 enriched GO BP terms are showed in the bar plot of each disease state in each tissue. Each row represents a significant GO biological process which is colored according to the -log10(p.adjust). |
| Page: 1 2 3 4 5 6 7 8 9 |
| GO ID | Tissue | Disease Stage | Description | Gene Ratio | Bg Ratio | pvalue | p.adjust | Count |
| GO:004593628 | Skin | cSCC | negative regulation of phosphate metabolic process | 160/4864 | 441/18723 | 8.89e-07 | 1.63e-05 | 160 |
| GO:001056328 | Skin | cSCC | negative regulation of phosphorus metabolic process | 160/4864 | 442/18723 | 1.04e-06 | 1.85e-05 | 160 |
| GO:004232626 | Skin | cSCC | negative regulation of phosphorylation | 137/4864 | 385/18723 | 1.63e-05 | 1.99e-04 | 137 |
| GO:000193326 | Skin | cSCC | negative regulation of protein phosphorylation | 123/4864 | 342/18723 | 2.48e-05 | 2.82e-04 | 123 |
| GO:005134829 | Skin | cSCC | negative regulation of transferase activity | 100/4864 | 268/18723 | 2.60e-05 | 2.94e-04 | 100 |
| GO:003109825 | Skin | cSCC | stress-activated protein kinase signaling cascade | 92/4864 | 247/18723 | 5.78e-05 | 5.74e-04 | 92 |
| GO:005140325 | Skin | cSCC | stress-activated MAPK cascade | 88/4864 | 239/18723 | 1.32e-04 | 1.20e-03 | 88 |
| GO:007030225 | Skin | cSCC | regulation of stress-activated protein kinase signaling cascade | 74/4864 | 195/18723 | 1.50e-04 | 1.33e-03 | 74 |
| GO:003287225 | Skin | cSCC | regulation of stress-activated MAPK cascade | 72/4864 | 192/18723 | 2.76e-04 | 2.22e-03 | 72 |
| GO:0006469110 | Skin | cSCC | negative regulation of protein kinase activity | 74/4864 | 212/18723 | 2.36e-03 | 1.37e-02 | 74 |
| GO:000725423 | Skin | cSCC | JNK cascade | 60/4864 | 167/18723 | 2.77e-03 | 1.56e-02 | 60 |
| GO:0033673110 | Skin | cSCC | negative regulation of kinase activity | 81/4864 | 237/18723 | 2.95e-03 | 1.64e-02 | 81 |
| GO:004632823 | Skin | cSCC | regulation of JNK cascade | 49/4864 | 133/18723 | 3.64e-03 | 1.95e-02 | 49 |
| GO:005134830 | Thyroid | HT | negative regulation of transferase activity | 45/1272 | 268/18723 | 1.49e-08 | 1.20e-06 | 45 |
| GO:000646924 | Thyroid | HT | negative regulation of protein kinase activity | 33/1272 | 212/18723 | 6.62e-06 | 1.95e-04 | 33 |
| GO:003367324 | Thyroid | HT | negative regulation of kinase activity | 35/1272 | 237/18723 | 1.16e-05 | 3.05e-04 | 35 |
| GO:000193327 | Thyroid | HT | negative regulation of protein phosphorylation | 45/1272 | 342/18723 | 1.54e-05 | 3.80e-04 | 45 |
| GO:004232627 | Thyroid | HT | negative regulation of phosphorylation | 49/1272 | 385/18723 | 1.62e-05 | 3.95e-04 | 49 |
| GO:004593629 | Thyroid | HT | negative regulation of phosphate metabolic process | 54/1272 | 441/18723 | 1.86e-05 | 4.39e-04 | 54 |
| GO:001056329 | Thyroid | HT | negative regulation of phosphorus metabolic process | 54/1272 | 442/18723 | 1.99e-05 | 4.60e-04 | 54 |
| Page: 1 2 3 4 5 6 7 8 9 10 11 12 13 14 15 16 |
| Pathway ID | Tissue | Disease Stage | Description | Gene Ratio | Bg Ratio | pvalue | p.adjust | qvalue | Count |
| hsa0516918 | Breast | Precancer | Epstein-Barr virus infection | 35/684 | 202/8465 | 1.15e-05 | 1.26e-04 | 9.64e-05 | 35 |
| hsa042189 | Breast | Precancer | Cellular senescence | 29/684 | 156/8465 | 1.66e-05 | 1.69e-04 | 1.30e-04 | 29 |
| hsa042108 | Breast | Precancer | Apoptosis | 25/684 | 136/8465 | 7.61e-05 | 6.87e-04 | 5.26e-04 | 25 |
| hsa0516919 | Breast | Precancer | Epstein-Barr virus infection | 35/684 | 202/8465 | 1.15e-05 | 1.26e-04 | 9.64e-05 | 35 |
| hsa0421814 | Breast | Precancer | Cellular senescence | 29/684 | 156/8465 | 1.66e-05 | 1.69e-04 | 1.30e-04 | 29 |
| hsa0421013 | Breast | Precancer | Apoptosis | 25/684 | 136/8465 | 7.61e-05 | 6.87e-04 | 5.26e-04 | 25 |
| hsa0516922 | Breast | IDC | Epstein-Barr virus infection | 45/867 | 202/8465 | 3.16e-07 | 6.05e-06 | 4.52e-06 | 45 |
| hsa0421824 | Breast | IDC | Cellular senescence | 35/867 | 156/8465 | 5.49e-06 | 7.43e-05 | 5.56e-05 | 35 |
| hsa0421022 | Breast | IDC | Apoptosis | 31/867 | 136/8465 | 1.34e-05 | 1.61e-04 | 1.20e-04 | 31 |
| hsa041157 | Breast | IDC | p53 signaling pathway | 16/867 | 74/8465 | 2.86e-03 | 1.86e-02 | 1.39e-02 | 16 |
| hsa052147 | Breast | IDC | Glioma | 16/867 | 75/8465 | 3.30e-03 | 2.10e-02 | 1.57e-02 | 16 |
| hsa052109 | Breast | IDC | Colorectal cancer | 17/867 | 86/8465 | 5.70e-03 | 3.13e-02 | 2.34e-02 | 17 |
| hsa0522010 | Breast | IDC | Chronic myeloid leukemia | 15/867 | 76/8465 | 9.24e-03 | 4.37e-02 | 3.27e-02 | 15 |
| hsa052169 | Breast | IDC | Thyroid cancer | 9/867 | 37/8465 | 1.06e-02 | 4.92e-02 | 3.68e-02 | 9 |
| hsa0516932 | Breast | IDC | Epstein-Barr virus infection | 45/867 | 202/8465 | 3.16e-07 | 6.05e-06 | 4.52e-06 | 45 |
| hsa0421834 | Breast | IDC | Cellular senescence | 35/867 | 156/8465 | 5.49e-06 | 7.43e-05 | 5.56e-05 | 35 |
| hsa0421032 | Breast | IDC | Apoptosis | 31/867 | 136/8465 | 1.34e-05 | 1.61e-04 | 1.20e-04 | 31 |
| hsa0411512 | Breast | IDC | p53 signaling pathway | 16/867 | 74/8465 | 2.86e-03 | 1.86e-02 | 1.39e-02 | 16 |
| hsa0521413 | Breast | IDC | Glioma | 16/867 | 75/8465 | 3.30e-03 | 2.10e-02 | 1.57e-02 | 16 |
| hsa0521014 | Breast | IDC | Colorectal cancer | 17/867 | 86/8465 | 5.70e-03 | 3.13e-02 | 2.34e-02 | 17 |
| Page: 1 2 3 4 5 6 7 8 9 10 11 12 13 14 15 16 17 18 19 |
Top |
Cell-cell communication analysis |
| Identification of potential cell-cell interactions between two cell types and their ligand-receptor pairs for different disease states |
| Ligand | Receptor | LRpair | Pathway | Tissue | Disease Stage |
| Page: 1 |
Top |
Single-cell gene regulatory network inference analysis |
| Find out the significant the regulons (TFs) and the target genes of each regulon across cell types for different disease states |
| TF | Cell Type | Tissue | Disease Stage | Target Gene | RSS | Regulon Activity |
| ∗The dot plots of a searched regulon are shown for all cell subpopulations in each disease state of each tissue based on the regulon specific score inferred using pySCENIC and by calculating the average expression. |
| Page: 1 |
Top |
Somatic mutation of malignant transformation related genes |
| Annotation of somatic variants for genes involved in malignant transformation |
| Hugo Symbol | Variant Class | Variant Classification | dbSNP RS | HGVSc | HGVSp | HGVSp Short | SWISSPROT | BIOTYPE | SIFT | PolyPhen | Tumor Sample Barcode | Tissue | Histology | Sex | Age | Stage | Therapy Types | Drugs | Outcome |
| GADD45B | SNV | Missense_Mutation | c.103N>T | p.Arg35Cys | p.R35C | O75293 | protein_coding | tolerated(0.66) | benign(0.003) | TCGA-DS-A0VK-01 | Cervix | cervical & endocervical cancer | Female | <65 | I/II | Chemotherapy | carboplatin | PD | |
| GADD45B | SNV | Missense_Mutation | c.187N>A | p.Glu63Lys | p.E63K | O75293 | protein_coding | tolerated(0.07) | benign(0.102) | TCGA-93-A4JP-01 | Lung | lung adenocarcinoma | Male | <65 | III/IV | Chemotherapy | carboplatin | PD | |
| GADD45B | SNV | Missense_Mutation | c.376N>T | p.His126Tyr | p.H126Y | O75293 | protein_coding | tolerated(0.53) | benign(0.057) | TCGA-34-5929-01 | Lung | lung squamous cell carcinoma | Female | >=65 | I/II | Unknown | Unknown | SD | |
| GADD45B | SNV | Missense_Mutation | c.189N>C | p.Glu63Asp | p.E63D | O75293 | protein_coding | tolerated(0.1) | benign(0.015) | TCGA-D7-A4YY-01 | Stomach | stomach adenocarcinoma | Male | <65 | III/IV | Chemotherapy | 5-fluorouracil | SD |
| Page: 1 |
Top |
Related drugs of malignant transformation related genes |
| Identification of chemicals and drugs interact with genes involved in malignant transfromation |
| (DGIdb 4.0) |
| Entrez ID | Symbol | Category | Interaction Types | Drug Claim Name | Drug Name | PMIDs |
| Page: 1 |

Copyright 2023-Present -The University of Texas Health Science Center at Houston |