
|
|||||
|
 | |
| |
| |
| |
| |
| |
|
Gene: FGF1 |
Gene summary for FGF1 |
| Gene information | Species | Human | Gene symbol | FGF1 | Gene ID | 2246 |
| Gene name | fibroblast growth factor 1 | |
| Gene Alias | AFGF | |
| Cytomap | 5q31.3 | |
| Gene Type | protein-coding | GO ID | GO:0000165 | UniProtAcc | P05230 |
Top |
Malignant transformation analysis |
| Identification of the aberrant gene expression in precancerous and cancerous lesions by comparing the gene expression of stem-like cells in diseased tissues with normal stem cells |
| Entrez ID | Symbol | Replicates | Species | Organ | Tissue | Adj P-value | Log2FC | Malignancy |
| 2246 | FGF1 | C30 | Human | Oral cavity | OSCC | 4.88e-15 | 8.37e-01 | 0.3055 |
| 2246 | FGF1 | C38 | Human | Oral cavity | OSCC | 1.95e-05 | 5.08e-01 | 0.172 |
| 2246 | FGF1 | C43 | Human | Oral cavity | OSCC | 1.19e-10 | 1.90e-01 | 0.1704 |
| 2246 | FGF1 | ATC2 | Human | Thyroid | ATC | 9.20e-14 | 1.53e+00 | 0.34 |
| Page: 1 |
| Tissue | Expression Dynamics | Abbreviation |
| Oral Cavity | 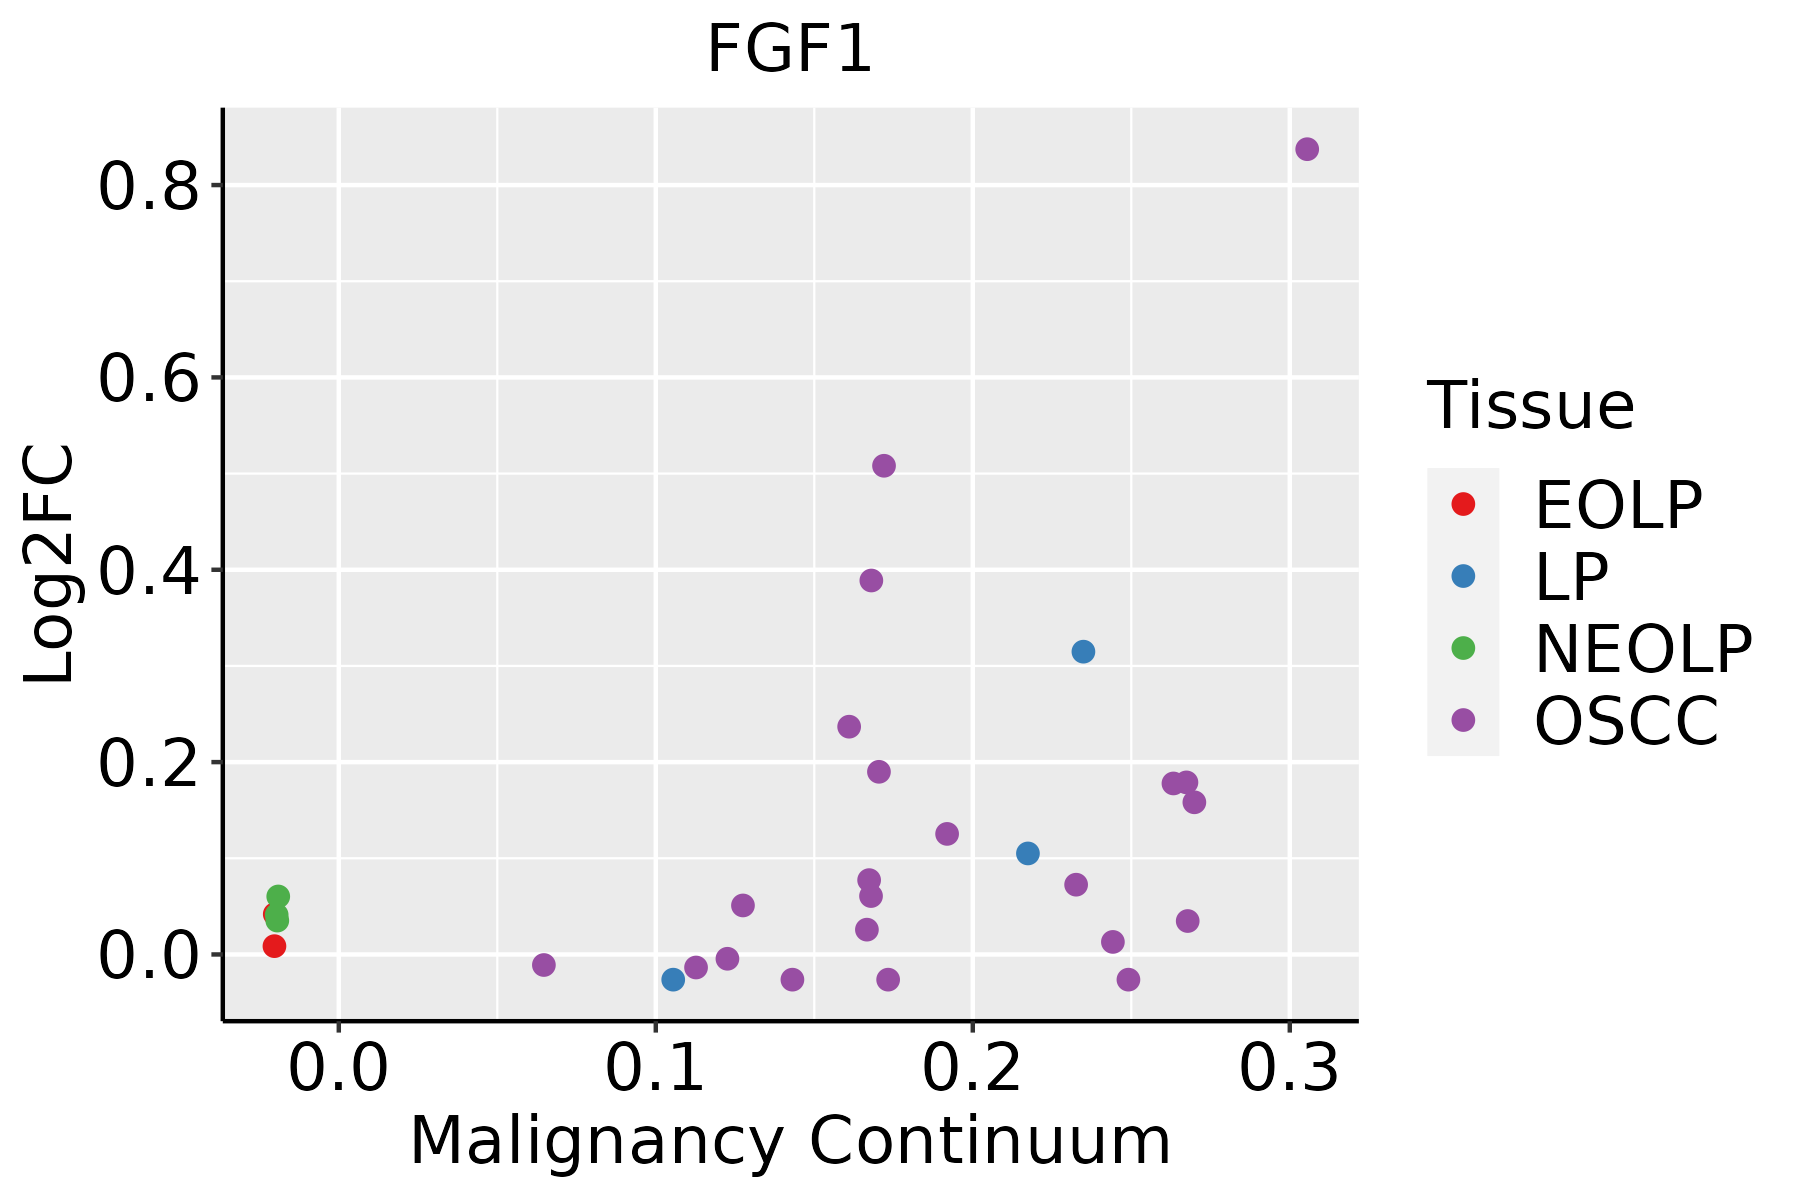 | EOLP: Erosive Oral lichen planus |
| LP: leukoplakia | ||
| NEOLP: Non-erosive oral lichen planus | ||
| OSCC: Oral squamous cell carcinoma | ||
| Thyroid | 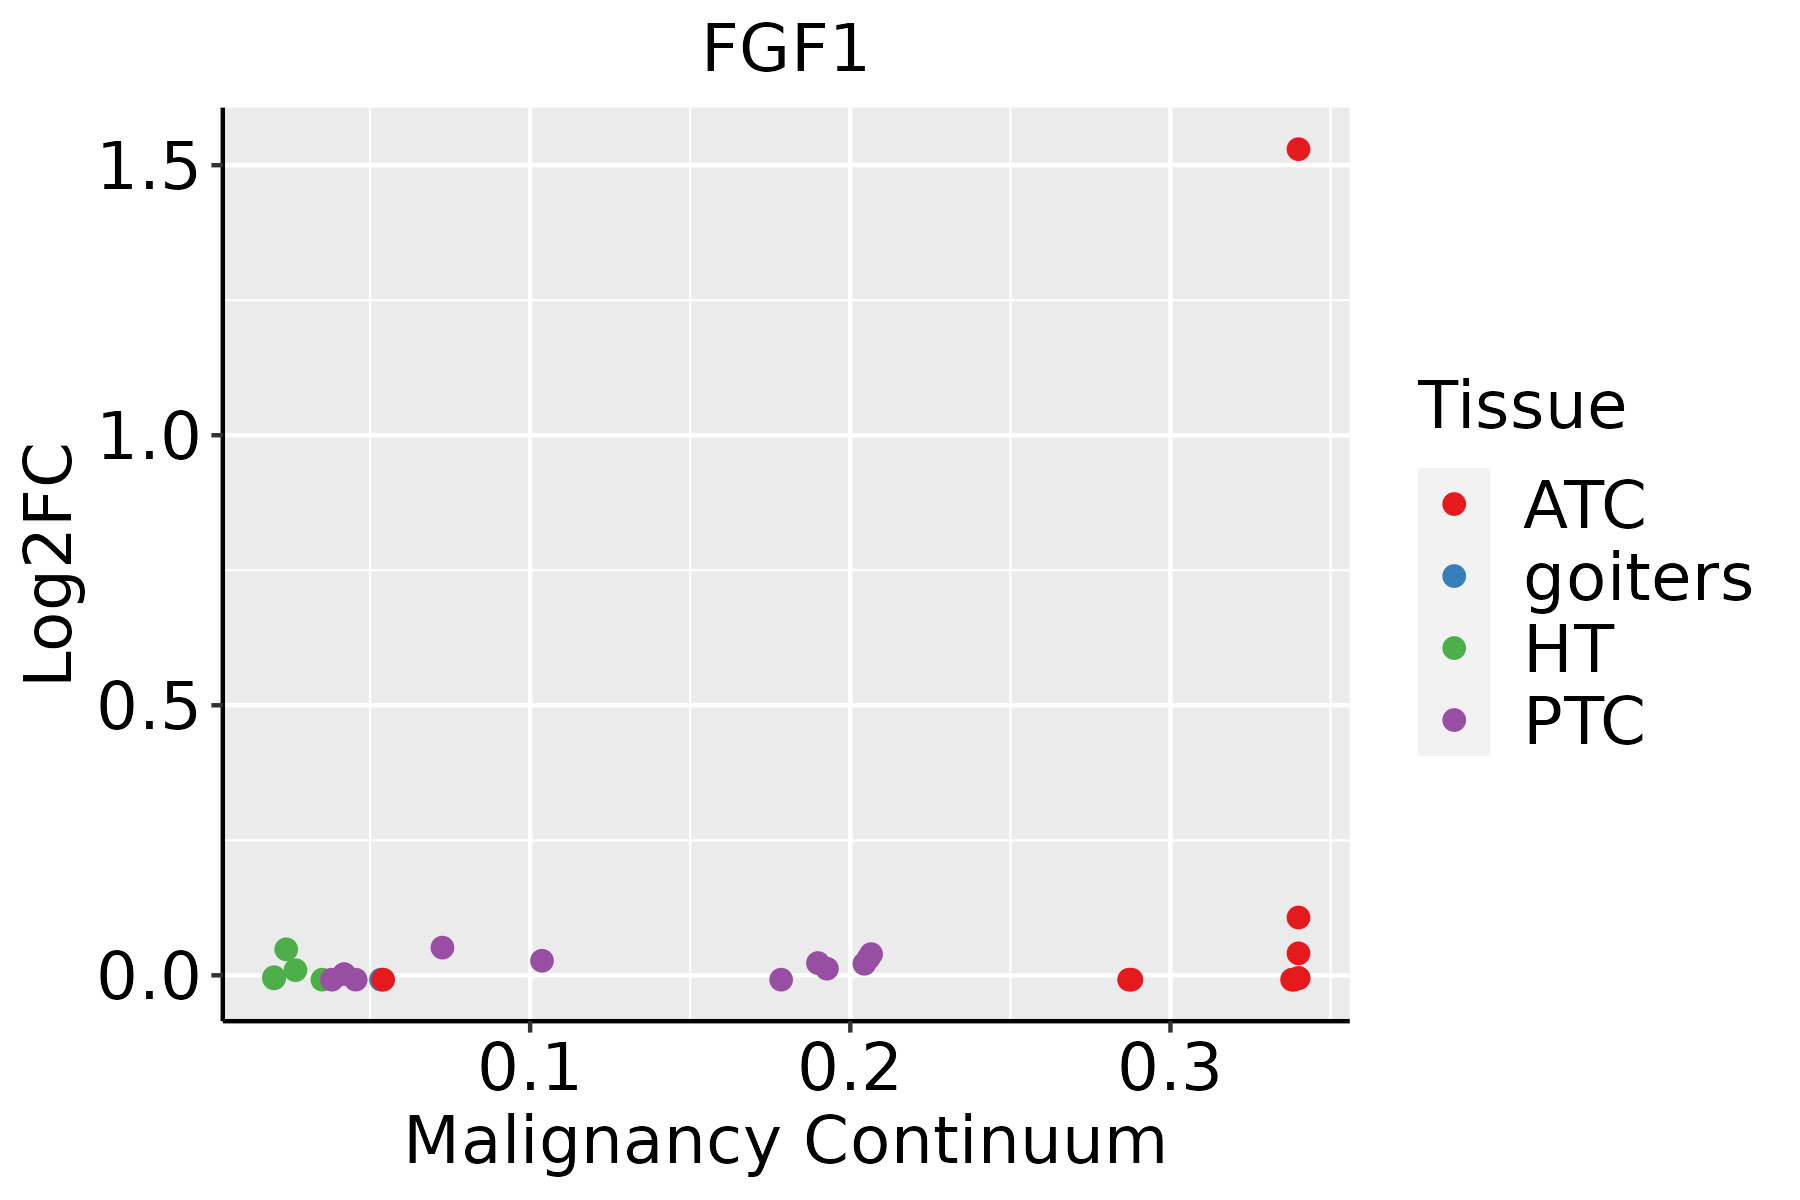 | ATC: Anaplastic thyroid cancer |
| HT: Hashimoto's thyroiditis | ||
| PTC: Papillary thyroid cancer |
| ∗log2FC in expression of this searched gene in stem-like cells from each diseased tissue sample relative to stem-like cells in normal samples in each tissue plotted against the malignancy continuum. Samples are colored based on if they are from different disease stage. |
Top |
Malignant transformation related pathway analysis |
| Find out the enriched GO biological processes and KEGG pathways involved in transition from healthy to precancer to cancer |
| Tissue | Disease Stage | Enriched GO biological Processes |
| Colorectum | AD |  |
| Colorectum | SER |  |
| Colorectum | MSS |  |
| Colorectum | MSI-H |  |
| Colorectum | FAP |  |
| ∗Top 15 enriched GO BP terms are showed in the bar plot of each disease state in each tissue. Each row represents a significant GO biological process which is colored according to the -log10(p.adjust). |
| Page: 1 2 3 4 5 6 7 8 9 |
| GO ID | Tissue | Disease Stage | Description | Gene Ratio | Bg Ratio | pvalue | p.adjust | Count |
| GO:00703724 | Oral cavity | OSCC | regulation of ERK1 and ERK2 cascade | 140/7305 | 309/18723 | 1.34e-02 | 4.46e-02 | 140 |
| GO:190290318 | Prostate | BPH | regulation of supramolecular fiber organization | 133/3107 | 383/18723 | 2.40e-18 | 8.73e-16 | 133 |
| GO:003297018 | Prostate | BPH | regulation of actin filament-based process | 133/3107 | 397/18723 | 7.07e-17 | 1.62e-14 | 133 |
| GO:001604910 | Prostate | BPH | cell growth | 139/3107 | 482/18723 | 7.53e-12 | 5.90e-10 | 139 |
| GO:005125818 | Prostate | BPH | protein polymerization | 96/3107 | 297/18723 | 1.52e-11 | 1.10e-09 | 96 |
| GO:000716316 | Prostate | BPH | establishment or maintenance of cell polarity | 75/3107 | 218/18723 | 9.93e-11 | 5.97e-09 | 75 |
| GO:007265916 | Prostate | BPH | protein localization to plasma membrane | 89/3107 | 284/18723 | 5.00e-10 | 2.56e-08 | 89 |
| GO:000155810 | Prostate | BPH | regulation of cell growth | 116/3107 | 414/18723 | 2.66e-09 | 1.05e-07 | 116 |
| GO:002241117 | Prostate | BPH | cellular component disassembly | 121/3107 | 443/18723 | 6.34e-09 | 2.25e-07 | 121 |
| GO:003253517 | Prostate | BPH | regulation of cellular component size | 108/3107 | 383/18723 | 6.41e-09 | 2.27e-07 | 108 |
| GO:003432910 | Prostate | BPH | cell junction assembly | 114/3107 | 420/18723 | 2.52e-08 | 7.49e-07 | 114 |
| GO:199077810 | Prostate | BPH | protein localization to cell periphery | 95/3107 | 333/18723 | 2.78e-08 | 8.13e-07 | 95 |
| GO:00109759 | Prostate | BPH | regulation of neuron projection development | 118/3107 | 445/18723 | 5.85e-08 | 1.57e-06 | 118 |
| GO:003367416 | Prostate | BPH | positive regulation of kinase activity | 122/3107 | 467/18723 | 8.59e-08 | 2.14e-06 | 122 |
| GO:004586010 | Prostate | BPH | positive regulation of protein kinase activity | 104/3107 | 386/18723 | 1.52e-07 | 3.51e-06 | 104 |
| GO:190290410 | Prostate | BPH | negative regulation of supramolecular fiber organization | 55/3107 | 167/18723 | 1.60e-07 | 3.63e-06 | 55 |
| GO:003001010 | Prostate | BPH | establishment of cell polarity | 48/3107 | 143/18723 | 5.10e-07 | 1.03e-05 | 48 |
| GO:00705076 | Prostate | BPH | regulation of microtubule cytoskeleton organization | 48/3107 | 148/18723 | 1.57e-06 | 2.67e-05 | 48 |
| GO:00329849 | Prostate | BPH | protein-containing complex disassembly | 65/3107 | 224/18723 | 2.19e-06 | 3.60e-05 | 65 |
| GO:00459265 | Prostate | BPH | negative regulation of growth | 68/3107 | 249/18723 | 1.26e-05 | 1.69e-04 | 68 |
| Page: 1 2 3 4 5 6 7 8 9 10 11 12 13 14 15 16 17 18 19 20 21 |
| Pathway ID | Tissue | Disease Stage | Description | Gene Ratio | Bg Ratio | pvalue | p.adjust | qvalue | Count |
| hsa0401014 | Oral cavity | OSCC | MAPK signaling pathway | 165/3704 | 302/8465 | 7.11e-05 | 2.74e-04 | 1.40e-04 | 165 |
| hsa0481026 | Oral cavity | OSCC | Regulation of actin cytoskeleton | 129/3704 | 229/8465 | 7.14e-05 | 2.74e-04 | 1.40e-04 | 129 |
| hsa041516 | Oral cavity | OSCC | PI3K-Akt signaling pathway | 185/3704 | 354/8465 | 6.26e-04 | 1.86e-03 | 9.49e-04 | 185 |
| hsa0439016 | Oral cavity | OSCC | Hippo signaling pathway | 86/3704 | 157/8465 | 3.30e-03 | 8.24e-03 | 4.20e-03 | 86 |
| hsa0401518 | Oral cavity | OSCC | Rap1 signaling pathway | 107/3704 | 210/8465 | 2.01e-02 | 4.34e-02 | 2.21e-02 | 107 |
| hsa0401015 | Oral cavity | OSCC | MAPK signaling pathway | 165/3704 | 302/8465 | 7.11e-05 | 2.74e-04 | 1.40e-04 | 165 |
| hsa04810111 | Oral cavity | OSCC | Regulation of actin cytoskeleton | 129/3704 | 229/8465 | 7.14e-05 | 2.74e-04 | 1.40e-04 | 129 |
| hsa0415113 | Oral cavity | OSCC | PI3K-Akt signaling pathway | 185/3704 | 354/8465 | 6.26e-04 | 1.86e-03 | 9.49e-04 | 185 |
| hsa0439017 | Oral cavity | OSCC | Hippo signaling pathway | 86/3704 | 157/8465 | 3.30e-03 | 8.24e-03 | 4.20e-03 | 86 |
| hsa0401519 | Oral cavity | OSCC | Rap1 signaling pathway | 107/3704 | 210/8465 | 2.01e-02 | 4.34e-02 | 2.21e-02 | 107 |
| Page: 1 |
Top |
Cell-cell communication analysis |
| Identification of potential cell-cell interactions between two cell types and their ligand-receptor pairs for different disease states |
| Ligand | Receptor | LRpair | Pathway | Tissue | Disease Stage |
| FGF1 | FGFR1 | FGF1_FGFR1 | FGF | Cervix | CC |
| FGF1 | FGFR2 | FGF1_FGFR2 | FGF | Cervix | CC |
| FGF1 | FGFR3 | FGF1_FGFR3 | FGF | Cervix | CC |
| FGF1 | FGFR1 | FGF1_FGFR1 | FGF | Esophagus | ESCC |
| FGF1 | FGFR3 | FGF1_FGFR3 | FGF | Esophagus | ESCC |
| FGF1 | FGFR4 | FGF1_FGFR4 | FGF | Esophagus | ESCC |
| FGF1 | FGFR1 | FGF1_FGFR1 | FGF | HNSCC | OSCC |
| FGF1 | FGFR2 | FGF1_FGFR2 | FGF | HNSCC | OSCC |
| FGF1 | FGFR3 | FGF1_FGFR3 | FGF | HNSCC | OSCC |
| Page: 1 |
Top |
Single-cell gene regulatory network inference analysis |
| Find out the significant the regulons (TFs) and the target genes of each regulon across cell types for different disease states |
| TF | Cell Type | Tissue | Disease Stage | Target Gene | RSS | Regulon Activity |
| ∗The dot plots of a searched regulon are shown for all cell subpopulations in each disease state of each tissue based on the regulon specific score inferred using pySCENIC and by calculating the average expression. |
| Page: 1 |
Top |
Somatic mutation of malignant transformation related genes |
| Annotation of somatic variants for genes involved in malignant transformation |
| Hugo Symbol | Variant Class | Variant Classification | dbSNP RS | HGVSc | HGVSp | HGVSp Short | SWISSPROT | BIOTYPE | SIFT | PolyPhen | Tumor Sample Barcode | Tissue | Histology | Sex | Age | Stage | Therapy Types | Drugs | Outcome |
| FGF1 | SNV | Missense_Mutation | novel | c.4N>T | p.Ala2Ser | p.A2S | P05230 | protein_coding | tolerated(0.25) | benign(0.026) | TCGA-C8-A26X-01 | Breast | breast invasive carcinoma | Female | <65 | I/II | Chemotherapy | 5-fluorouracil | CR |
| FGF1 | SNV | Missense_Mutation | novel | c.4N>T | p.Ala2Ser | p.A2S | P05230 | protein_coding | tolerated(0.25) | benign(0.026) | TCGA-E9-A247-01 | Breast | breast invasive carcinoma | Female | <65 | I/II | Hormone Therapy | tamoxiphen | SD |
| FGF1 | insertion | Frame_Shift_Ins | novel | c.53_54insTCCTGGCA | p.Pro20GlyfsTer22 | p.P20Gfs*22 | P05230 | protein_coding | TCGA-B6-A0RE-01 | Breast | breast invasive carcinoma | Female | <65 | I/II | Unknown | Unknown | SD | ||
| FGF1 | SNV | Missense_Mutation | rs758967005 | c.106N>T | p.His36Tyr | p.H36Y | P05230 | protein_coding | tolerated(1) | benign(0.005) | TCGA-C5-A3HL-01 | Cervix | cervical & endocervical cancer | Female | >=65 | I/II | Unknown | Unknown | SD |
| FGF1 | SNV | Missense_Mutation | novel | c.288G>T | p.Glu96Asp | p.E96D | P05230 | protein_coding | tolerated(1) | benign(0) | TCGA-AA-3850-01 | Colorectum | colon adenocarcinoma | Male | >=65 | I/II | Unknown | Unknown | PD |
| FGF1 | SNV | Missense_Mutation | c.298N>C | p.Phe100Leu | p.F100L | P05230 | protein_coding | deleterious(0) | possibly_damaging(0.535) | TCGA-AA-A00N-01 | Colorectum | colon adenocarcinoma | Male | >=65 | I/II | Unknown | Unknown | PD | |
| FGF1 | SNV | Missense_Mutation | c.104N>A | p.Gly35Asp | p.G35D | P05230 | protein_coding | deleterious(0) | probably_damaging(0.999) | TCGA-AA-A010-01 | Colorectum | colon adenocarcinoma | Female | <65 | I/II | Chemotherapy | folinic | CR | |
| FGF1 | SNV | Missense_Mutation | c.329N>C | p.Asn110Thr | p.N110T | P05230 | protein_coding | deleterious(0.03) | possibly_damaging(0.879) | TCGA-AZ-4315-01 | Colorectum | colon adenocarcinoma | Male | <65 | I/II | Unknown | Unknown | SD | |
| FGF1 | SNV | Missense_Mutation | rs773671222 | c.204N>T | p.Glu68Asp | p.E68D | P05230 | protein_coding | deleterious(0.01) | benign(0.09) | TCGA-AP-A054-01 | Endometrium | uterine corpus endometrioid carcinoma | Female | <65 | III/IV | Chemotherapy | carboplatin | PD |
| FGF1 | SNV | Missense_Mutation | novel | c.61N>T | p.Gly21Trp | p.G21W | P05230 | protein_coding | deleterious(0.01) | probably_damaging(0.988) | TCGA-AP-A1DK-01 | Endometrium | uterine corpus endometrioid carcinoma | Female | <65 | I/II | Unknown | Unknown | SD |
| Page: 1 2 3 |
Top |
Related drugs of malignant transformation related genes |
| Identification of chemicals and drugs interact with genes involved in malignant transfromation |
| (DGIdb 4.0) |
| Entrez ID | Symbol | Category | Interaction Types | Drug Claim Name | Drug Name | PMIDs |
| 2246 | FGF1 | CLINICALLY ACTIONABLE, GROWTH FACTOR, DRUGGABLE GENOME | PENTOSAN POLYSULFATE | |||
| 2246 | FGF1 | CLINICALLY ACTIONABLE, GROWTH FACTOR, DRUGGABLE GENOME | PENTOSAN POLYSULFATE | |||
| 2246 | FGF1 | CLINICALLY ACTIONABLE, GROWTH FACTOR, DRUGGABLE GENOME | CVBT-141H | |||
| 2246 | FGF1 | CLINICALLY ACTIONABLE, GROWTH FACTOR, DRUGGABLE GENOME | inhibitor | CHEMBL1615835 | MUPARFOSTAT |
| Page: 1 |

Copyright 2023-Present -The University of Texas Health Science Center at Houston |