
|
|||||
|
 | |
| |
| |
| |
| |
| |
|
Gene: ERBB2 |
Gene summary for ERBB2 |
| Gene information | Species | Human | Gene symbol | ERBB2 | Gene ID | 2064 |
| Gene name | erb-b2 receptor tyrosine kinase 2 | |
| Gene Alias | CD340 | |
| Cytomap | 17q12 | |
| Gene Type | protein-coding | GO ID | GO:0000165 | UniProtAcc | P04626 |
Top |
Malignant transformation analysis |
| Identification of the aberrant gene expression in precancerous and cancerous lesions by comparing the gene expression of stem-like cells in diseased tissues with normal stem cells |
| Entrez ID | Symbol | Replicates | Species | Organ | Tissue | Adj P-value | Log2FC | Malignancy |
| 2064 | ERBB2 | GSM4909286 | Human | Breast | IDC | 2.51e-03 | 1.71e-01 | 0.1081 |
| 2064 | ERBB2 | GSM4909289 | Human | Breast | IDC | 2.33e-05 | 6.76e-01 | 0.1064 |
| 2064 | ERBB2 | GSM4909290 | Human | Breast | IDC | 4.42e-118 | 1.77e+00 | 0.2096 |
| 2064 | ERBB2 | GSM4909291 | Human | Breast | IDC | 5.16e-85 | 1.56e+00 | 0.1753 |
| 2064 | ERBB2 | GSM4909292 | Human | Breast | IDC | 3.67e-13 | 1.06e+00 | 0.1236 |
| 2064 | ERBB2 | GSM4909293 | Human | Breast | IDC | 3.33e-84 | 1.31e+00 | 0.1581 |
| 2064 | ERBB2 | GSM4909294 | Human | Breast | IDC | 1.31e-37 | 9.35e-01 | 0.2022 |
| 2064 | ERBB2 | GSM4909295 | Human | Breast | IDC | 1.09e-02 | 4.07e-01 | 0.0898 |
| 2064 | ERBB2 | GSM4909296 | Human | Breast | IDC | 8.11e-05 | -1.15e-01 | 0.1524 |
| 2064 | ERBB2 | GSM4909298 | Human | Breast | IDC | 1.57e-02 | 1.94e-01 | 0.1551 |
| 2064 | ERBB2 | GSM4909311 | Human | Breast | IDC | 1.34e-06 | -2.81e-02 | 0.1534 |
| 2064 | ERBB2 | GSM4909317 | Human | Breast | IDC | 1.06e-06 | 3.51e-01 | 0.1355 |
| 2064 | ERBB2 | GSM4909319 | Human | Breast | IDC | 2.51e-13 | -1.27e-01 | 0.1563 |
| 2064 | ERBB2 | GSM4909321 | Human | Breast | IDC | 5.30e-03 | -7.33e-02 | 0.1559 |
| 2064 | ERBB2 | brca2 | Human | Breast | Precancer | 5.63e-08 | 2.57e-01 | -0.024 |
| 2064 | ERBB2 | brca3 | Human | Breast | Precancer | 1.85e-03 | 1.80e-01 | -0.0263 |
| 2064 | ERBB2 | M2 | Human | Breast | IDC | 7.92e-23 | 1.14e+00 | 0.21 |
| 2064 | ERBB2 | NCCBC14 | Human | Breast | DCIS | 7.63e-56 | 1.33e+00 | 0.2021 |
| 2064 | ERBB2 | NCCBC5 | Human | Breast | DCIS | 3.53e-34 | 1.02e+00 | 0.2046 |
| 2064 | ERBB2 | P1 | Human | Breast | IDC | 1.77e-03 | -9.05e-02 | 0.1527 |
| Page: 1 2 3 4 5 6 7 8 |
| Tissue | Expression Dynamics | Abbreviation |
| Breast | 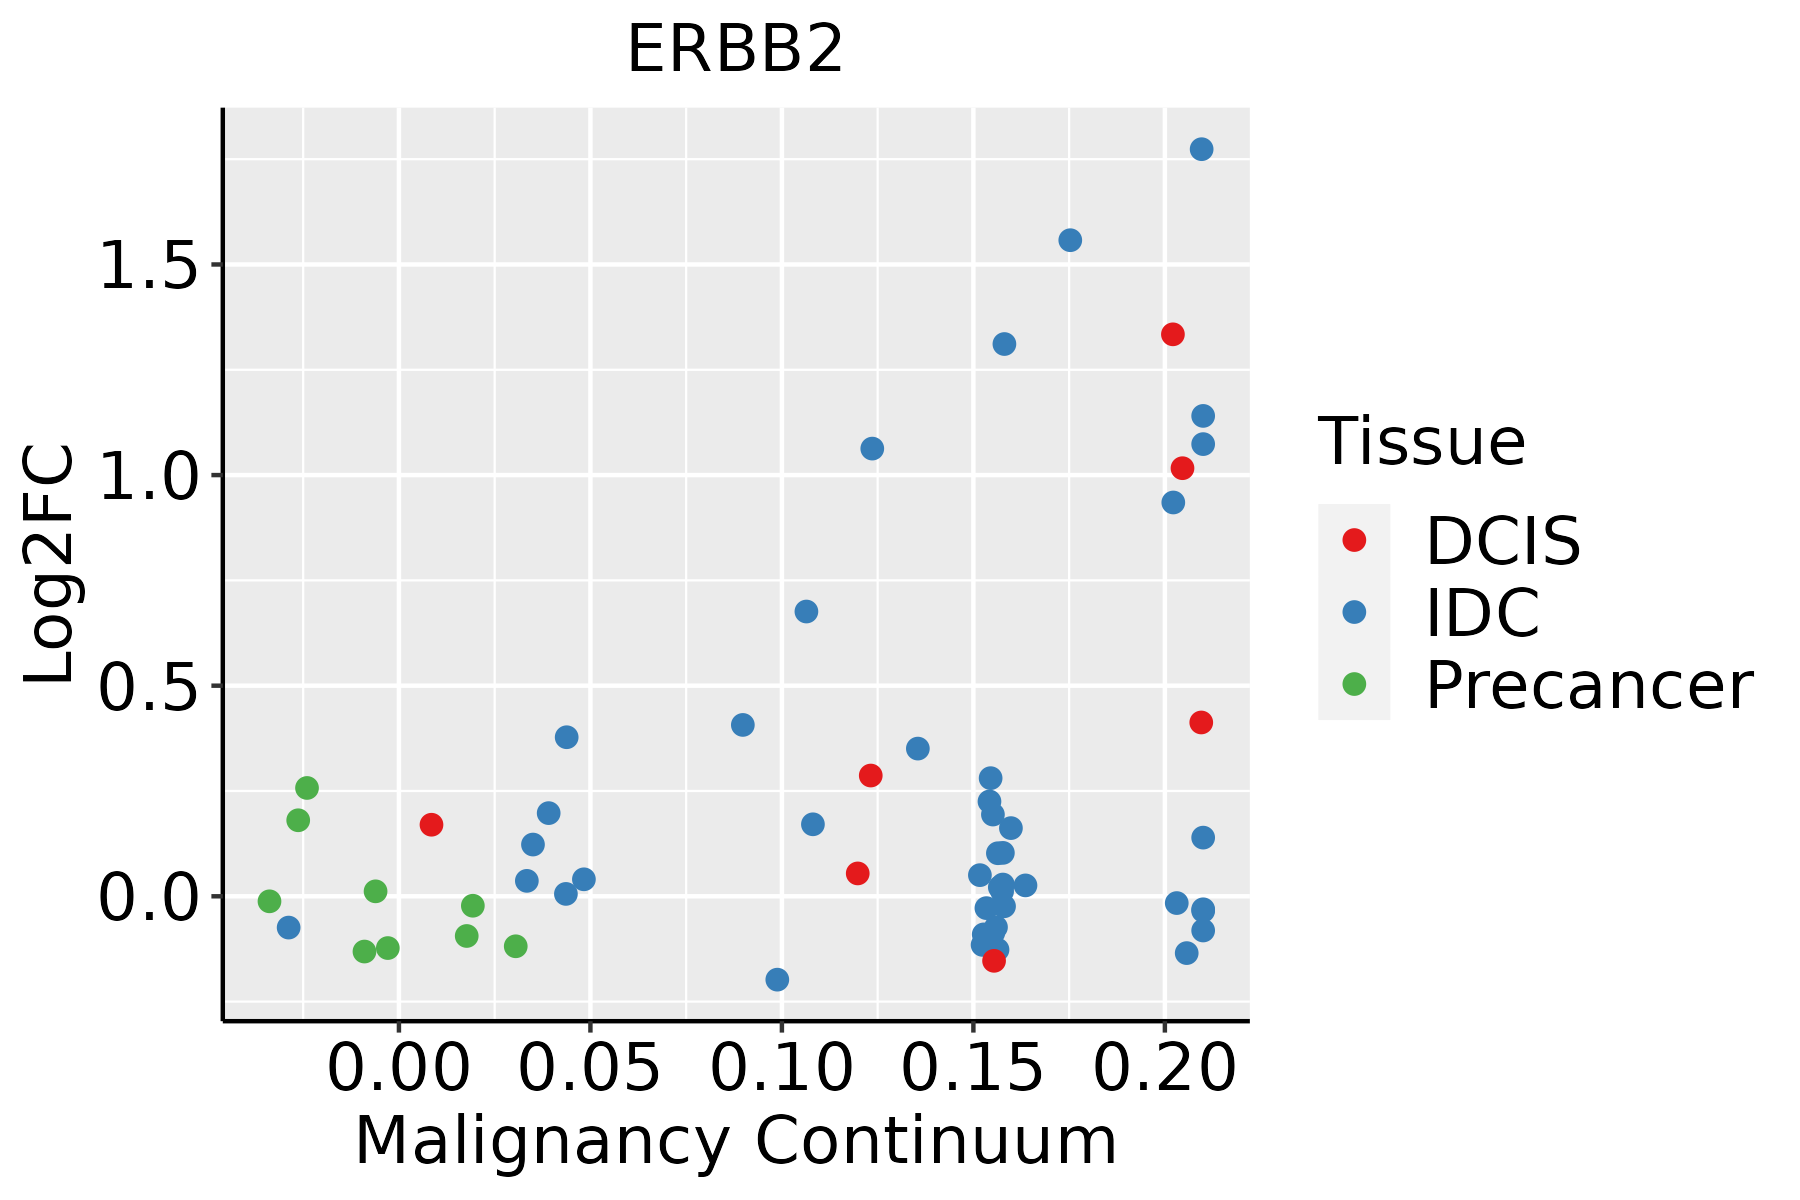 | IDC: Invasive ductal carcinoma |
| DCIS: Ductal carcinoma in situ | ||
| Precancer(BRCA1-mut): Precancerous lesion from BRCA1 mutation carriers | ||
| Colorectum (GSE201348) |  | FAP: Familial adenomatous polyposis |
| CRC: Colorectal cancer | ||
| Colorectum (HTA11) |  | AD: Adenomas |
| SER: Sessile serrated lesions | ||
| MSI-H: Microsatellite-high colorectal cancer | ||
| MSS: Microsatellite stable colorectal cancer | ||
| Esophagus | 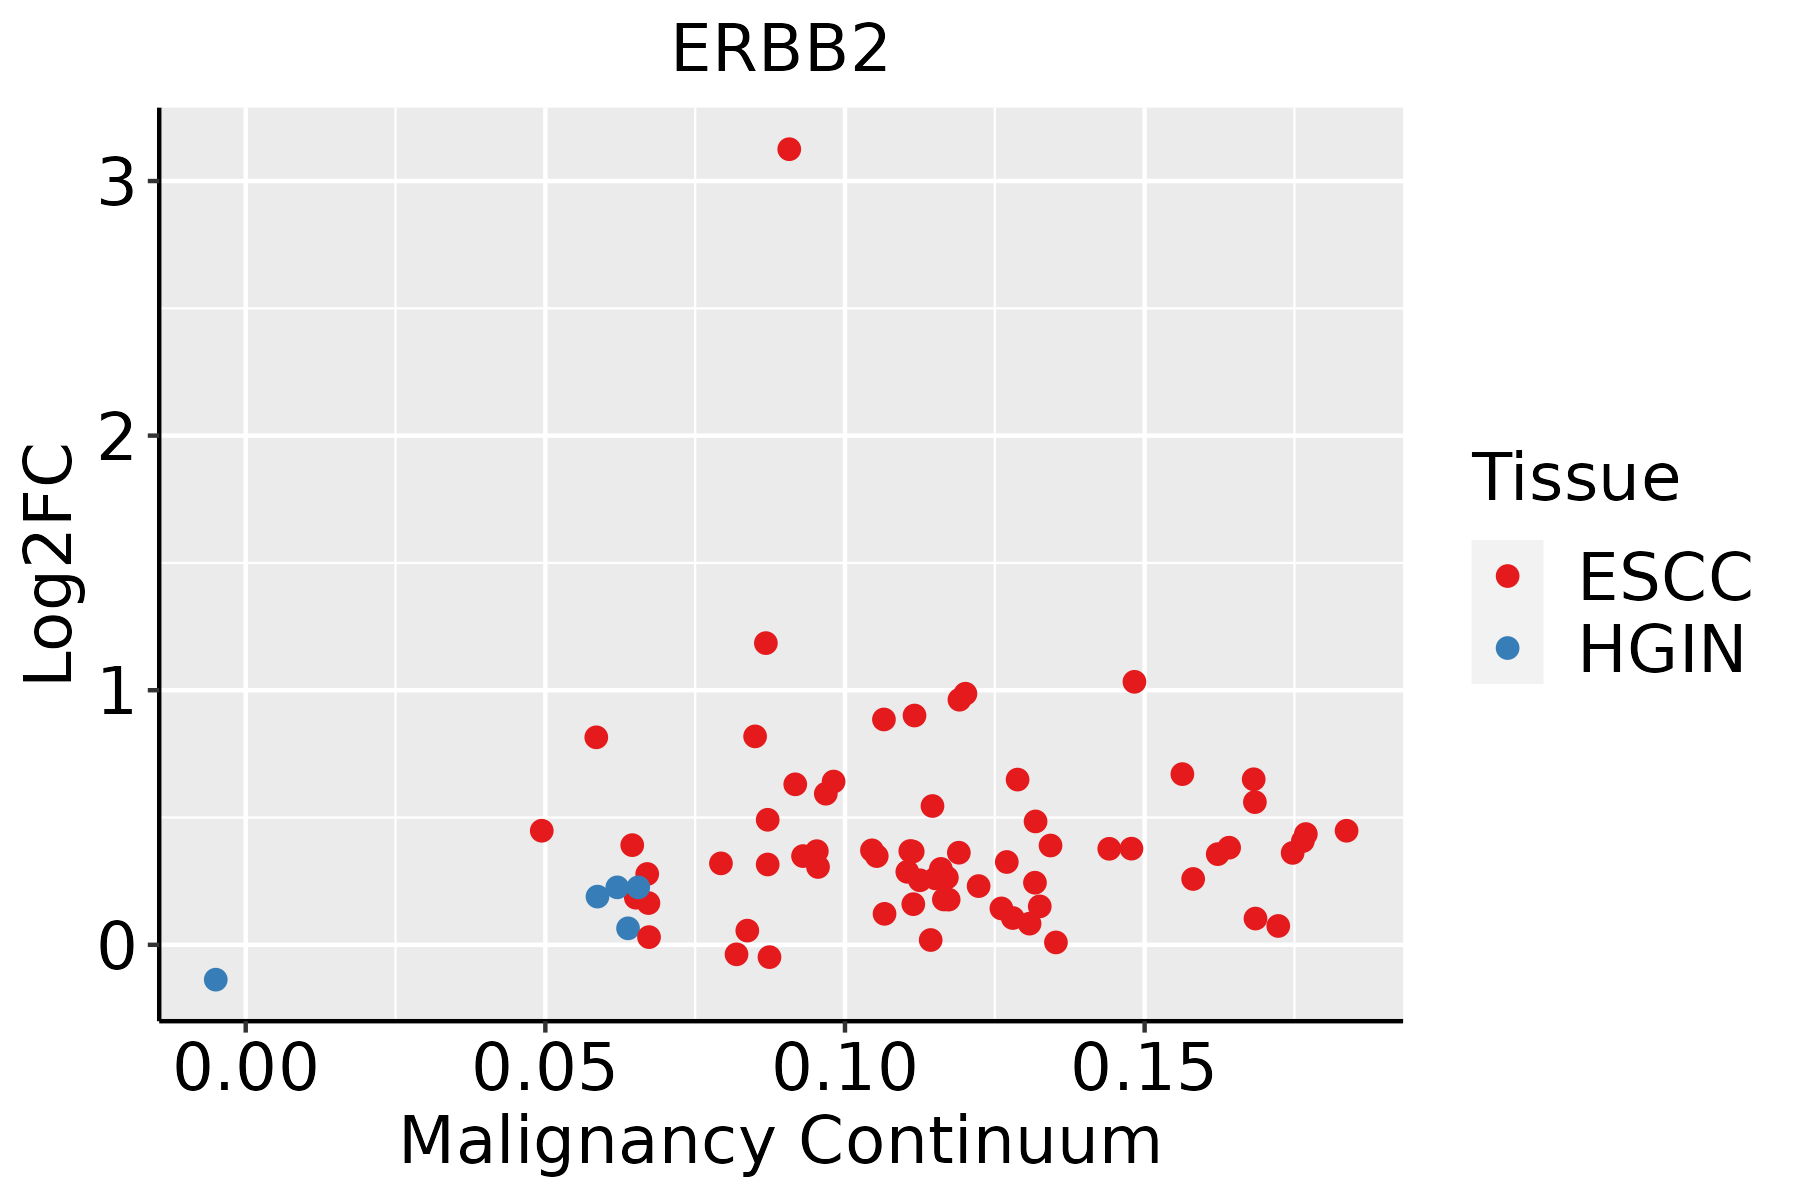 | ESCC: Esophageal squamous cell carcinoma |
| HGIN: High-grade intraepithelial neoplasias | ||
| LGIN: Low-grade intraepithelial neoplasias | ||
| Liver |  | HCC: Hepatocellular carcinoma |
| NAFLD: Non-alcoholic fatty liver disease | ||
| Oral Cavity |  | EOLP: Erosive Oral lichen planus |
| LP: leukoplakia | ||
| NEOLP: Non-erosive oral lichen planus | ||
| OSCC: Oral squamous cell carcinoma | ||
| Prostate | 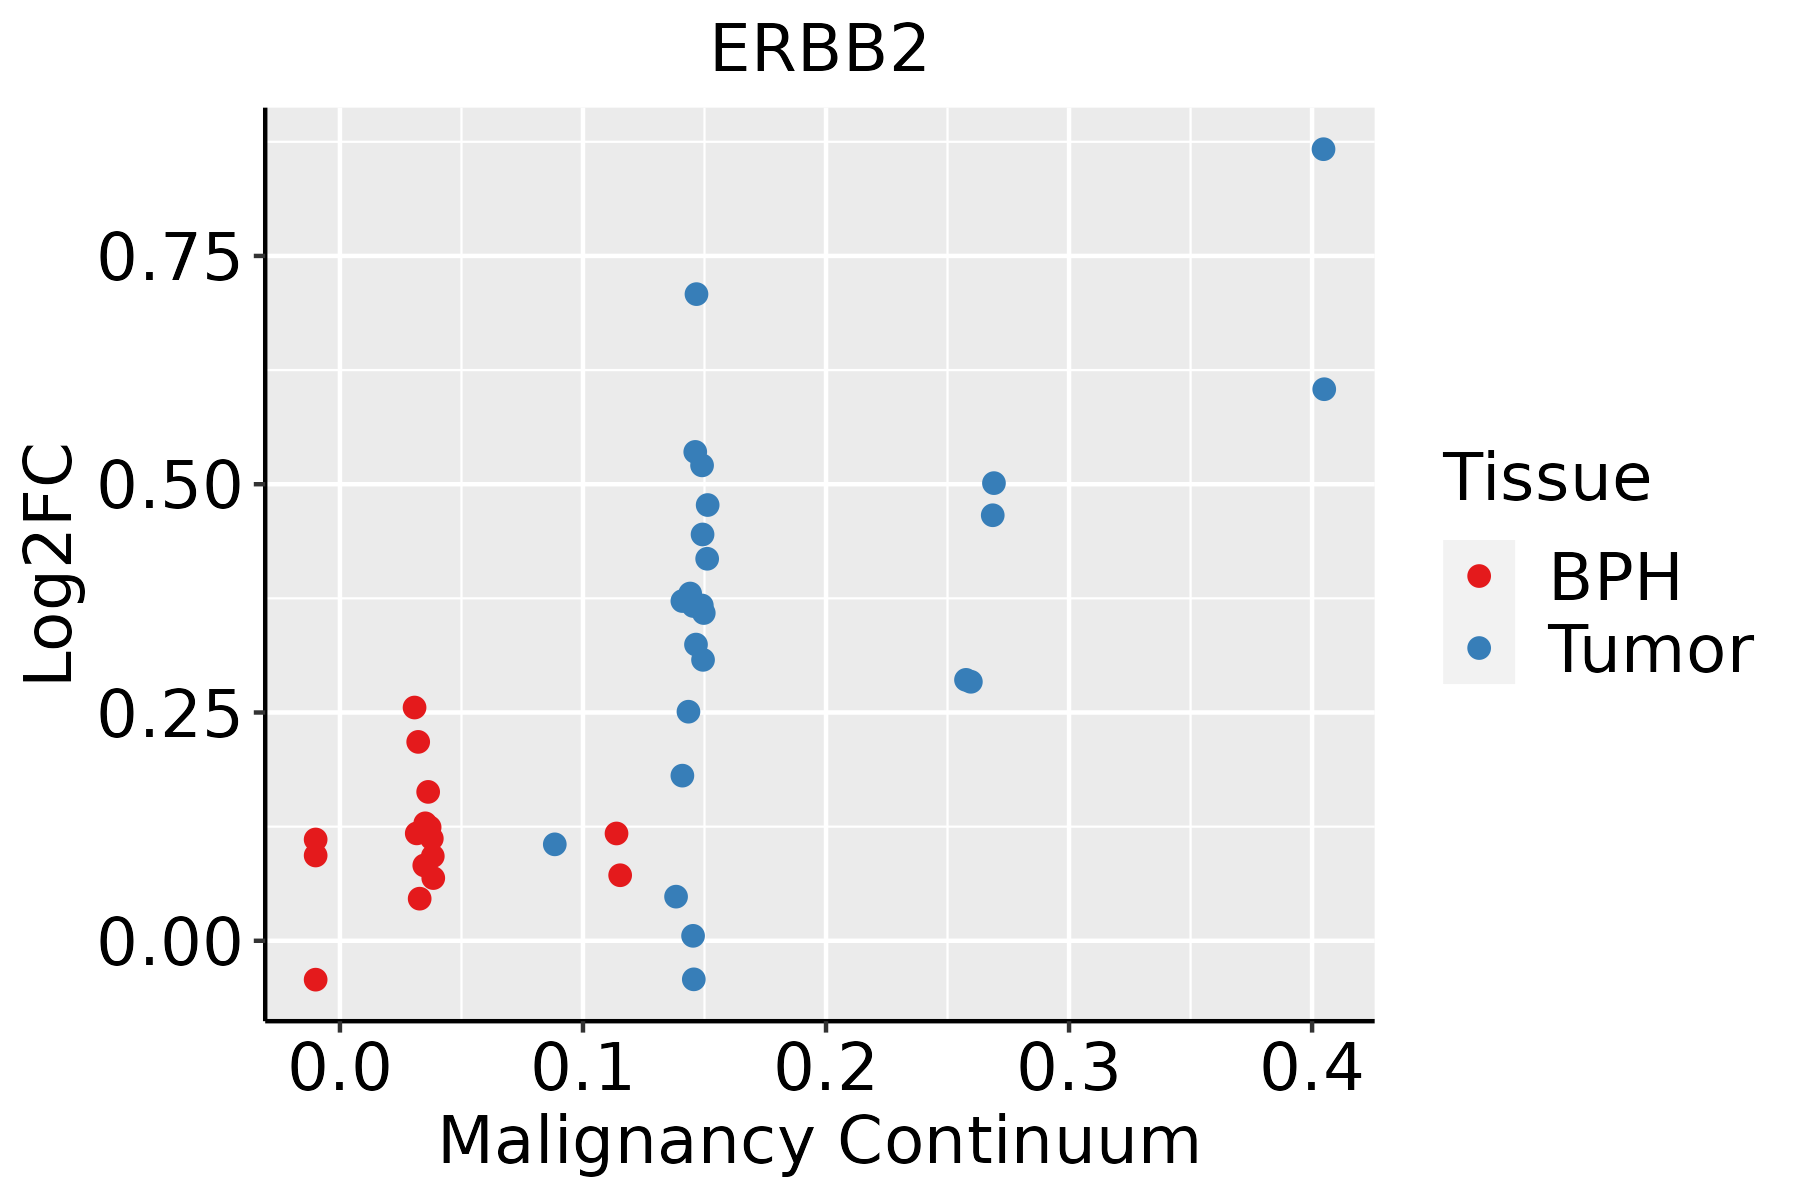 | BPH: Benign Prostatic Hyperplasia |
| Skin | 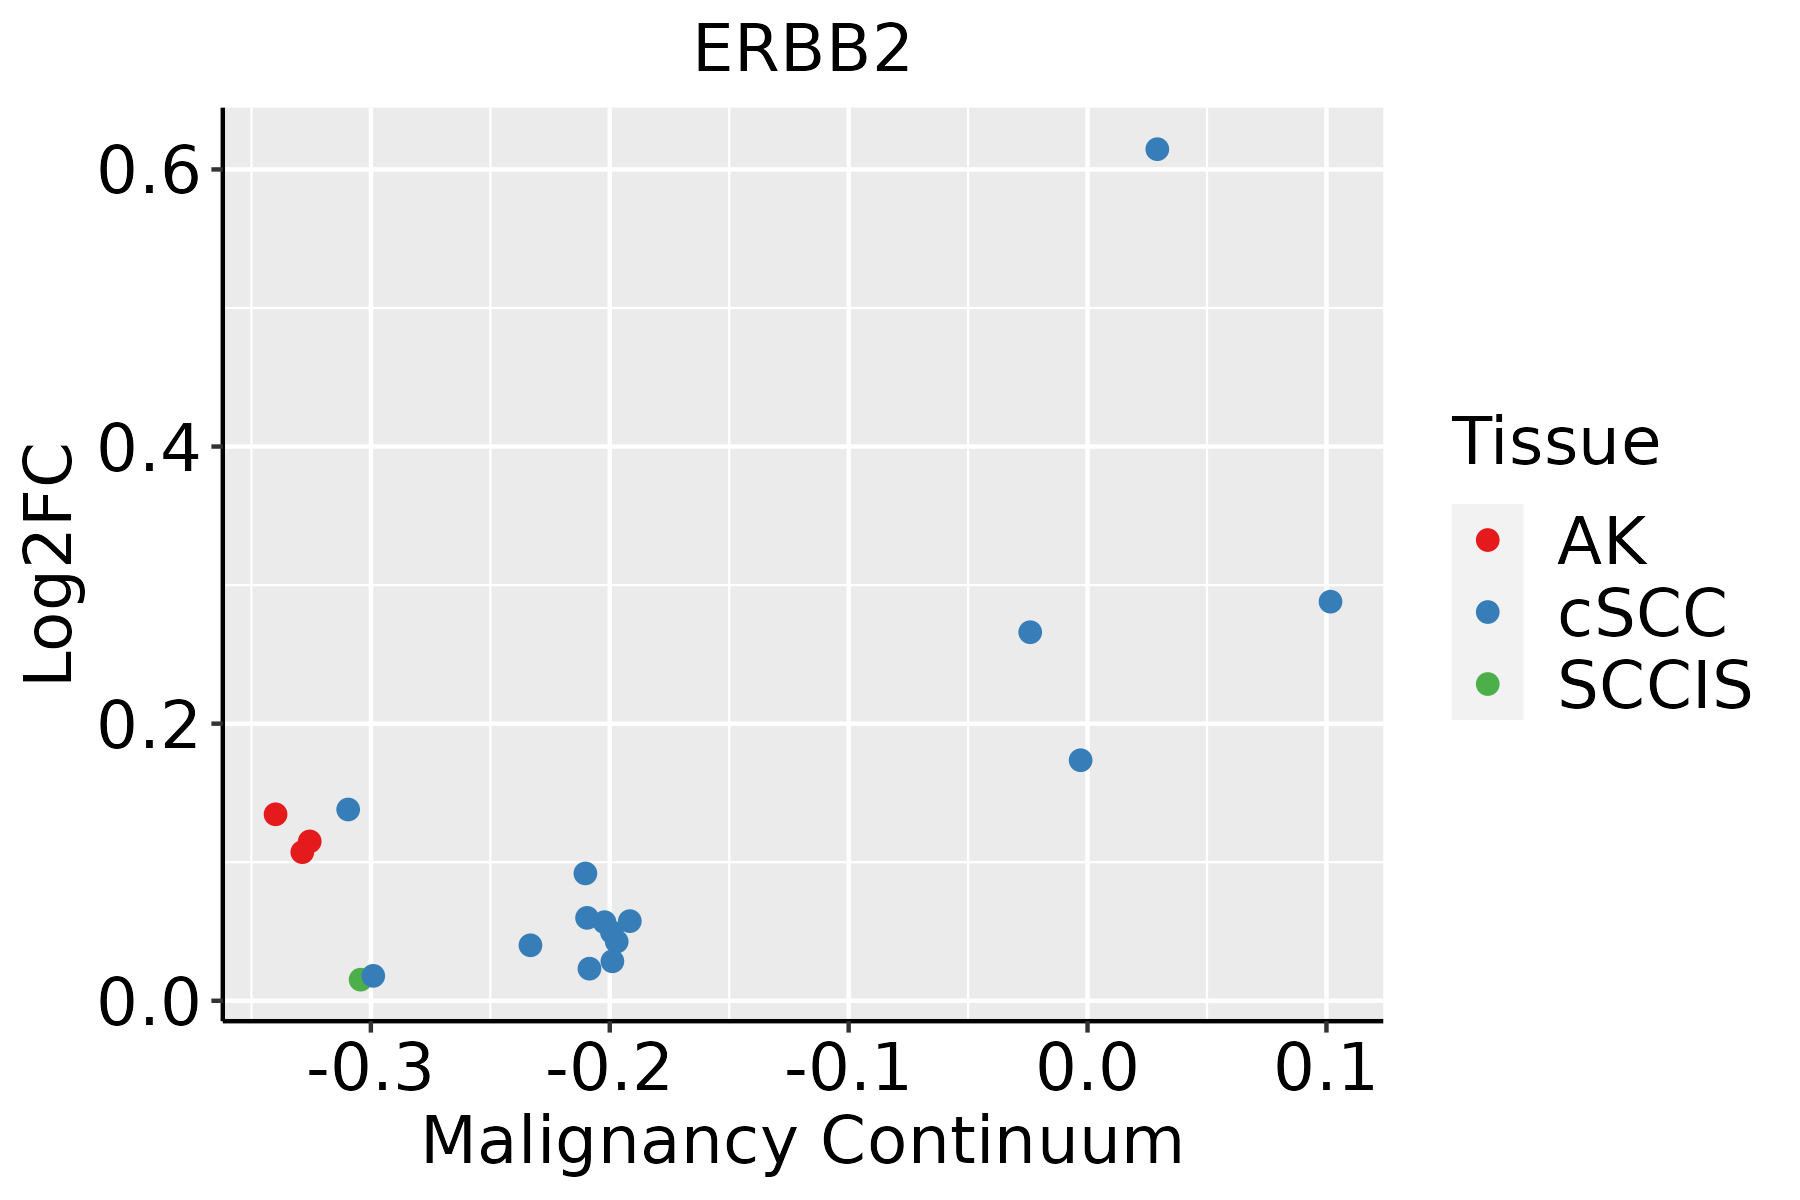 | AK: Actinic keratosis |
| cSCC: Cutaneous squamous cell carcinoma | ||
| SCCIS:squamous cell carcinoma in situ | ||
| Thyroid | 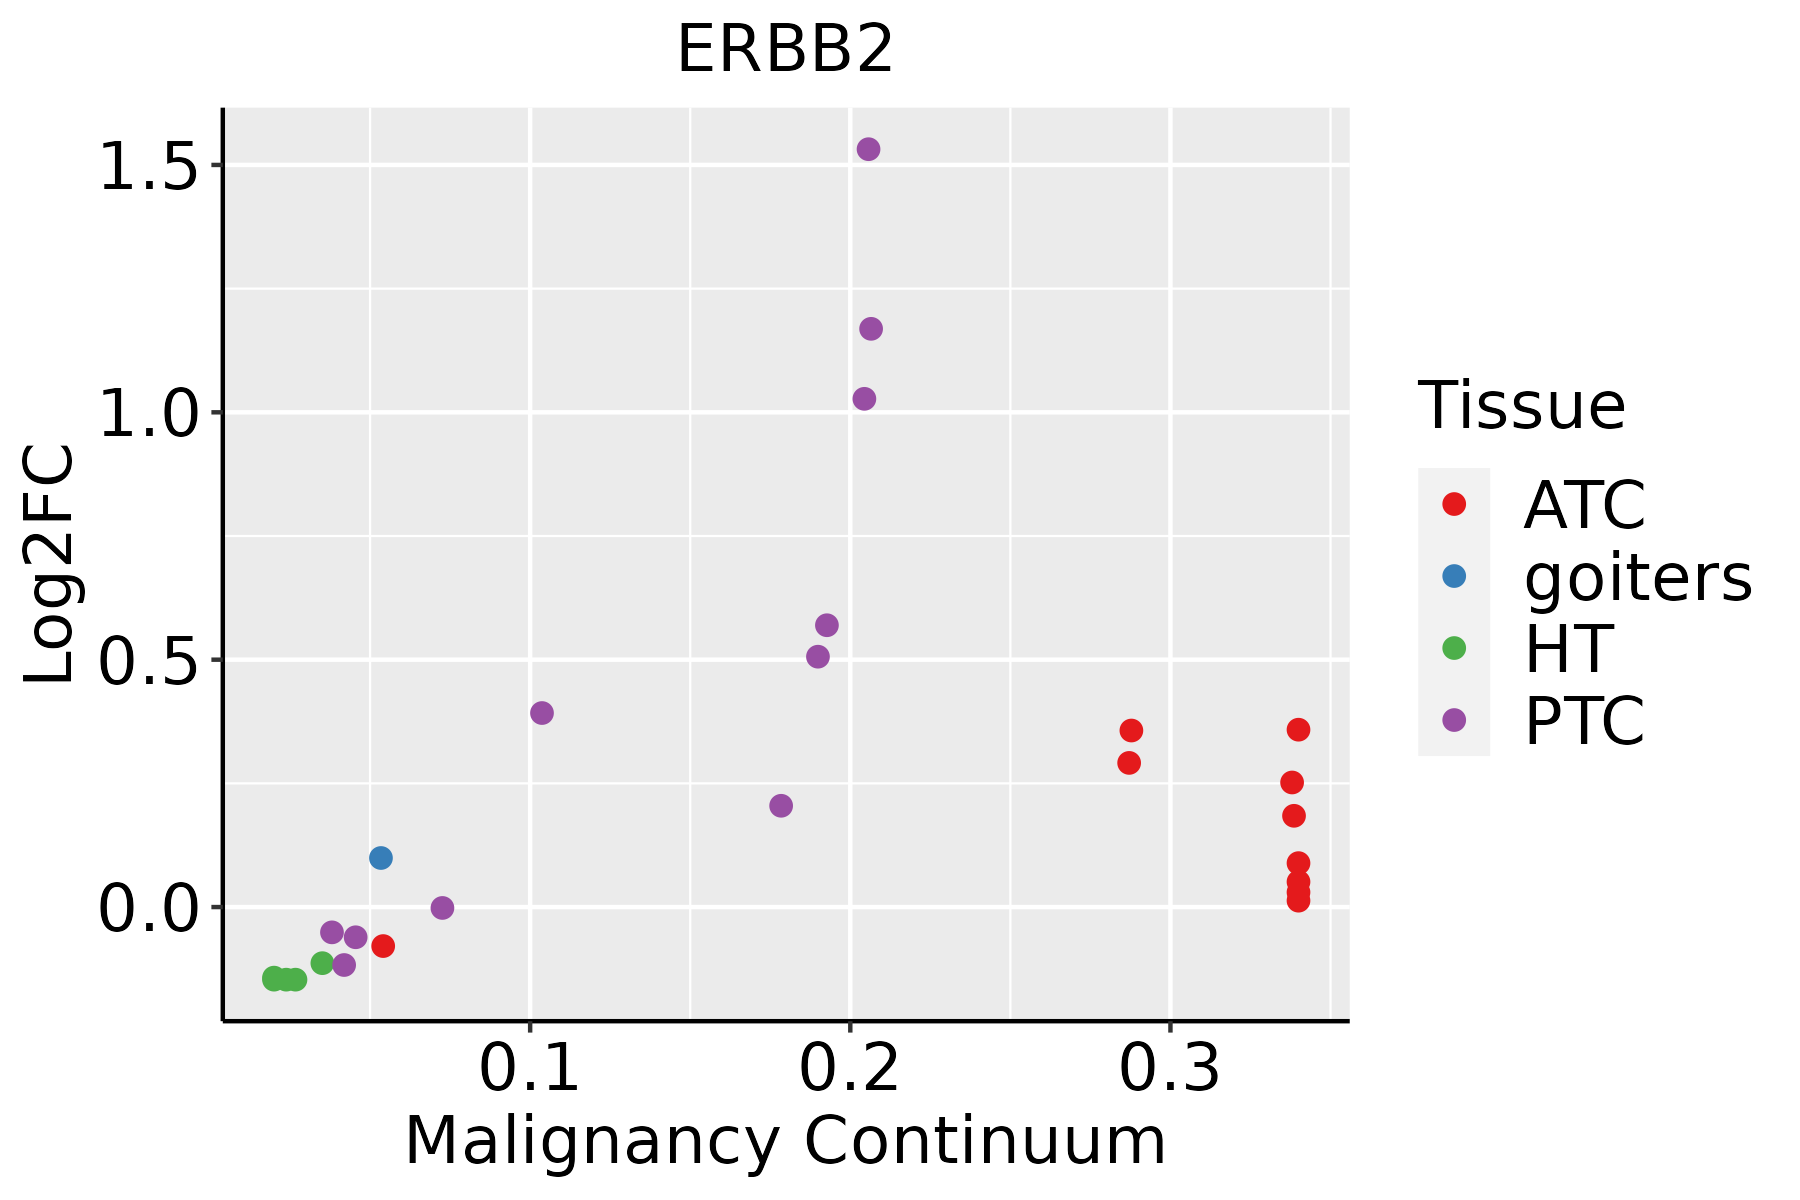 | ATC: Anaplastic thyroid cancer |
| HT: Hashimoto's thyroiditis | ||
| PTC: Papillary thyroid cancer |
| ∗log2FC in expression of this searched gene in stem-like cells from each diseased tissue sample relative to stem-like cells in normal samples in each tissue plotted against the malignancy continuum. Samples are colored based on if they are from different disease stage. |
Top |
Malignant transformation related pathway analysis |
| Find out the enriched GO biological processes and KEGG pathways involved in transition from healthy to precancer to cancer |
| Tissue | Disease Stage | Enriched GO biological Processes |
| Colorectum | AD |  |
| Colorectum | SER |  |
| Colorectum | MSS |  |
| Colorectum | MSI-H |  |
| Colorectum | FAP |  |
| ∗Top 15 enriched GO BP terms are showed in the bar plot of each disease state in each tissue. Each row represents a significant GO biological process which is colored according to the -log10(p.adjust). |
| Page: 1 2 3 4 5 6 7 8 9 |
| GO ID | Tissue | Disease Stage | Description | Gene Ratio | Bg Ratio | pvalue | p.adjust | Count |
| GO:00071621 | Colorectum | FAP | negative regulation of cell adhesion | 61/2622 | 303/18723 | 1.96e-03 | 1.65e-02 | 61 |
| GO:0043405 | Colorectum | FAP | regulation of MAP kinase activity | 39/2622 | 177/18723 | 2.38e-03 | 1.90e-02 | 39 |
| GO:0006612 | Colorectum | FAP | protein targeting to membrane | 30/2622 | 131/18723 | 3.95e-03 | 2.75e-02 | 30 |
| GO:1903131 | Colorectum | FAP | mononuclear cell differentiation | 79/2622 | 426/18723 | 5.00e-03 | 3.33e-02 | 79 |
| GO:0090314 | Colorectum | FAP | positive regulation of protein targeting to membrane | 10/2622 | 30/18723 | 5.90e-03 | 3.75e-02 | 10 |
| GO:19037063 | Colorectum | FAP | regulation of hemopoiesis | 69/2622 | 367/18723 | 6.01e-03 | 3.78e-02 | 69 |
| GO:00506781 | Colorectum | FAP | regulation of epithelial cell proliferation | 71/2622 | 381/18723 | 6.67e-03 | 4.12e-02 | 71 |
| GO:003238618 | Esophagus | ESCC | regulation of intracellular transport | 243/8552 | 337/18723 | 3.20e-23 | 7.25e-21 | 243 |
| GO:0006605111 | Esophagus | ESCC | protein targeting | 229/8552 | 314/18723 | 4.93e-23 | 1.01e-20 | 229 |
| GO:1903829111 | Esophagus | ESCC | positive regulation of cellular protein localization | 199/8552 | 276/18723 | 2.99e-19 | 3.45e-17 | 199 |
| GO:0033157110 | Esophagus | ESCC | regulation of intracellular protein transport | 169/8552 | 229/18723 | 3.31e-18 | 3.23e-16 | 169 |
| GO:0032388110 | Esophagus | ESCC | positive regulation of intracellular transport | 152/8552 | 202/18723 | 7.89e-18 | 7.36e-16 | 152 |
| GO:0006417111 | Esophagus | ESCC | regulation of translation | 304/8552 | 468/18723 | 1.53e-17 | 1.33e-15 | 304 |
| GO:1904951111 | Esophagus | ESCC | positive regulation of establishment of protein localization | 216/8552 | 319/18723 | 1.01e-15 | 6.86e-14 | 216 |
| GO:0090150110 | Esophagus | ESCC | establishment of protein localization to membrane | 182/8552 | 260/18723 | 1.27e-15 | 8.19e-14 | 182 |
| GO:009031617 | Esophagus | ESCC | positive regulation of intracellular protein transport | 122/8552 | 160/18723 | 2.45e-15 | 1.49e-13 | 122 |
| GO:0045727111 | Esophagus | ESCC | positive regulation of translation | 107/8552 | 136/18723 | 2.79e-15 | 1.68e-13 | 107 |
| GO:0034250111 | Esophagus | ESCC | positive regulation of cellular amide metabolic process | 123/8552 | 162/18723 | 3.32e-15 | 1.93e-13 | 123 |
| GO:0051222111 | Esophagus | ESCC | positive regulation of protein transport | 204/8552 | 303/18723 | 1.56e-14 | 8.38e-13 | 204 |
| GO:007190016 | Esophagus | ESCC | regulation of protein serine/threonine kinase activity | 227/8552 | 359/18723 | 1.12e-11 | 4.10e-10 | 227 |
| Page: 1 2 3 4 5 6 7 8 9 10 11 12 13 14 15 16 17 18 19 20 21 22 23 24 25 26 27 28 29 30 31 32 33 34 35 36 37 |
| Pathway ID | Tissue | Disease Stage | Description | Gene Ratio | Bg Ratio | pvalue | p.adjust | qvalue | Count |
| hsa0453018 | Breast | Precancer | Tight junction | 31/684 | 169/8465 | 1.13e-05 | 1.26e-04 | 9.64e-05 | 31 |
| hsa0406616 | Breast | Precancer | HIF-1 signaling pathway | 23/684 | 109/8465 | 1.51e-05 | 1.59e-04 | 1.22e-04 | 23 |
| hsa0520514 | Breast | Precancer | Proteoglycans in cancer | 30/684 | 205/8465 | 1.00e-03 | 7.18e-03 | 5.50e-03 | 30 |
| hsa0452018 | Breast | Precancer | Adherens junction | 17/684 | 93/8465 | 1.11e-03 | 7.57e-03 | 5.80e-03 | 17 |
| hsa052309 | Breast | Precancer | Central carbon metabolism in cancer | 13/684 | 70/8465 | 3.57e-03 | 2.17e-02 | 1.66e-02 | 13 |
| hsa0453019 | Breast | Precancer | Tight junction | 31/684 | 169/8465 | 1.13e-05 | 1.26e-04 | 9.64e-05 | 31 |
| hsa0406617 | Breast | Precancer | HIF-1 signaling pathway | 23/684 | 109/8465 | 1.51e-05 | 1.59e-04 | 1.22e-04 | 23 |
| hsa0520515 | Breast | Precancer | Proteoglycans in cancer | 30/684 | 205/8465 | 1.00e-03 | 7.18e-03 | 5.50e-03 | 30 |
| hsa0452019 | Breast | Precancer | Adherens junction | 17/684 | 93/8465 | 1.11e-03 | 7.57e-03 | 5.80e-03 | 17 |
| hsa0523012 | Breast | Precancer | Central carbon metabolism in cancer | 13/684 | 70/8465 | 3.57e-03 | 2.17e-02 | 1.66e-02 | 13 |
| hsa0453024 | Breast | IDC | Tight junction | 38/867 | 169/8465 | 2.07e-06 | 3.20e-05 | 2.39e-05 | 38 |
| hsa0520523 | Breast | IDC | Proteoglycans in cancer | 42/867 | 205/8465 | 7.69e-06 | 9.99e-05 | 7.48e-05 | 42 |
| hsa0406623 | Breast | IDC | HIF-1 signaling pathway | 22/867 | 109/8465 | 1.36e-03 | 1.00e-02 | 7.50e-03 | 22 |
| hsa0521921 | Breast | IDC | Bladder cancer | 10/867 | 41/8465 | 7.07e-03 | 3.54e-02 | 2.65e-02 | 10 |
| hsa045109 | Breast | IDC | Focal adhesion | 32/867 | 203/8465 | 8.60e-03 | 4.23e-02 | 3.17e-02 | 32 |
| hsa0453034 | Breast | IDC | Tight junction | 38/867 | 169/8465 | 2.07e-06 | 3.20e-05 | 2.39e-05 | 38 |
| hsa0520533 | Breast | IDC | Proteoglycans in cancer | 42/867 | 205/8465 | 7.69e-06 | 9.99e-05 | 7.48e-05 | 42 |
| hsa0406633 | Breast | IDC | HIF-1 signaling pathway | 22/867 | 109/8465 | 1.36e-03 | 1.00e-02 | 7.50e-03 | 22 |
| hsa0521931 | Breast | IDC | Bladder cancer | 10/867 | 41/8465 | 7.07e-03 | 3.54e-02 | 2.65e-02 | 10 |
| hsa0451013 | Breast | IDC | Focal adhesion | 32/867 | 203/8465 | 8.60e-03 | 4.23e-02 | 3.17e-02 | 32 |
| Page: 1 2 3 4 5 6 7 8 9 10 11 12 13 14 15 |
Top |
Cell-cell communication analysis |
| Identification of potential cell-cell interactions between two cell types and their ligand-receptor pairs for different disease states |
| Ligand | Receptor | LRpair | Pathway | Tissue | Disease Stage |
| AREG | EGFR_ERBB2 | AREG_EGFR_ERBB2 | EGF | Breast | DCIS |
| HBEGF | EGFR_ERBB2 | HBEGF_EGFR_ERBB2 | EGF | Breast | DCIS |
| EREG | EGFR_ERBB2 | EREG_EGFR_ERBB2 | EGF | Breast | DCIS |
| NRG1 | ERBB2_ERBB3 | NRG1_ERBB2_ERBB3 | NRG | Breast | DCIS |
| AREG | EGFR_ERBB2 | AREG_EGFR_ERBB2 | EGF | Cervix | CC |
| HBEGF | EGFR_ERBB2 | HBEGF_EGFR_ERBB2 | EGF | Cervix | CC |
| HBEGF | ERBB2_ERBB4 | HBEGF_ERBB2_ERBB4 | EGF | Cervix | CC |
| NRG1 | ERBB2_ERBB4 | NRG1_ERBB2_ERBB4 | NRG | Cervix | CC |
| NRG4 | ERBB2_ERBB4 | NRG4_ERBB2_ERBB4 | NRG | Cervix | CC |
| NRG1 | ERBB2_ERBB3 | NRG1_ERBB2_ERBB3 | NRG | Cervix | Precancer |
| NRG1 | ERBB2_ERBB3 | NRG1_ERBB2_ERBB3 | NRG | CRC | AD |
| TGFA | EGFR_ERBB2 | TGFA_EGFR_ERBB2 | EGF | CRC | AD |
| NRG1 | ERBB2_ERBB3 | NRG1_ERBB2_ERBB3 | NRG | CRC | ADJ |
| TGFA | EGFR_ERBB2 | TGFA_EGFR_ERBB2 | EGF | CRC | ADJ |
| AREG | EGFR_ERBB2 | AREG_EGFR_ERBB2 | EGF | CRC | ADJ |
| AREG | EGFR_ERBB2 | AREG_EGFR_ERBB2 | EGF | CRC | FAP |
| NRG1 | ERBB2_ERBB3 | NRG1_ERBB2_ERBB3 | NRG | CRC | FAP |
| TGFA | EGFR_ERBB2 | TGFA_EGFR_ERBB2 | EGF | CRC | MSI-H |
| AREG | EGFR_ERBB2 | AREG_EGFR_ERBB2 | EGF | CRC | MSI-H |
| HBEGF | EGFR_ERBB2 | HBEGF_EGFR_ERBB2 | EGF | CRC | MSS |
| Page: 1 |
Top |
Single-cell gene regulatory network inference analysis |
| Find out the significant the regulons (TFs) and the target genes of each regulon across cell types for different disease states |
| TF | Cell Type | Tissue | Disease Stage | Target Gene | RSS | Regulon Activity |
| ∗The dot plots of a searched regulon are shown for all cell subpopulations in each disease state of each tissue based on the regulon specific score inferred using pySCENIC and by calculating the average expression. |
| Page: 1 |
Top |
Somatic mutation of malignant transformation related genes |
| Annotation of somatic variants for genes involved in malignant transformation |
| Hugo Symbol | Variant Class | Variant Classification | dbSNP RS | HGVSc | HGVSp | HGVSp Short | SWISSPROT | BIOTYPE | SIFT | PolyPhen | Tumor Sample Barcode | Tissue | Histology | Sex | Age | Stage | Therapy Types | Drugs | Outcome |
| ERBB2 | SNV | Missense_Mutation | rs121913471 | c.2329N>T | p.Val777Leu | p.V777L | P04626 | protein_coding | deleterious(0.05) | benign(0.036) | TCGA-4H-AAAK-01 | Breast | breast invasive carcinoma | Female | <65 | III/IV | Chemotherapy | cyclophosphamide | CR |
| ERBB2 | SNV | Missense_Mutation | c.2033N>A | p.Arg678Gln | p.R678Q | P04626 | protein_coding | tolerated(0.19) | benign(0.103) | TCGA-A2-A0T6-01 | Breast | breast invasive carcinoma | Female | <65 | I/II | Chemotherapy | adriamycin | SD | |
| ERBB2 | SNV | Missense_Mutation | c.2263N>A | p.Leu755Met | p.L755M | P04626 | protein_coding | deleterious(0) | probably_damaging(1) | TCGA-A2-A0T6-01 | Breast | breast invasive carcinoma | Female | <65 | I/II | Chemotherapy | adriamycin | SD | |
| ERBB2 | SNV | Missense_Mutation | c.2264N>G | p.Leu755Trp | p.L755W | P04626 | protein_coding | deleterious(0) | probably_damaging(1) | TCGA-A2-A0T6-01 | Breast | breast invasive carcinoma | Female | <65 | I/II | Chemotherapy | adriamycin | SD | |
| ERBB2 | SNV | Missense_Mutation | c.929C>T | p.Ser310Phe | p.S310F | P04626 | protein_coding | deleterious(0) | probably_damaging(0.995) | TCGA-A2-A3XV-01 | Breast | breast invasive carcinoma | Female | <65 | I/II | Chemotherapy | carboplatin | CR | |
| ERBB2 | SNV | Missense_Mutation | c.926N>C | p.Gly309Ala | p.G309A | P04626 | protein_coding | deleterious(0.02) | probably_damaging(0.997) | TCGA-A8-A06Z-01 | Breast | breast invasive carcinoma | Female | >=65 | I/II | Unknown | Unknown | SD | |
| ERBB2 | SNV | Missense_Mutation | c.2524N>A | p.Val842Ile | p.V842I | P04626 | protein_coding | deleterious(0) | possibly_damaging(0.906) | TCGA-A8-A08Z-01 | Breast | breast invasive carcinoma | Female | >=65 | III/IV | Unknown | Unknown | SD | |
| ERBB2 | SNV | Missense_Mutation | rs121913470 | c.2264N>C | p.Leu755Ser | p.L755S | P04626 | protein_coding | deleterious(0) | probably_damaging(1) | TCGA-A8-A0A6-01 | Breast | breast invasive carcinoma | Female | <65 | III/IV | Chemotherapy | epirubicin | CR |
| ERBB2 | SNV | Missense_Mutation | rs121913470 | c.2264T>C | p.Leu755Ser | p.L755S | P04626 | protein_coding | deleterious(0) | probably_damaging(1) | TCGA-A8-A0AB-01 | Breast | breast invasive carcinoma | Female | <65 | I/II | Chemotherapy | 5-fluorouracil | CR |
| ERBB2 | SNV | Missense_Mutation | rs121913470 | c.2264T>C | p.Leu755Ser | p.L755S | P04626 | protein_coding | deleterious(0) | probably_damaging(1) | TCGA-AC-A3YI-01 | Breast | breast invasive carcinoma | Female | >=65 | III/IV | Chemotherapy | cytoxan | CR |
| Page: 1 2 3 4 5 6 7 8 9 10 11 12 13 14 15 16 17 |
Top |
Related drugs of malignant transformation related genes |
| Identification of chemicals and drugs interact with genes involved in malignant transfromation |
| (DGIdb 4.0) |
| Entrez ID | Symbol | Category | Interaction Types | Drug Claim Name | Drug Name | PMIDs |
| 2064 | ERBB2 | KINASE, DRUGGABLE GENOME, CLINICALLY ACTIONABLE, DRUG RESISTANCE, TYROSINE KINASE | EMODIN | EMODIN | 9671406 | |
| 2064 | ERBB2 | KINASE, DRUGGABLE GENOME, CLINICALLY ACTIONABLE, DRUG RESISTANCE, TYROSINE KINASE | CHEMBL2108029 | ERTUMAXOMAB | ||
| 2064 | ERBB2 | KINASE, DRUGGABLE GENOME, CLINICALLY ACTIONABLE, DRUG RESISTANCE, TYROSINE KINASE | Talazoparib | TALAZOPARIB | ||
| 2064 | ERBB2 | KINASE, DRUGGABLE GENOME, CLINICALLY ACTIONABLE, DRUG RESISTANCE, TYROSINE KINASE | inhibitor | CHEMBL3545063 | OSIMERTINIB MESYLATE | |
| 2064 | ERBB2 | KINASE, DRUGGABLE GENOME, CLINICALLY ACTIONABLE, DRUG RESISTANCE, TYROSINE KINASE | inhibitor | CHEMBL1645462 | AC-480 | |
| 2064 | ERBB2 | KINASE, DRUGGABLE GENOME, CLINICALLY ACTIONABLE, DRUG RESISTANCE, TYROSINE KINASE | AC480 | AC-480 | ||
| 2064 | ERBB2 | KINASE, DRUGGABLE GENOME, CLINICALLY ACTIONABLE, DRUG RESISTANCE, TYROSINE KINASE | antibody | PERTUZUMAB | PERTUZUMAB | |
| 2064 | ERBB2 | KINASE, DRUGGABLE GENOME, CLINICALLY ACTIONABLE, DRUG RESISTANCE, TYROSINE KINASE | trastuzumab emtansine | |||
| 2064 | ERBB2 | KINASE, DRUGGABLE GENOME, CLINICALLY ACTIONABLE, DRUG RESISTANCE, TYROSINE KINASE | GEMCITABINE | GEMCITABINE | 15581051 | |
| 2064 | ERBB2 | KINASE, DRUGGABLE GENOME, CLINICALLY ACTIONABLE, DRUG RESISTANCE, TYROSINE KINASE | Neratinib | NERATINIB | 28274957,28679771,22908275,26874901,23953056,28363995,26333383,27078022,28539475,24323026,23220880,27697991,26243863 |
| Page: 1 2 3 4 5 6 7 8 9 10 11 12 13 14 15 16 17 18 19 20 21 22 23 24 25 26 27 28 29 30 31 32 33 34 35 36 37 38 39 40 41 42 43 44 |

Copyright 2023-Present -The University of Texas Health Science Center at Houston |