
|
|||||
|
 | |
| |
| |
| |
| |
| |
|
Gene: ENPP1 |
Gene summary for ENPP1 |
| Gene information | Species | Human | Gene symbol | ENPP1 | Gene ID | 5167 |
| Gene name | ectonucleotide pyrophosphatase/phosphodiesterase 1 | |
| Gene Alias | ARHR2 | |
| Cytomap | 6q23.2 | |
| Gene Type | protein-coding | GO ID | GO:0000271 | UniProtAcc | P22413 |
Top |
Malignant transformation analysis |
| Identification of the aberrant gene expression in precancerous and cancerous lesions by comparing the gene expression of stem-like cells in diseased tissues with normal stem cells |
| Entrez ID | Symbol | Replicates | Species | Organ | Tissue | Adj P-value | Log2FC | Malignancy |
| 5167 | ENPP1 | NAFLD1 | Human | Liver | NAFLD | 1.50e-10 | 7.75e-01 | -0.04 |
| 5167 | ENPP1 | S41 | Human | Liver | Cirrhotic | 1.47e-02 | 4.81e-01 | -0.0343 |
| 5167 | ENPP1 | S43 | Human | Liver | Cirrhotic | 3.53e-03 | -9.79e-02 | -0.0187 |
| 5167 | ENPP1 | HCC1_Meng | Human | Liver | HCC | 1.55e-47 | -5.76e-02 | 0.0246 |
| 5167 | ENPP1 | HCC2_Meng | Human | Liver | HCC | 3.41e-03 | -1.58e-01 | 0.0107 |
| 5167 | ENPP1 | cirrhotic1 | Human | Liver | Cirrhotic | 3.22e-03 | -1.70e-01 | 0.0202 |
| 5167 | ENPP1 | HCC1 | Human | Liver | HCC | 1.37e-22 | 4.30e+00 | 0.5336 |
| 5167 | ENPP1 | HCC2 | Human | Liver | HCC | 2.23e-11 | 3.59e+00 | 0.5341 |
| 5167 | ENPP1 | Pt14.a | Human | Liver | HCC | 4.66e-03 | 2.94e-01 | 0.0169 |
| 5167 | ENPP1 | male-WTA | Human | Thyroid | PTC | 9.36e-04 | -4.21e-02 | 0.1037 |
| 5167 | ENPP1 | PTC01 | Human | Thyroid | PTC | 5.59e-03 | -9.17e-02 | 0.1899 |
| 5167 | ENPP1 | PTC04 | Human | Thyroid | PTC | 4.99e-08 | 1.77e-01 | 0.1927 |
| 5167 | ENPP1 | PTC05 | Human | Thyroid | PTC | 2.27e-05 | 3.23e-01 | 0.2065 |
| 5167 | ENPP1 | PTC06 | Human | Thyroid | PTC | 4.11e-10 | 2.77e-02 | 0.2057 |
| 5167 | ENPP1 | PTC07 | Human | Thyroid | PTC | 2.24e-12 | -7.08e-02 | 0.2044 |
| 5167 | ENPP1 | ATC09 | Human | Thyroid | ATC | 1.69e-07 | 8.88e-02 | 0.2871 |
| 5167 | ENPP1 | ATC12 | Human | Thyroid | ATC | 1.08e-06 | -1.13e-01 | 0.34 |
| 5167 | ENPP1 | ATC13 | Human | Thyroid | ATC | 8.39e-52 | 1.14e+00 | 0.34 |
| 5167 | ENPP1 | ATC1 | Human | Thyroid | ATC | 2.09e-07 | 1.24e-01 | 0.2878 |
| 5167 | ENPP1 | ATC2 | Human | Thyroid | ATC | 9.97e-06 | 7.47e-01 | 0.34 |
| Page: 1 2 |
| Tissue | Expression Dynamics | Abbreviation |
| Liver | 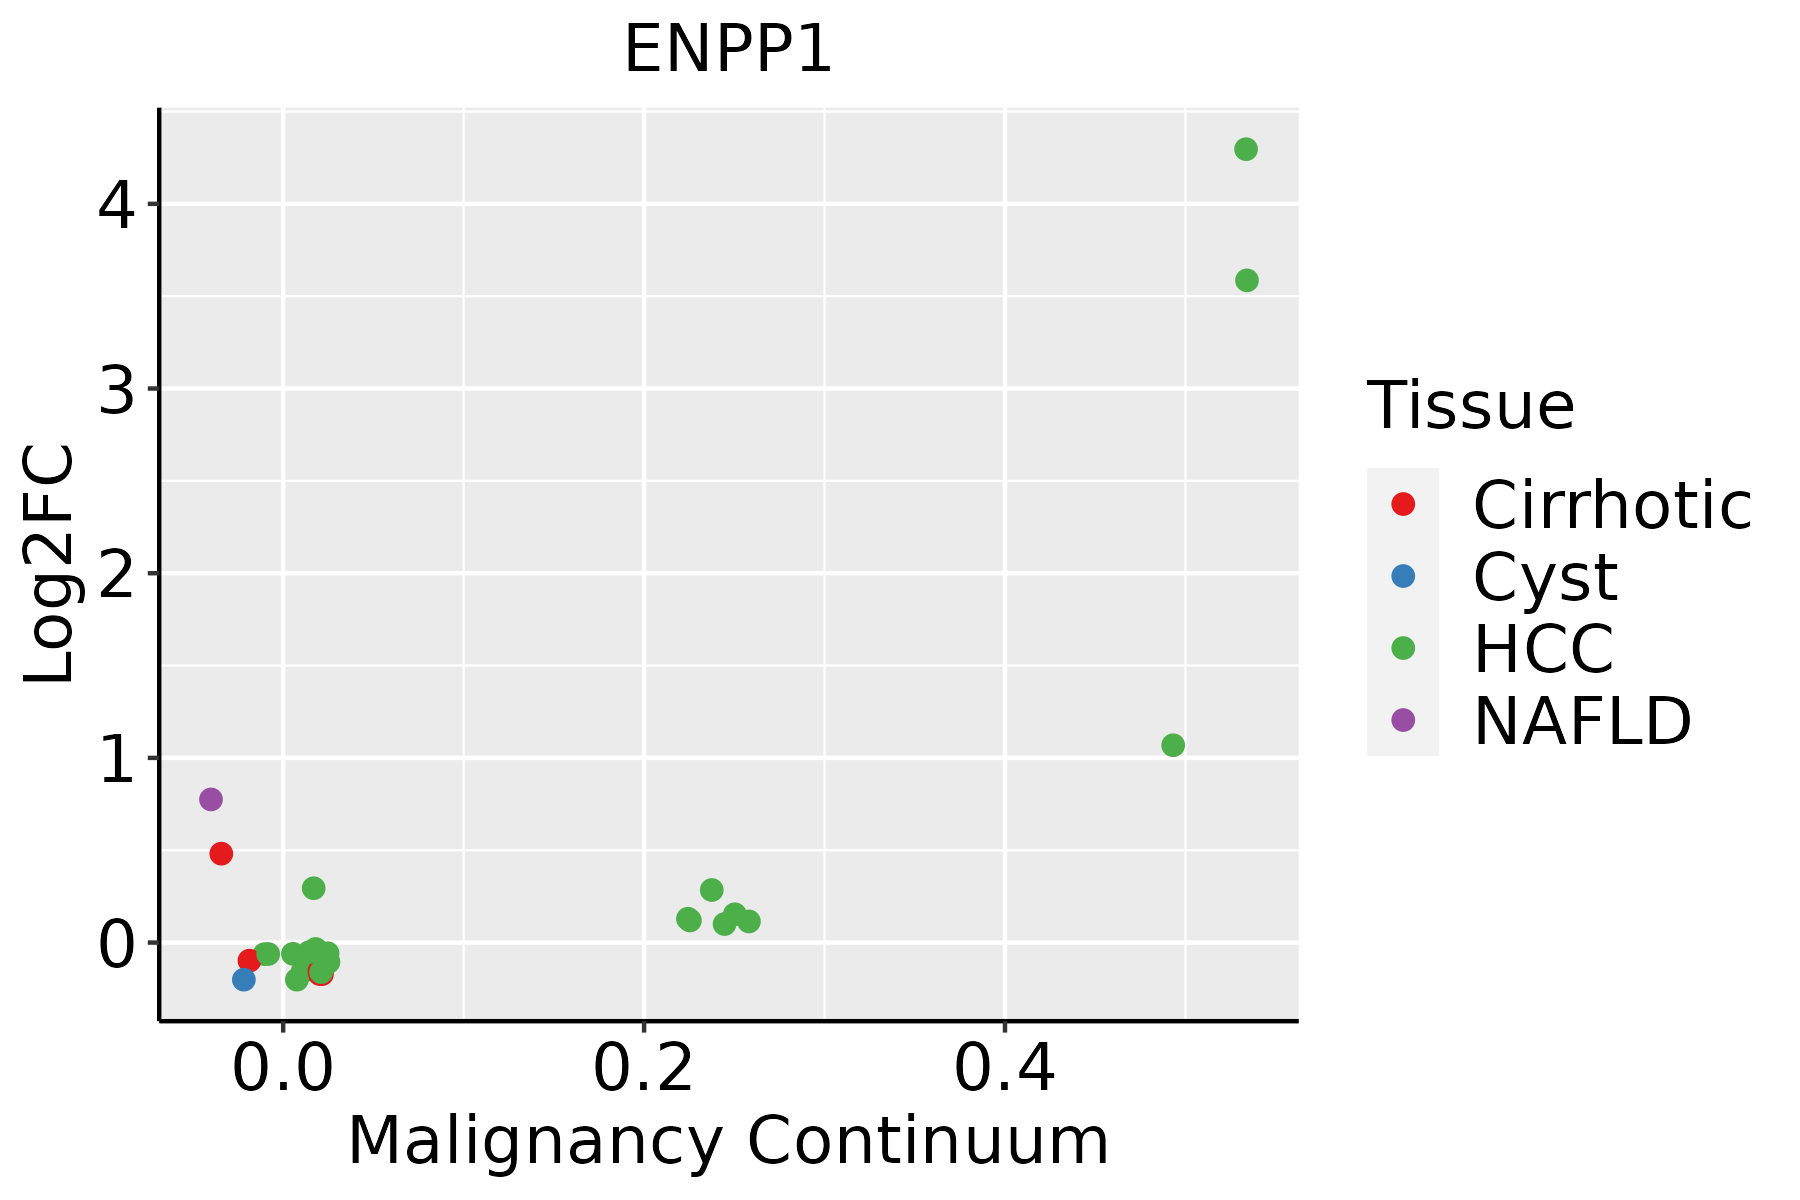 | HCC: Hepatocellular carcinoma |
| NAFLD: Non-alcoholic fatty liver disease | ||
| Thyroid |  | ATC: Anaplastic thyroid cancer |
| HT: Hashimoto's thyroiditis | ||
| PTC: Papillary thyroid cancer |
| ∗log2FC in expression of this searched gene in stem-like cells from each diseased tissue sample relative to stem-like cells in normal samples in each tissue plotted against the malignancy continuum. Samples are colored based on if they are from different disease stage. |
Top |
Malignant transformation related pathway analysis |
| Find out the enriched GO biological processes and KEGG pathways involved in transition from healthy to precancer to cancer |
| Tissue | Disease Stage | Enriched GO biological Processes |
| Colorectum | AD |  |
| Colorectum | SER |  |
| Colorectum | MSS |  |
| Colorectum | MSI-H |  |
| Colorectum | FAP |  |
| ∗Top 15 enriched GO BP terms are showed in the bar plot of each disease state in each tissue. Each row represents a significant GO biological process which is colored according to the -log10(p.adjust). |
| Page: 1 2 3 4 5 6 7 8 9 |
| GO ID | Tissue | Disease Stage | Description | Gene Ratio | Bg Ratio | pvalue | p.adjust | Count |
| GO:00302785 | Thyroid | PTC | regulation of ossification | 51/5968 | 115/18723 | 3.30e-03 | 1.61e-02 | 51 |
| GO:00510518 | Thyroid | PTC | negative regulation of transport | 176/5968 | 470/18723 | 5.44e-03 | 2.49e-02 | 176 |
| GO:004559814 | Thyroid | PTC | regulation of fat cell differentiation | 59/5968 | 139/18723 | 5.50e-03 | 2.50e-02 | 59 |
| GO:19000764 | Thyroid | PTC | regulation of cellular response to insulin stimulus | 30/5968 | 64/18723 | 8.53e-03 | 3.58e-02 | 30 |
| GO:0045879 | Thyroid | PTC | negative regulation of smoothened signaling pathway | 17/5968 | 32/18723 | 1.02e-02 | 4.11e-02 | 17 |
| GO:00328851 | Thyroid | PTC | regulation of polysaccharide biosynthetic process | 19/5968 | 37/18723 | 1.07e-02 | 4.29e-02 | 19 |
| GO:00109066 | Thyroid | PTC | regulation of glucose metabolic process | 50/5968 | 119/18723 | 1.25e-02 | 4.88e-02 | 50 |
| GO:004603434 | Thyroid | ATC | ATP metabolic process | 167/6293 | 277/18723 | 5.60e-20 | 8.64e-18 | 167 |
| GO:000609134 | Thyroid | ATC | generation of precursor metabolites and energy | 256/6293 | 490/18723 | 6.55e-18 | 7.69e-16 | 256 |
| GO:001056334 | Thyroid | ATC | negative regulation of phosphorus metabolic process | 234/6293 | 442/18723 | 2.30e-17 | 2.31e-15 | 234 |
| GO:004593634 | Thyroid | ATC | negative regulation of phosphate metabolic process | 233/6293 | 441/18723 | 3.68e-17 | 3.47e-15 | 233 |
| GO:003465525 | Thyroid | ATC | nucleobase-containing compound catabolic process | 217/6293 | 407/18723 | 1.20e-16 | 1.04e-14 | 217 |
| GO:001598034 | Thyroid | ATC | energy derivation by oxidation of organic compounds | 177/6293 | 318/18723 | 3.60e-16 | 2.92e-14 | 177 |
| GO:000193333 | Thyroid | ATC | negative regulation of protein phosphorylation | 186/6293 | 342/18723 | 1.43e-15 | 1.08e-13 | 186 |
| GO:004232634 | Thyroid | ATC | negative regulation of phosphorylation | 203/6293 | 385/18723 | 5.30e-15 | 3.53e-13 | 203 |
| GO:004670024 | Thyroid | ATC | heterocycle catabolic process | 228/6293 | 445/18723 | 7.26e-15 | 4.50e-13 | 228 |
| GO:004427025 | Thyroid | ATC | cellular nitrogen compound catabolic process | 229/6293 | 451/18723 | 2.25e-14 | 1.27e-12 | 229 |
| GO:001604927 | Thyroid | ATC | cell growth | 241/6293 | 482/18723 | 4.27e-14 | 2.35e-12 | 241 |
| GO:001943924 | Thyroid | ATC | aromatic compound catabolic process | 232/6293 | 467/18723 | 3.05e-13 | 1.44e-11 | 232 |
| GO:000150332 | Thyroid | ATC | ossification | 206/6293 | 408/18723 | 9.23e-13 | 3.95e-11 | 206 |
| Page: 1 2 3 4 5 6 7 8 9 10 11 12 13 14 15 |
| Pathway ID | Tissue | Disease Stage | Description | Gene Ratio | Bg Ratio | pvalue | p.adjust | qvalue | Count |
| hsa01232 | Liver | Cirrhotic | Nucleotide metabolism | 39/2530 | 85/8465 | 1.27e-03 | 6.73e-03 | 4.15e-03 | 39 |
| hsa00770 | Liver | Cirrhotic | Pantothenate and CoA biosynthesis | 13/2530 | 21/8465 | 2.32e-03 | 9.90e-03 | 6.10e-03 | 13 |
| hsa00240 | Liver | Cirrhotic | Pyrimidine metabolism | 27/2530 | 58/8465 | 5.31e-03 | 1.88e-02 | 1.16e-02 | 27 |
| hsa012321 | Liver | Cirrhotic | Nucleotide metabolism | 39/2530 | 85/8465 | 1.27e-03 | 6.73e-03 | 4.15e-03 | 39 |
| hsa007701 | Liver | Cirrhotic | Pantothenate and CoA biosynthesis | 13/2530 | 21/8465 | 2.32e-03 | 9.90e-03 | 6.10e-03 | 13 |
| hsa002401 | Liver | Cirrhotic | Pyrimidine metabolism | 27/2530 | 58/8465 | 5.31e-03 | 1.88e-02 | 1.16e-02 | 27 |
| hsa002402 | Liver | HCC | Pyrimidine metabolism | 44/4020 | 58/8465 | 9.34e-06 | 7.11e-05 | 3.95e-05 | 44 |
| hsa012322 | Liver | HCC | Nucleotide metabolism | 59/4020 | 85/8465 | 3.30e-05 | 1.88e-04 | 1.04e-04 | 59 |
| hsa007702 | Liver | HCC | Pantothenate and CoA biosynthesis | 16/4020 | 21/8465 | 7.16e-03 | 1.97e-02 | 1.09e-02 | 16 |
| hsa002403 | Liver | HCC | Pyrimidine metabolism | 44/4020 | 58/8465 | 9.34e-06 | 7.11e-05 | 3.95e-05 | 44 |
| hsa012323 | Liver | HCC | Nucleotide metabolism | 59/4020 | 85/8465 | 3.30e-05 | 1.88e-04 | 1.04e-04 | 59 |
| hsa007703 | Liver | HCC | Pantothenate and CoA biosynthesis | 16/4020 | 21/8465 | 7.16e-03 | 1.97e-02 | 1.09e-02 | 16 |
| Page: 1 |
Top |
Cell-cell communication analysis |
| Identification of potential cell-cell interactions between two cell types and their ligand-receptor pairs for different disease states |
| Ligand | Receptor | LRpair | Pathway | Tissue | Disease Stage |
| Page: 1 |
Top |
Single-cell gene regulatory network inference analysis |
| Find out the significant the regulons (TFs) and the target genes of each regulon across cell types for different disease states |
| TF | Cell Type | Tissue | Disease Stage | Target Gene | RSS | Regulon Activity |
| ∗The dot plots of a searched regulon are shown for all cell subpopulations in each disease state of each tissue based on the regulon specific score inferred using pySCENIC and by calculating the average expression. |
| Page: 1 |
Top |
Somatic mutation of malignant transformation related genes |
| Annotation of somatic variants for genes involved in malignant transformation |
| Hugo Symbol | Variant Class | Variant Classification | dbSNP RS | HGVSc | HGVSp | HGVSp Short | SWISSPROT | BIOTYPE | SIFT | PolyPhen | Tumor Sample Barcode | Tissue | Histology | Sex | Age | Stage | Therapy Types | Drugs | Outcome |
| ENPP1 | SNV | Missense_Mutation | c.2351N>G | p.Tyr784Cys | p.Y784C | P22413 | protein_coding | deleterious(0) | probably_damaging(0.992) | TCGA-A2-A25B-01 | Breast | breast invasive carcinoma | Female | <65 | I/II | Chemotherapy | taxotere | PD | |
| ENPP1 | SNV | Missense_Mutation | c.1603C>A | p.His535Asn | p.H535N | P22413 | protein_coding | deleterious(0) | probably_damaging(1) | TCGA-AC-A23H-01 | Breast | breast invasive carcinoma | Female | >=65 | I/II | Unknown | Unknown | PD | |
| ENPP1 | SNV | Missense_Mutation | c.2471N>C | p.Glu824Ala | p.E824A | P22413 | protein_coding | tolerated(0.26) | benign(0.115) | TCGA-AO-A03T-01 | Breast | breast invasive carcinoma | Female | <65 | I/II | Chemotherapy | cyclophosphamide | SD | |
| ENPP1 | SNV | Missense_Mutation | c.2533N>T | p.Pro845Ser | p.P845S | P22413 | protein_coding | deleterious(0.01) | probably_damaging(0.934) | TCGA-BH-A0BR-01 | Breast | breast invasive carcinoma | Female | <65 | I/II | Unknown | Unknown | SD | |
| ENPP1 | SNV | Missense_Mutation | rs750660271 | c.1699N>G | p.Ile567Val | p.I567V | P22413 | protein_coding | deleterious(0.04) | probably_damaging(0.967) | TCGA-D8-A1XK-01 | Breast | breast invasive carcinoma | Female | <65 | I/II | Chemotherapy | doxorubicine+cyclophosphamide | SD |
| ENPP1 | SNV | Missense_Mutation | novel | c.547G>C | p.Val183Leu | p.V183L | P22413 | protein_coding | tolerated(0.11) | possibly_damaging(0.457) | TCGA-EW-A3U0-01 | Breast | breast invasive carcinoma | Female | <65 | III/IV | Chemotherapy | cisplatin | CR |
| ENPP1 | SNV | Missense_Mutation | rs373044722 | c.1441C>T | p.Arg481Trp | p.R481W | P22413 | protein_coding | deleterious(0) | probably_damaging(0.954) | TCGA-2W-A8YY-01 | Cervix | cervical & endocervical cancer | Female | <65 | I/II | Chemotherapy | cisplatin | CR |
| ENPP1 | SNV | Missense_Mutation | rs202179867 | c.2531C>T | p.Thr844Met | p.T844M | P22413 | protein_coding | deleterious(0) | possibly_damaging(0.87) | TCGA-2W-A8YY-01 | Cervix | cervical & endocervical cancer | Female | <65 | I/II | Chemotherapy | cisplatin | CR |
| ENPP1 | SNV | Missense_Mutation | c.2488N>T | p.His830Tyr | p.H830Y | P22413 | protein_coding | deleterious(0) | probably_damaging(1) | TCGA-EK-A3GK-01 | Cervix | cervical & endocervical cancer | Female | <65 | I/II | Unknown | Unknown | SD | |
| ENPP1 | SNV | Missense_Mutation | c.355N>G | p.Asn119Asp | p.N119D | P22413 | protein_coding | tolerated(0.49) | benign(0.085) | TCGA-IR-A3LF-01 | Cervix | cervical & endocervical cancer | Female | <65 | I/II | Unknown | Unknown | SD |
| Page: 1 2 3 4 5 6 7 8 9 10 11 12 |
Top |
Related drugs of malignant transformation related genes |
| Identification of chemicals and drugs interact with genes involved in malignant transfromation |
| (DGIdb 4.0) |
| Entrez ID | Symbol | Category | Interaction Types | Drug Claim Name | Drug Name | PMIDs |
| Page: 1 |

Copyright 2023-Present -The University of Texas Health Science Center at Houston |