
|
|||||
|
 | |
| |
| |
| |
| |
| |
|
Gene: CXCR4 |
Gene summary for CXCR4 |
| Gene information | Species | Human | Gene symbol | CXCR4 | Gene ID | 7852 |
| Gene name | C-X-C motif chemokine receptor 4 | |
| Gene Alias | CD184 | |
| Cytomap | 2q22.1 | |
| Gene Type | protein-coding | GO ID | GO:0000902 | UniProtAcc | P61073 |
Top |
Malignant transformation analysis |
| Identification of the aberrant gene expression in precancerous and cancerous lesions by comparing the gene expression of stem-like cells in diseased tissues with normal stem cells |
| Entrez ID | Symbol | Replicates | Species | Organ | Tissue | Adj P-value | Log2FC | Malignancy |
| 7852 | CXCR4 | GSM4909281 | Human | Breast | IDC | 4.58e-04 | -2.68e-01 | 0.21 |
| 7852 | CXCR4 | GSM4909285 | Human | Breast | IDC | 1.40e-03 | 3.15e-01 | 0.21 |
| 7852 | CXCR4 | GSM4909286 | Human | Breast | IDC | 1.81e-17 | -3.54e-01 | 0.1081 |
| 7852 | CXCR4 | GSM4909294 | Human | Breast | IDC | 1.87e-02 | -2.09e-01 | 0.2022 |
| 7852 | CXCR4 | GSM4909296 | Human | Breast | IDC | 2.95e-08 | -3.02e-01 | 0.1524 |
| 7852 | CXCR4 | GSM4909301 | Human | Breast | IDC | 4.04e-12 | -3.28e-01 | 0.1577 |
| 7852 | CXCR4 | GSM4909302 | Human | Breast | IDC | 9.10e-04 | -1.26e-01 | 0.1545 |
| 7852 | CXCR4 | GSM4909304 | Human | Breast | IDC | 8.45e-05 | -3.16e-01 | 0.1636 |
| 7852 | CXCR4 | GSM4909307 | Human | Breast | IDC | 7.36e-06 | -2.78e-01 | 0.1569 |
| 7852 | CXCR4 | GSM4909308 | Human | Breast | IDC | 3.04e-04 | -2.56e-01 | 0.158 |
| 7852 | CXCR4 | GSM4909311 | Human | Breast | IDC | 2.91e-15 | -3.45e-01 | 0.1534 |
| 7852 | CXCR4 | GSM4909312 | Human | Breast | IDC | 3.09e-05 | -2.78e-01 | 0.1552 |
| 7852 | CXCR4 | GSM4909319 | Human | Breast | IDC | 1.57e-14 | -3.15e-01 | 0.1563 |
| 7852 | CXCR4 | GSM4909320 | Human | Breast | IDC | 1.80e-02 | -3.10e-01 | 0.1575 |
| 7852 | CXCR4 | GSM4909321 | Human | Breast | IDC | 1.89e-15 | -3.46e-01 | 0.1559 |
| 7852 | CXCR4 | ctrl6 | Human | Breast | Precancer | 2.49e-08 | 6.91e-01 | -0.0061 |
| 7852 | CXCR4 | brca1 | Human | Breast | Precancer | 4.85e-07 | -3.05e-01 | -0.0338 |
| 7852 | CXCR4 | brca2 | Human | Breast | Precancer | 4.52e-03 | -2.65e-01 | -0.024 |
| 7852 | CXCR4 | brca10 | Human | Breast | Precancer | 3.83e-07 | 5.25e-01 | -0.0029 |
| 7852 | CXCR4 | NCCBC14 | Human | Breast | DCIS | 9.24e-11 | -7.85e-02 | 0.2021 |
| Page: 1 2 3 4 |
| Tissue | Expression Dynamics | Abbreviation |
| Breast | 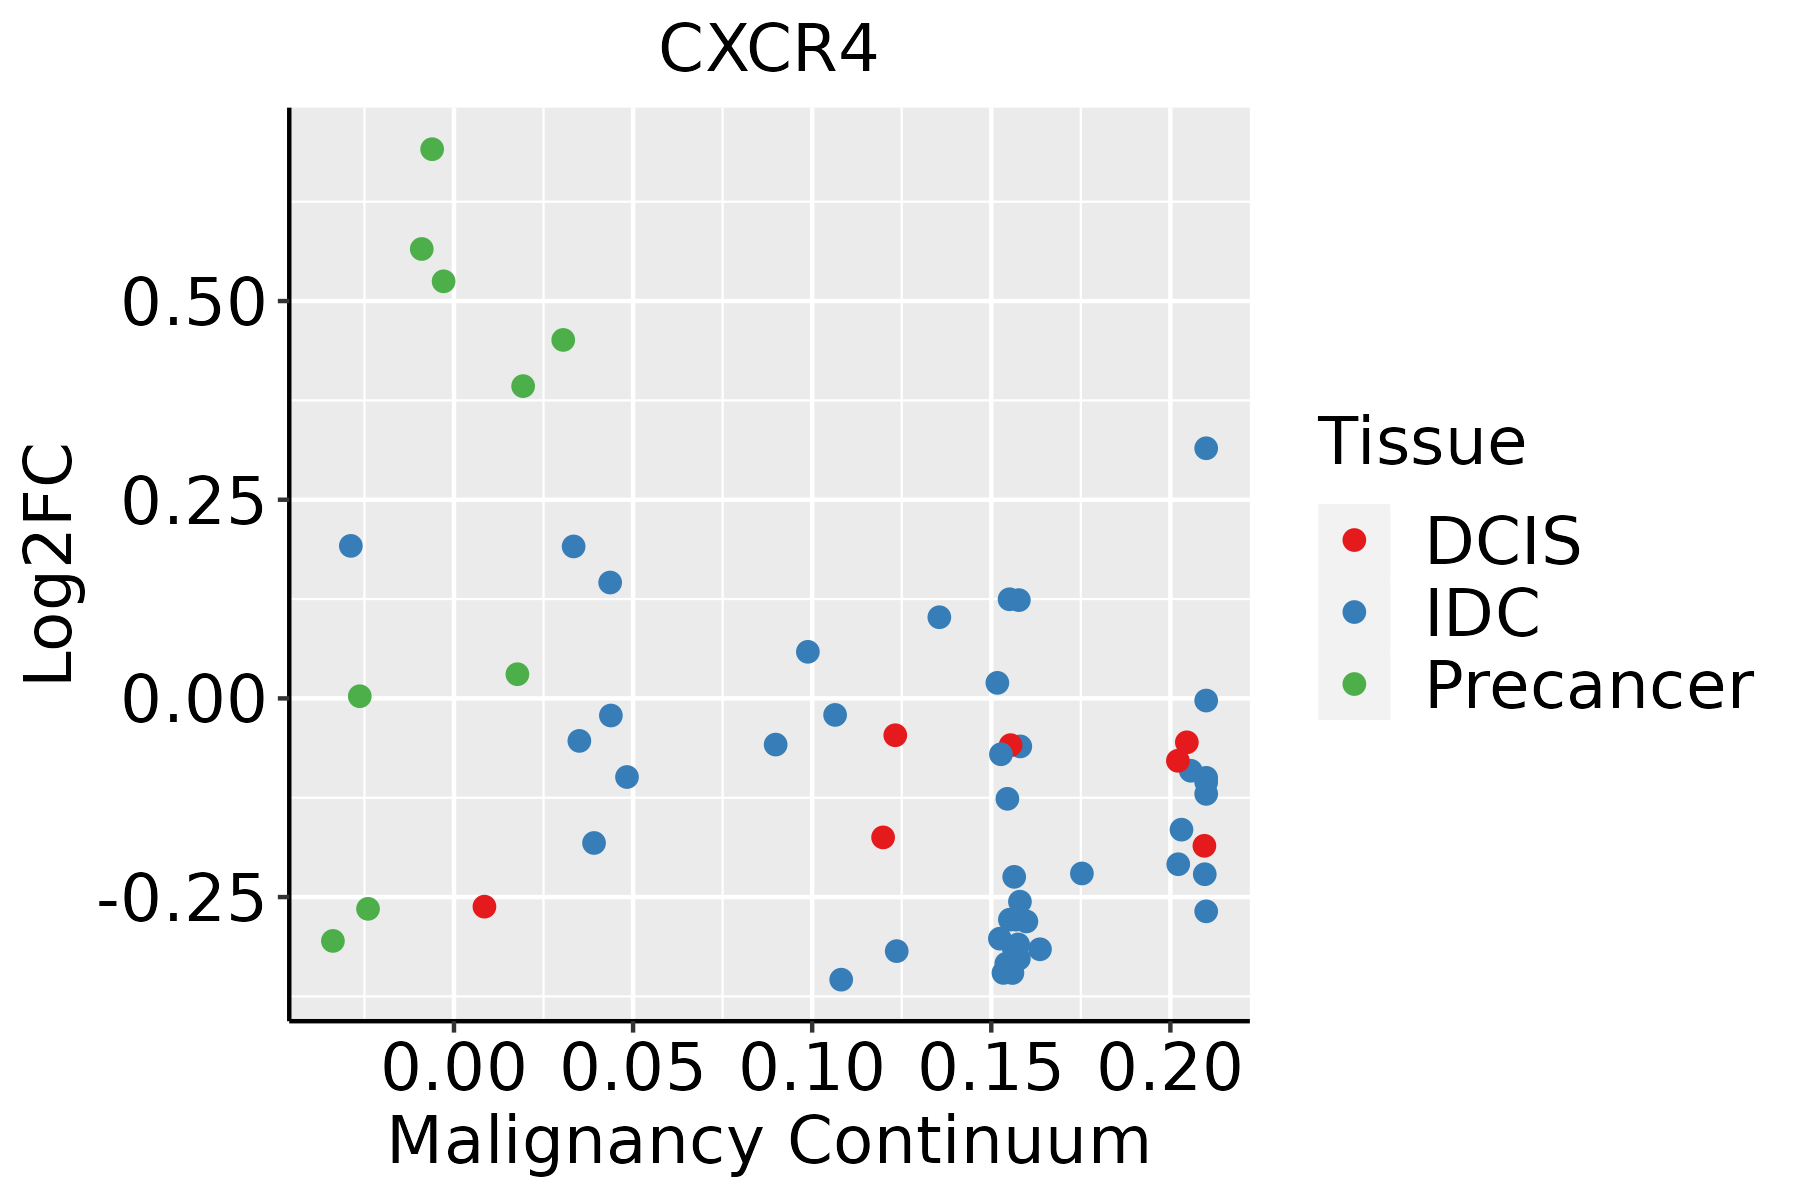 | IDC: Invasive ductal carcinoma |
| DCIS: Ductal carcinoma in situ | ||
| Precancer(BRCA1-mut): Precancerous lesion from BRCA1 mutation carriers | ||
| Esophagus | 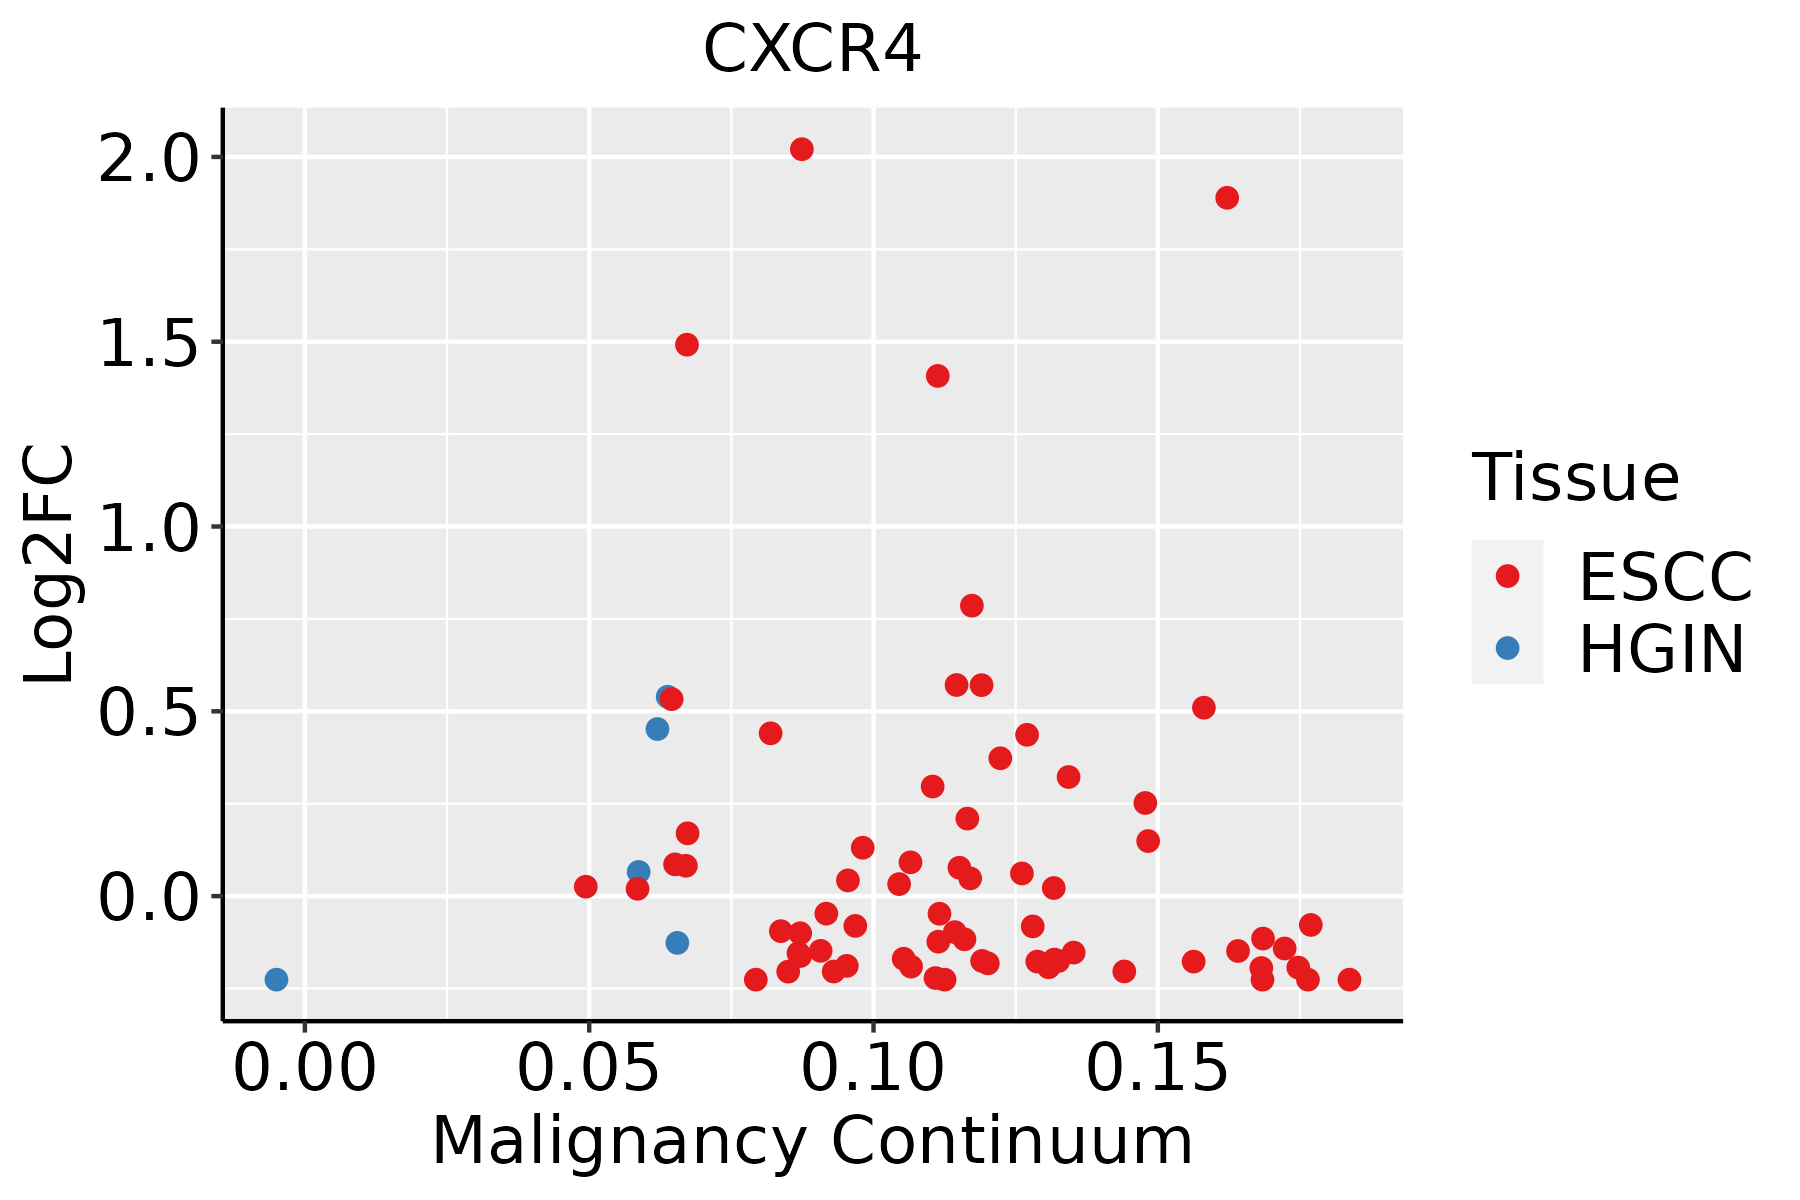 | ESCC: Esophageal squamous cell carcinoma |
| HGIN: High-grade intraepithelial neoplasias | ||
| LGIN: Low-grade intraepithelial neoplasias | ||
| Oral Cavity | 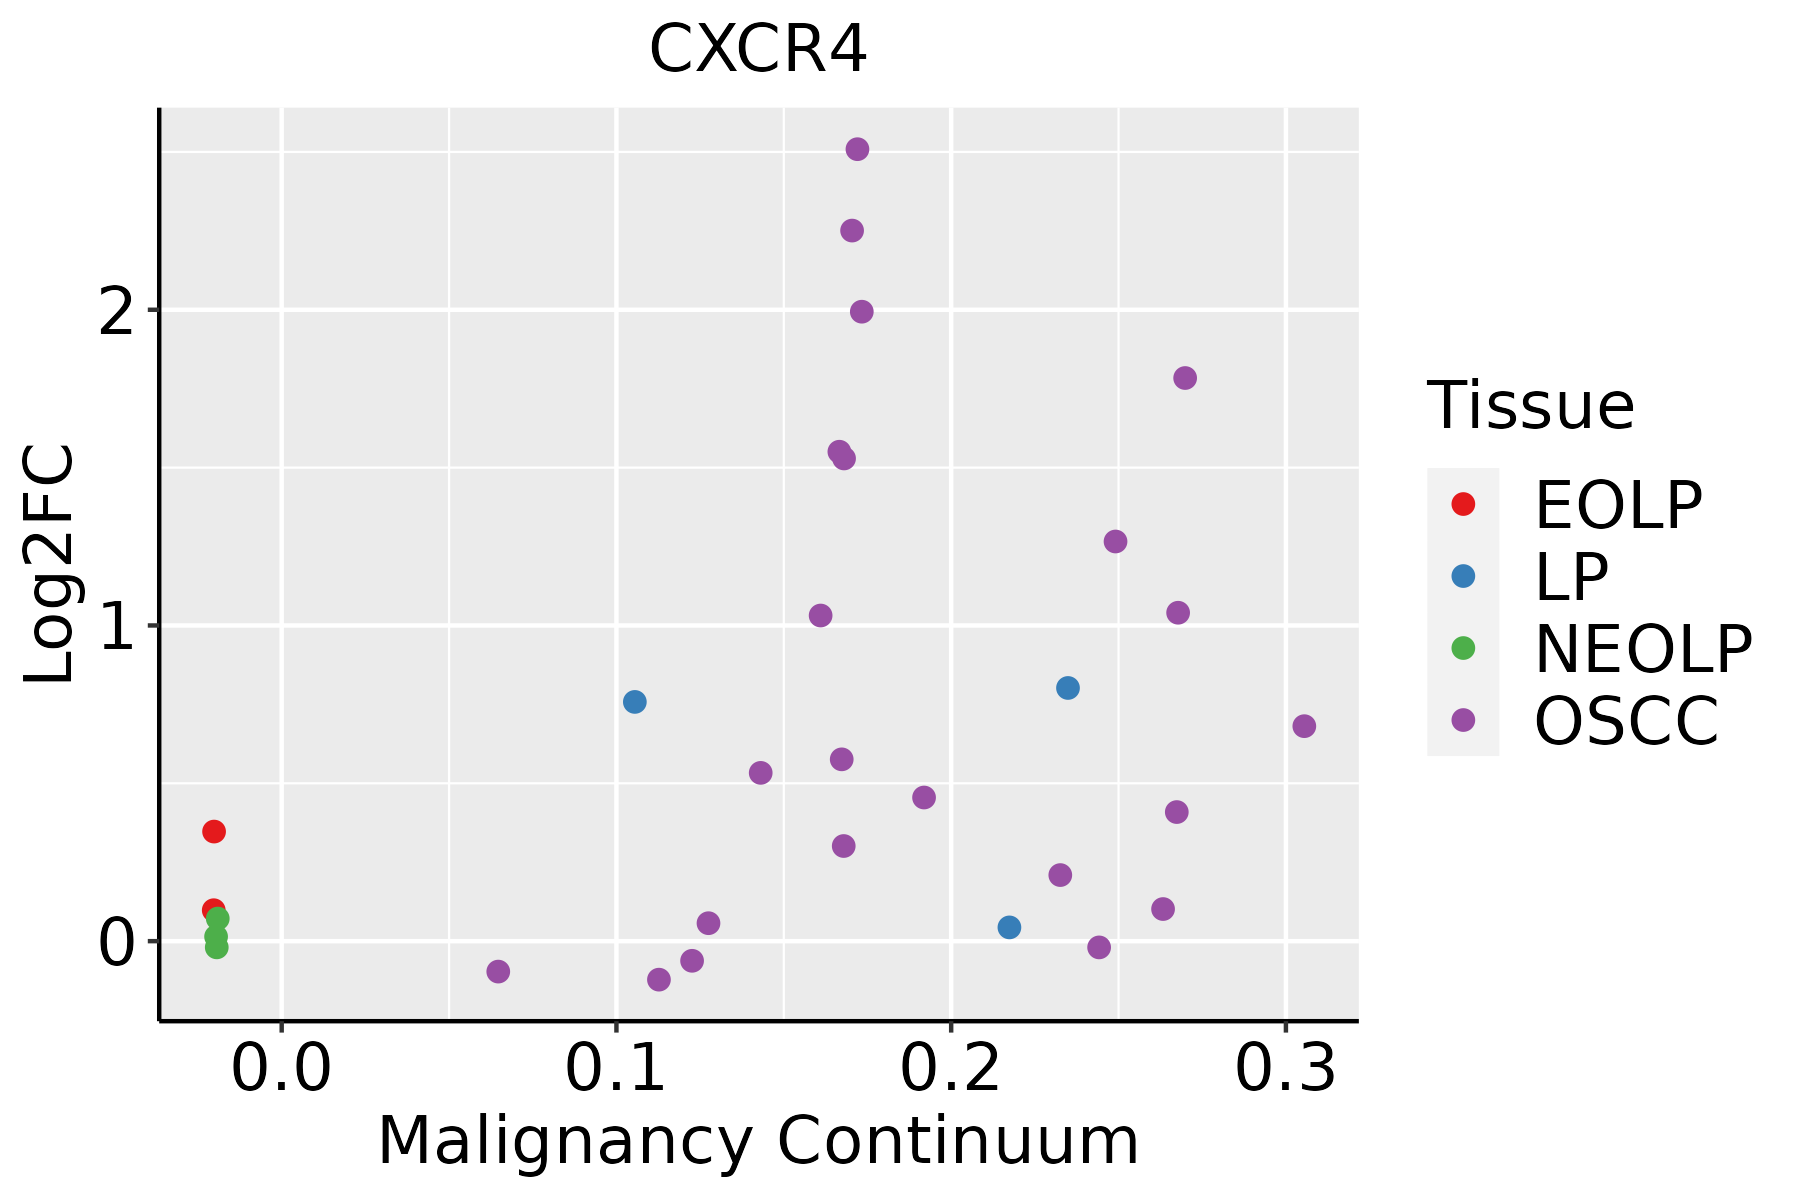 | EOLP: Erosive Oral lichen planus |
| LP: leukoplakia | ||
| NEOLP: Non-erosive oral lichen planus | ||
| OSCC: Oral squamous cell carcinoma | ||
| Prostate | 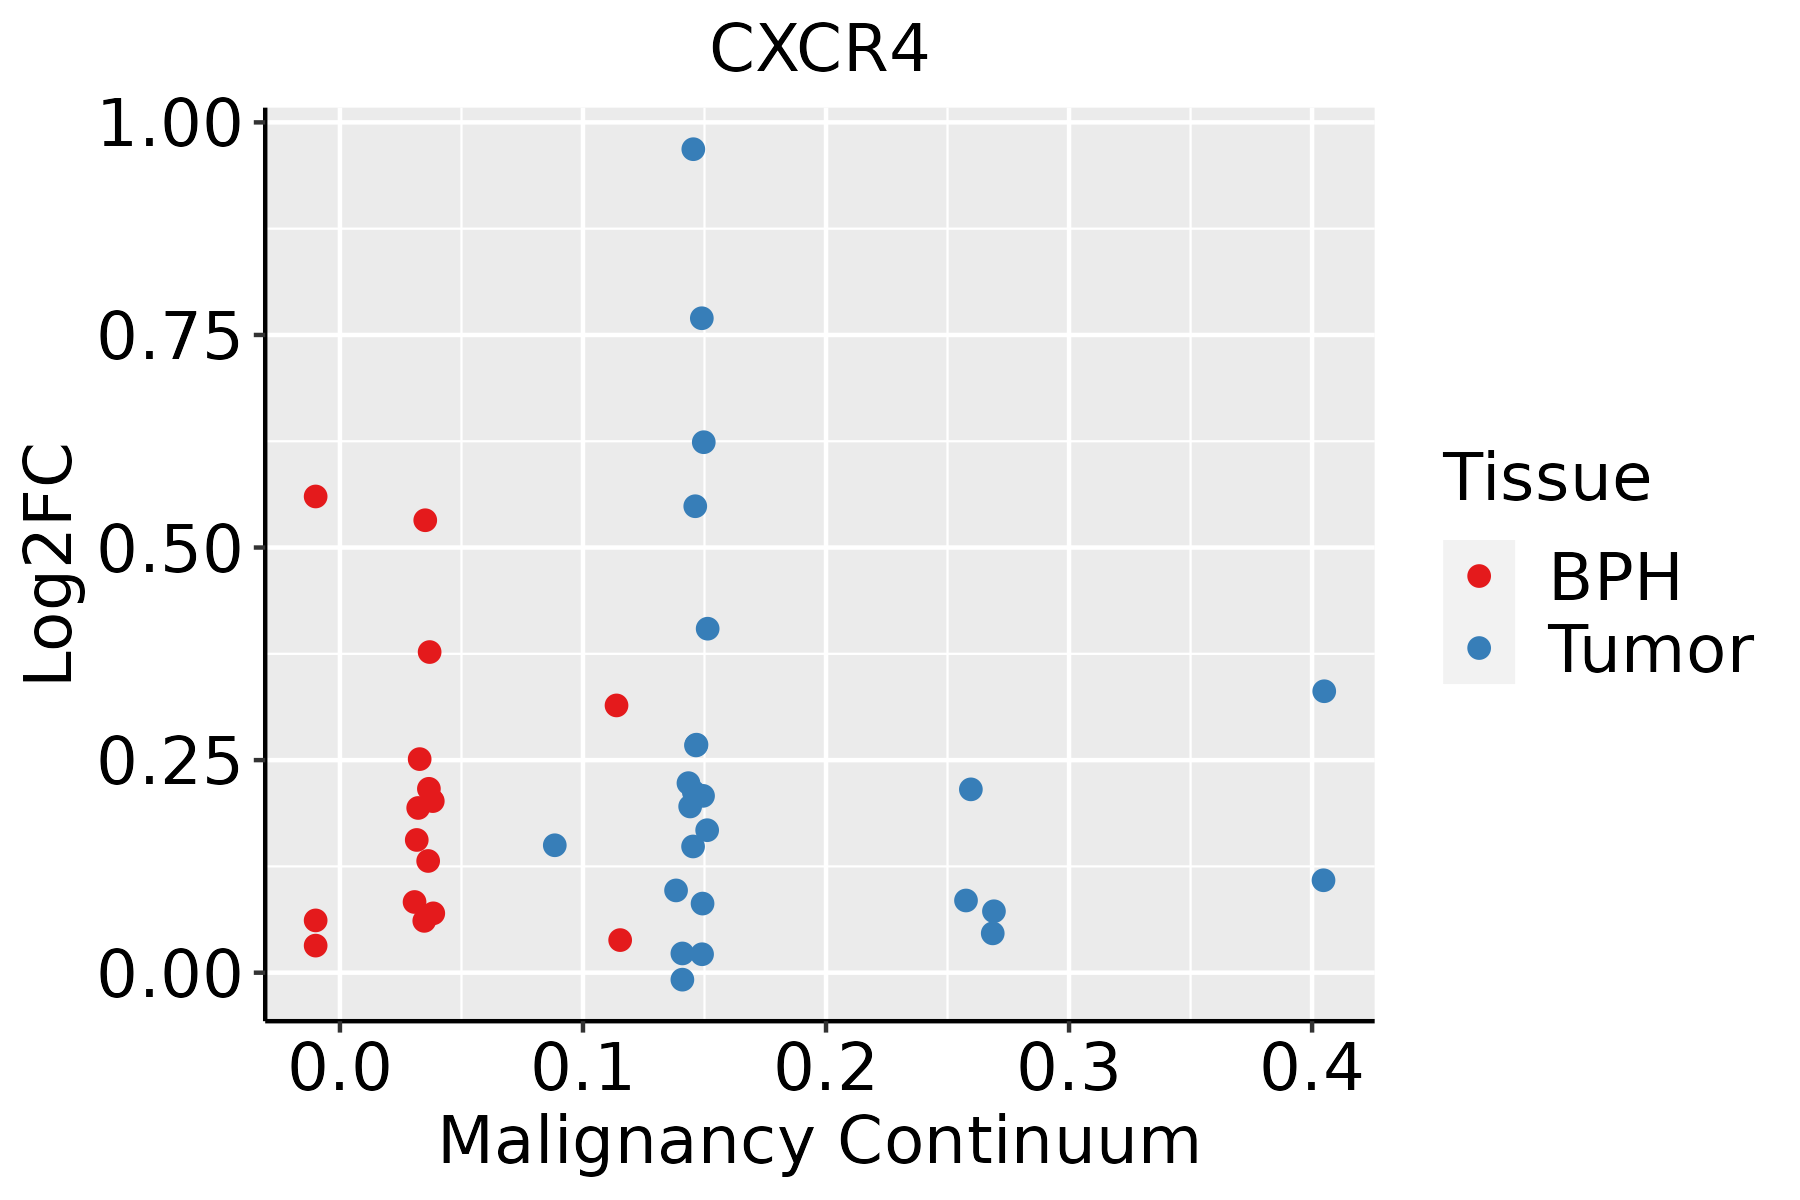 | BPH: Benign Prostatic Hyperplasia |
| Thyroid | 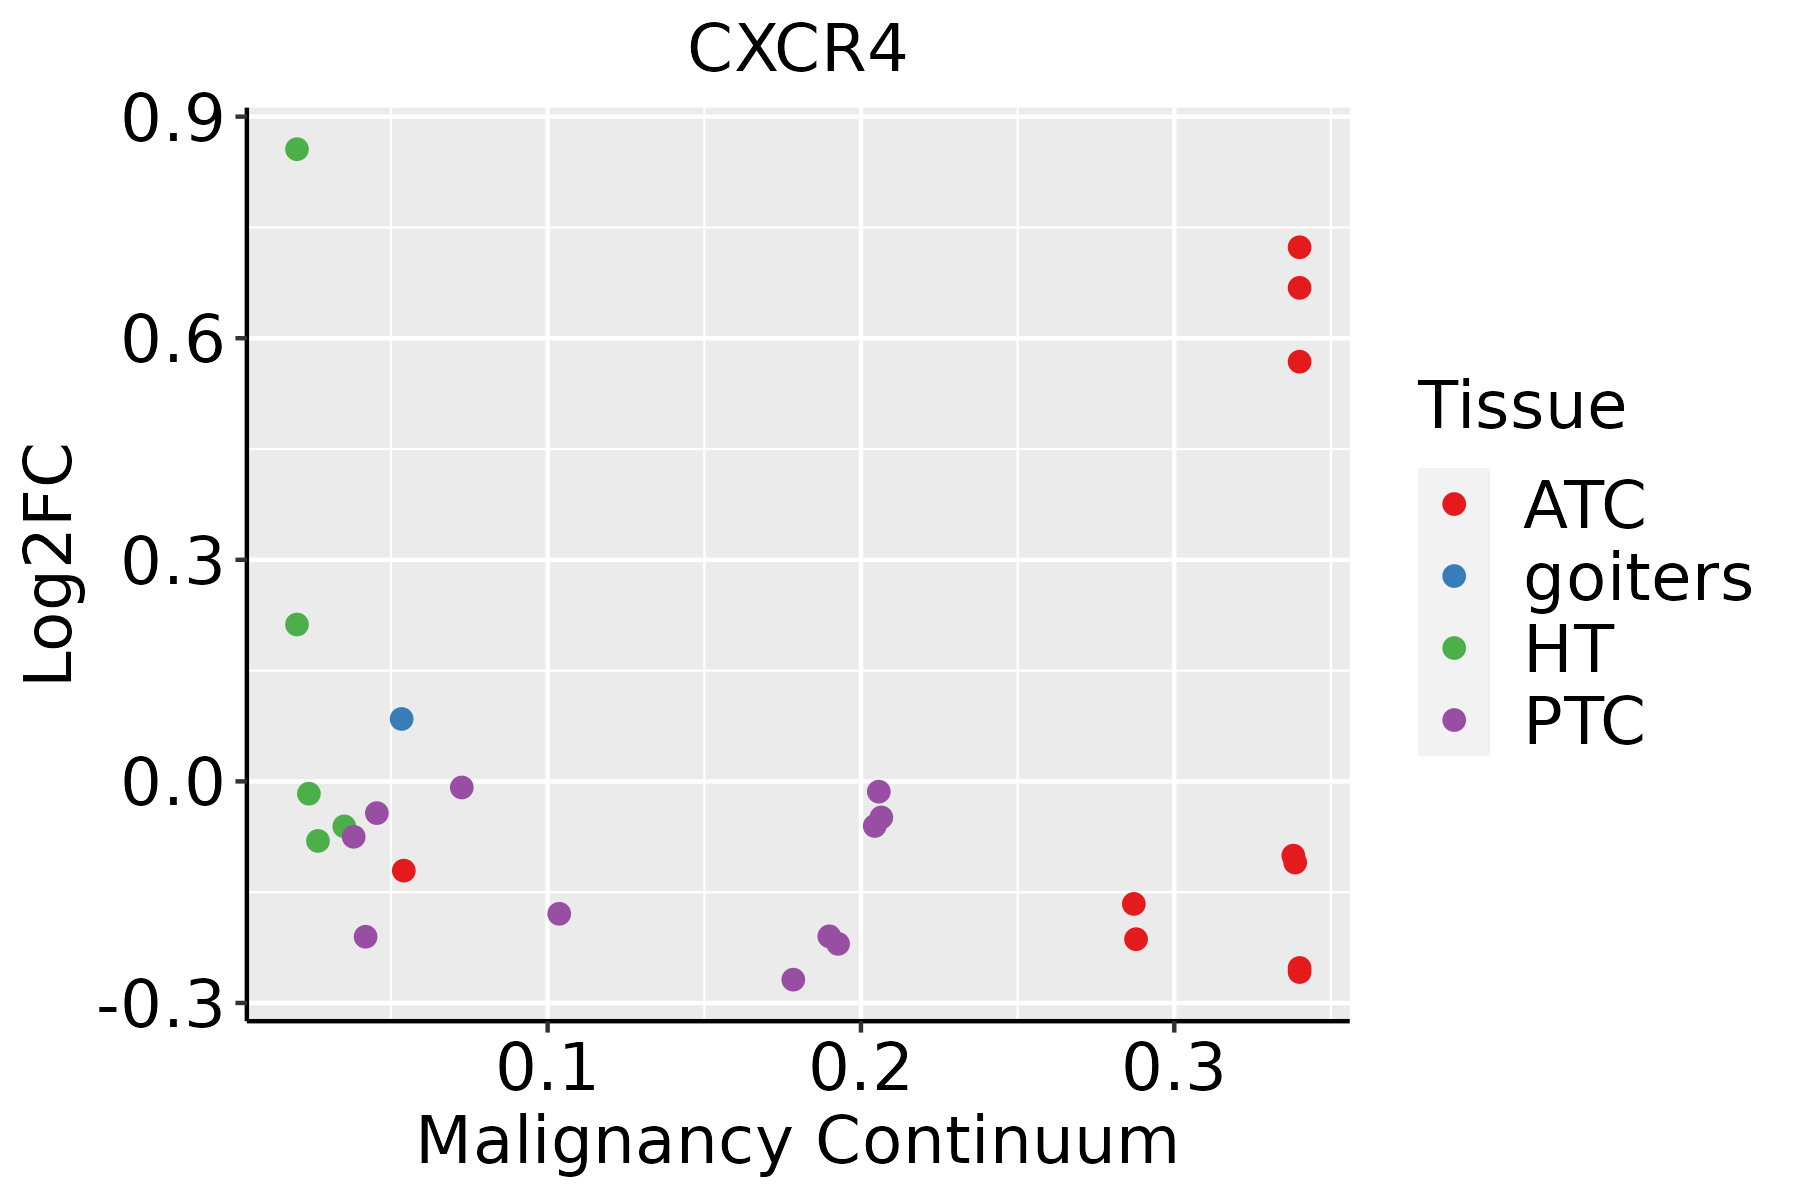 | ATC: Anaplastic thyroid cancer |
| HT: Hashimoto's thyroiditis | ||
| PTC: Papillary thyroid cancer |
| ∗log2FC in expression of this searched gene in stem-like cells from each diseased tissue sample relative to stem-like cells in normal samples in each tissue plotted against the malignancy continuum. Samples are colored based on if they are from different disease stage. |
Top |
Malignant transformation related pathway analysis |
| Find out the enriched GO biological processes and KEGG pathways involved in transition from healthy to precancer to cancer |
| Tissue | Disease Stage | Enriched GO biological Processes |
| Colorectum | AD |  |
| Colorectum | SER |  |
| Colorectum | MSS |  |
| Colorectum | MSI-H |  |
| Colorectum | FAP |  |
| ∗Top 15 enriched GO BP terms are showed in the bar plot of each disease state in each tissue. Each row represents a significant GO biological process which is colored according to the -log10(p.adjust). |
| Page: 1 2 3 4 5 6 7 8 9 |
| GO ID | Tissue | Disease Stage | Description | Gene Ratio | Bg Ratio | pvalue | p.adjust | Count |
| GO:000961215 | Oral cavity | LP | response to mechanical stimulus | 81/4623 | 216/18723 | 1.80e-05 | 3.09e-04 | 81 |
| GO:0001666110 | Oral cavity | LP | response to hypoxia | 106/4623 | 307/18723 | 6.38e-05 | 8.61e-04 | 106 |
| GO:0042060110 | Oral cavity | LP | wound healing | 139/4623 | 422/18723 | 7.10e-05 | 9.48e-04 | 139 |
| GO:004206313 | Oral cavity | LP | gliogenesis | 104/4623 | 301/18723 | 7.21e-05 | 9.49e-04 | 104 |
| GO:000195911 | Oral cavity | LP | regulation of cytokine-mediated signaling pathway | 58/4623 | 150/18723 | 1.00e-04 | 1.24e-03 | 58 |
| GO:001604918 | Oral cavity | LP | cell growth | 155/4623 | 482/18723 | 1.08e-04 | 1.31e-03 | 155 |
| GO:0036293110 | Oral cavity | LP | response to decreased oxygen levels | 109/4623 | 322/18723 | 1.25e-04 | 1.46e-03 | 109 |
| GO:006075911 | Oral cavity | LP | regulation of response to cytokine stimulus | 61/4623 | 162/18723 | 1.61e-04 | 1.81e-03 | 61 |
| GO:000155817 | Oral cavity | LP | regulation of cell growth | 134/4623 | 414/18723 | 2.25e-04 | 2.41e-03 | 134 |
| GO:000926617 | Oral cavity | LP | response to temperature stimulus | 65/4623 | 178/18723 | 2.78e-04 | 2.88e-03 | 65 |
| GO:001000111 | Oral cavity | LP | glial cell differentiation | 78/4623 | 225/18723 | 4.82e-04 | 4.52e-03 | 78 |
| GO:0022604110 | Oral cavity | LP | regulation of cell morphogenesis | 101/4623 | 309/18723 | 8.65e-04 | 7.50e-03 | 101 |
| GO:000196111 | Oral cavity | LP | positive regulation of cytokine-mediated signaling pathway | 22/4623 | 50/18723 | 2.18e-03 | 1.58e-02 | 22 |
| GO:000941019 | Oral cavity | LP | response to xenobiotic stimulus | 141/4623 | 462/18723 | 2.33e-03 | 1.68e-02 | 141 |
| GO:006076011 | Oral cavity | LP | positive regulation of response to cytokine stimulus | 24/4623 | 57/18723 | 2.88e-03 | 2.00e-02 | 24 |
| GO:00487091 | Oral cavity | LP | oligodendrocyte differentiation | 35/4623 | 95/18723 | 5.53e-03 | 3.34e-02 | 35 |
| GO:001072014 | Oral cavity | LP | positive regulation of cell development | 93/4623 | 298/18723 | 6.07e-03 | 3.60e-02 | 93 |
| GO:004206026 | Oral cavity | EOLP | wound healing | 99/2218 | 422/18723 | 1.18e-11 | 1.85e-09 | 99 |
| GO:00607592 | Oral cavity | EOLP | regulation of response to cytokine stimulus | 49/2218 | 162/18723 | 2.70e-10 | 2.45e-08 | 49 |
| GO:001603226 | Oral cavity | EOLP | viral process | 94/2218 | 415/18723 | 2.93e-10 | 2.58e-08 | 94 |
| Page: 1 2 3 4 5 6 7 8 9 10 11 12 13 14 15 16 17 18 19 20 21 22 23 24 25 26 27 28 29 |
| Pathway ID | Tissue | Disease Stage | Description | Gene Ratio | Bg Ratio | pvalue | p.adjust | qvalue | Count |
| hsa0467018 | Breast | Precancer | Leukocyte transendothelial migration | 20/684 | 114/8465 | 7.26e-04 | 5.33e-03 | 4.09e-03 | 20 |
| hsa0516316 | Breast | Precancer | Human cytomegalovirus infection | 32/684 | 225/8465 | 1.13e-03 | 7.57e-03 | 5.80e-03 | 32 |
| hsa0467019 | Breast | Precancer | Leukocyte transendothelial migration | 20/684 | 114/8465 | 7.26e-04 | 5.33e-03 | 4.09e-03 | 20 |
| hsa0516317 | Breast | Precancer | Human cytomegalovirus infection | 32/684 | 225/8465 | 1.13e-03 | 7.57e-03 | 5.80e-03 | 32 |
| hsa0516324 | Breast | IDC | Human cytomegalovirus infection | 39/867 | 225/8465 | 6.66e-04 | 5.41e-03 | 4.05e-03 | 39 |
| hsa0467024 | Breast | IDC | Leukocyte transendothelial migration | 21/867 | 114/8465 | 5.41e-03 | 3.13e-02 | 2.34e-02 | 21 |
| hsa0481014 | Breast | IDC | Regulation of actin cytoskeleton | 36/867 | 229/8465 | 5.79e-03 | 3.13e-02 | 2.34e-02 | 36 |
| hsa0517014 | Breast | IDC | Human immunodeficiency virus 1 infection | 33/867 | 212/8465 | 9.28e-03 | 4.37e-02 | 3.27e-02 | 33 |
| hsa0516334 | Breast | IDC | Human cytomegalovirus infection | 39/867 | 225/8465 | 6.66e-04 | 5.41e-03 | 4.05e-03 | 39 |
| hsa0467034 | Breast | IDC | Leukocyte transendothelial migration | 21/867 | 114/8465 | 5.41e-03 | 3.13e-02 | 2.34e-02 | 21 |
| hsa0481015 | Breast | IDC | Regulation of actin cytoskeleton | 36/867 | 229/8465 | 5.79e-03 | 3.13e-02 | 2.34e-02 | 36 |
| hsa0517015 | Breast | IDC | Human immunodeficiency virus 1 infection | 33/867 | 212/8465 | 9.28e-03 | 4.37e-02 | 3.27e-02 | 33 |
| hsa0516344 | Breast | DCIS | Human cytomegalovirus infection | 38/846 | 225/8465 | 8.11e-04 | 5.95e-03 | 4.38e-03 | 38 |
| hsa0467044 | Breast | DCIS | Leukocyte transendothelial migration | 21/846 | 114/8465 | 4.07e-03 | 2.31e-02 | 1.70e-02 | 21 |
| hsa0517024 | Breast | DCIS | Human immunodeficiency virus 1 infection | 33/846 | 212/8465 | 6.49e-03 | 3.22e-02 | 2.37e-02 | 33 |
| hsa0481023 | Breast | DCIS | Regulation of actin cytoskeleton | 35/846 | 229/8465 | 6.89e-03 | 3.37e-02 | 2.48e-02 | 35 |
| hsa0414416 | Breast | DCIS | Endocytosis | 37/846 | 251/8465 | 9.92e-03 | 4.40e-02 | 3.24e-02 | 37 |
| hsa0516354 | Breast | DCIS | Human cytomegalovirus infection | 38/846 | 225/8465 | 8.11e-04 | 5.95e-03 | 4.38e-03 | 38 |
| hsa0467054 | Breast | DCIS | Leukocyte transendothelial migration | 21/846 | 114/8465 | 4.07e-03 | 2.31e-02 | 1.70e-02 | 21 |
| hsa0517034 | Breast | DCIS | Human immunodeficiency virus 1 infection | 33/846 | 212/8465 | 6.49e-03 | 3.22e-02 | 2.37e-02 | 33 |
| Page: 1 2 3 4 5 |
Top |
Cell-cell communication analysis |
| Identification of potential cell-cell interactions between two cell types and their ligand-receptor pairs for different disease states |
| Ligand | Receptor | LRpair | Pathway | Tissue | Disease Stage |
| MIF | CD74_CXCR4 | MIF_CD74_CXCR4 | MIF | Breast | ADJ |
| CXCL12 | CXCR4 | CXCL12_CXCR4 | CXCL | Breast | ADJ |
| MIF | CD74_CXCR4 | MIF_CD74_CXCR4 | MIF | Breast | DCIS |
| CXCL12 | CXCR4 | CXCL12_CXCR4 | CXCL | Breast | DCIS |
| MIF | CD74_CXCR4 | MIF_CD74_CXCR4 | MIF | Breast | Healthy |
| CXCL12 | CXCR4 | CXCL12_CXCR4 | CXCL | Breast | Healthy |
| MIF | CD74_CXCR4 | MIF_CD74_CXCR4 | MIF | Breast | IDC |
| CXCL12 | CXCR4 | CXCL12_CXCR4 | CXCL | Breast | IDC |
| MIF | CD74_CXCR4 | MIF_CD74_CXCR4 | MIF | Breast | Precancer |
| CXCL12 | CXCR4 | CXCL12_CXCR4 | CXCL | Breast | Precancer |
| CXCL12 | CXCR4 | CXCL12_CXCR4 | CXCL | Cervix | ADJ |
| MIF | CD74_CXCR4 | MIF_CD74_CXCR4 | MIF | Cervix | ADJ |
| MIF | CD74_CXCR4 | MIF_CD74_CXCR4 | MIF | Cervix | CC |
| CXCL12 | CXCR4 | CXCL12_CXCR4 | CXCL | Cervix | CC |
| MIF | CD74_CXCR4 | MIF_CD74_CXCR4 | MIF | Cervix | Healthy |
| CXCL12 | CXCR4 | CXCL12_CXCR4 | CXCL | Cervix | Healthy |
| MIF | CD74_CXCR4 | MIF_CD74_CXCR4 | MIF | Cervix | Precancer |
| CXCL12 | CXCR4 | CXCL12_CXCR4 | CXCL | Cervix | Precancer |
| CXCL12 | CXCR4 | CXCL12_CXCR4 | CXCL | CRC | AD |
| CXCL12 | CXCR4 | CXCL12_CXCR4 | CXCL | CRC | ADJ |
| Page: 1 |
Top |
Single-cell gene regulatory network inference analysis |
| Find out the significant the regulons (TFs) and the target genes of each regulon across cell types for different disease states |
| TF | Cell Type | Tissue | Disease Stage | Target Gene | RSS | Regulon Activity |
| ∗The dot plots of a searched regulon are shown for all cell subpopulations in each disease state of each tissue based on the regulon specific score inferred using pySCENIC and by calculating the average expression. |
| Page: 1 |
Top |
Somatic mutation of malignant transformation related genes |
| Annotation of somatic variants for genes involved in malignant transformation |
| Hugo Symbol | Variant Class | Variant Classification | dbSNP RS | HGVSc | HGVSp | HGVSp Short | SWISSPROT | BIOTYPE | SIFT | PolyPhen | Tumor Sample Barcode | Tissue | Histology | Sex | Age | Stage | Therapy Types | Drugs | Outcome |
| CXCR4 | SNV | Missense_Mutation | c.385N>T | p.Leu129Phe | p.L129F | P61073 | protein_coding | tolerated(0.12) | probably_damaging(1) | TCGA-A8-A09Z-01 | Breast | breast invasive carcinoma | Female | >=65 | I/II | Unknown | Unknown | SD | |
| CXCR4 | SNV | Missense_Mutation | novel | c.616N>A | p.Gln206Lys | p.Q206K | P61073 | protein_coding | tolerated(1) | possibly_damaging(0.664) | TCGA-AN-A046-01 | Breast | breast invasive carcinoma | Female | >=65 | I/II | Unknown | Unknown | SD |
| CXCR4 | SNV | Missense_Mutation | c.444N>A | p.Ser148Arg | p.S148R | P61073 | protein_coding | deleterious(0) | probably_damaging(0.997) | TCGA-D8-A1XK-01 | Breast | breast invasive carcinoma | Female | <65 | I/II | Chemotherapy | doxorubicine+cyclophosphamide | SD | |
| CXCR4 | SNV | Missense_Mutation | novel | c.1031T>G | p.Val344Gly | p.V344G | P61073 | protein_coding | tolerated(0.12) | probably_damaging(0.997) | TCGA-2W-A8YY-01 | Cervix | cervical & endocervical cancer | Female | <65 | I/II | Chemotherapy | cisplatin | CR |
| CXCR4 | SNV | Missense_Mutation | c.52N>A | p.Glu18Lys | p.E18K | P61073 | protein_coding | tolerated(0.21) | benign(0.084) | TCGA-EA-A3HT-01 | Cervix | cervical & endocervical cancer | Female | >=65 | I/II | Unknown | Unknown | SD | |
| CXCR4 | SNV | Missense_Mutation | c.565N>G | p.Ile189Val | p.I189V | P61073 | protein_coding | tolerated(1) | benign(0.001) | TCGA-EA-A439-01 | Cervix | cervical & endocervical cancer | Female | <65 | I/II | Unknown | Unknown | PD | |
| CXCR4 | SNV | Missense_Mutation | c.350A>G | p.His117Arg | p.H117R | P61073 | protein_coding | deleterious(0.01) | probably_damaging(0.942) | TCGA-AA-3663-01 | Colorectum | colon adenocarcinoma | Male | <65 | I/II | Unknown | Unknown | SD | |
| CXCR4 | SNV | Missense_Mutation | c.553N>A | p.Asp185Asn | p.D185N | P61073 | protein_coding | tolerated(0.58) | benign(0) | TCGA-AA-3831-01 | Colorectum | colon adenocarcinoma | Male | >=65 | I/II | Unknown | Unknown | SD | |
| CXCR4 | SNV | Missense_Mutation | novel | c.715C>T | p.Arg239Cys | p.R239C | P61073 | protein_coding | deleterious(0.02) | probably_damaging(0.997) | TCGA-AA-3949-01 | Colorectum | colon adenocarcinoma | Female | >=65 | III/IV | Unknown | Unknown | SD |
| CXCR4 | SNV | Missense_Mutation | c.997N>A | p.Leu333Ile | p.L333I | P61073 | protein_coding | deleterious(0.02) | possibly_damaging(0.875) | TCGA-AZ-6598-01 | Colorectum | colon adenocarcinoma | Female | >=65 | I/II | Unknown | Unknown | SD |
| Page: 1 2 3 4 |
Top |
Related drugs of malignant transformation related genes |
| Identification of chemicals and drugs interact with genes involved in malignant transfromation |
| (DGIdb 4.0) |
| Entrez ID | Symbol | Category | Interaction Types | Drug Claim Name | Drug Name | PMIDs |
| 7852 | CXCR4 | DRUG RESISTANCE, CLINICALLY ACTIONABLE, G PROTEIN COUPLED RECEPTOR, EXTERNAL SIDE OF PLASMA MEMBRANE, CELL SURFACE, DRUGGABLE GENOME | antagonist | LY 2510924 | ||
| 7852 | CXCR4 | DRUG RESISTANCE, CLINICALLY ACTIONABLE, G PROTEIN COUPLED RECEPTOR, EXTERNAL SIDE OF PLASMA MEMBRANE, CELL SURFACE, DRUGGABLE GENOME | TG-0054 | BURIXAFOR | ||
| 7852 | CXCR4 | DRUG RESISTANCE, CLINICALLY ACTIONABLE, G PROTEIN COUPLED RECEPTOR, EXTERNAL SIDE OF PLASMA MEMBRANE, CELL SURFACE, DRUGGABLE GENOME | SPERMINE BIS-1-NAPG | CHEMBL2347630 | 23434419 | |
| 7852 | CXCR4 | DRUG RESISTANCE, CLINICALLY ACTIONABLE, G PROTEIN COUPLED RECEPTOR, EXTERNAL SIDE OF PLASMA MEMBRANE, CELL SURFACE, DRUGGABLE GENOME | Ulocuplumab | ULOCUPLUMAB | ||
| 7852 | CXCR4 | DRUG RESISTANCE, CLINICALLY ACTIONABLE, G PROTEIN COUPLED RECEPTOR, EXTERNAL SIDE OF PLASMA MEMBRANE, CELL SURFACE, DRUGGABLE GENOME | antagonist | CHEMBL3545330 | MSX-122 | |
| 7852 | CXCR4 | DRUG RESISTANCE, CLINICALLY ACTIONABLE, G PROTEIN COUPLED RECEPTOR, EXTERNAL SIDE OF PLASMA MEMBRANE, CELL SURFACE, DRUGGABLE GENOME | agonist | 252166735 | ||
| 7852 | CXCR4 | DRUG RESISTANCE, CLINICALLY ACTIONABLE, G PROTEIN COUPLED RECEPTOR, EXTERNAL SIDE OF PLASMA MEMBRANE, CELL SURFACE, DRUGGABLE GENOME | bevacizumab | BEVACIZUMAB | 27503580 | |
| 7852 | CXCR4 | DRUG RESISTANCE, CLINICALLY ACTIONABLE, G PROTEIN COUPLED RECEPTOR, EXTERNAL SIDE OF PLASMA MEMBRANE, CELL SURFACE, DRUGGABLE GENOME | FX125L | |||
| 7852 | CXCR4 | DRUG RESISTANCE, CLINICALLY ACTIONABLE, G PROTEIN COUPLED RECEPTOR, EXTERNAL SIDE OF PLASMA MEMBRANE, CELL SURFACE, DRUGGABLE GENOME | agonist | 135652070 | ||
| 7852 | CXCR4 | DRUG RESISTANCE, CLINICALLY ACTIONABLE, G PROTEIN COUPLED RECEPTOR, EXTERNAL SIDE OF PLASMA MEMBRANE, CELL SURFACE, DRUGGABLE GENOME | USL311 | USL-311 |
| Page: 1 2 3 4 5 6 7 8 |

Copyright 2023-Present -The University of Texas Health Science Center at Houston |