
|
|||||
|
 | |
| |
| |
| |
| |
| |
|
Gene: CXCL10 |
Gene summary for CXCL10 |
| Gene information | Species | Human | Gene symbol | CXCL10 | Gene ID | 3627 |
| Gene name | C-X-C motif chemokine ligand 10 | |
| Gene Alias | C7 | |
| Cytomap | 4q21.1 | |
| Gene Type | protein-coding | GO ID | GO:0000768 | UniProtAcc | A0A024RDA4 |
Top |
Malignant transformation analysis |
| Identification of the aberrant gene expression in precancerous and cancerous lesions by comparing the gene expression of stem-like cells in diseased tissues with normal stem cells |
| Entrez ID | Symbol | Replicates | Species | Organ | Tissue | Adj P-value | Log2FC | Malignancy |
| 3627 | CXCL10 | NCCBC5 | Human | Breast | DCIS | 6.35e-13 | 7.28e-01 | 0.2046 |
| 3627 | CXCL10 | P2 | Human | Breast | IDC | 4.41e-20 | 8.01e-01 | 0.21 |
| 3627 | CXCL10 | CA_HPV_1 | Human | Cervix | CC | 4.47e-13 | 6.98e-01 | 0.0264 |
| 3627 | CXCL10 | CCI_2 | Human | Cervix | CC | 1.80e-05 | 9.19e-01 | 0.5249 |
| 3627 | CXCL10 | Tumor | Human | Cervix | CC | 8.20e-10 | 5.97e-01 | 0.1241 |
| 3627 | CXCL10 | sample1 | Human | Cervix | CC | 2.47e-05 | 4.62e-01 | 0.0959 |
| 3627 | CXCL10 | sample3 | Human | Cervix | CC | 7.68e-03 | 3.42e-01 | 0.1387 |
| 3627 | CXCL10 | T1 | Human | Cervix | CC | 3.61e-08 | 3.01e-01 | 0.0918 |
| 3627 | CXCL10 | T3 | Human | Cervix | CC | 3.64e-04 | 3.65e-01 | 0.1389 |
| 3627 | CXCL10 | P2T-E | Human | Esophagus | ESCC | 5.00e-17 | 1.43e+00 | 0.1177 |
| 3627 | CXCL10 | P16T-E | Human | Esophagus | ESCC | 5.52e-04 | 3.23e-01 | 0.1153 |
| 3627 | CXCL10 | P24T-E | Human | Esophagus | ESCC | 2.13e-27 | 2.65e+00 | 0.1287 |
| 3627 | CXCL10 | P37T-E | Human | Esophagus | ESCC | 1.17e-06 | 2.14e+00 | 0.1371 |
| 3627 | CXCL10 | P40T-E | Human | Esophagus | ESCC | 1.45e-06 | 1.68e+00 | 0.109 |
| 3627 | CXCL10 | P52T-E | Human | Esophagus | ESCC | 1.43e-41 | 4.16e+00 | 0.1555 |
| 3627 | CXCL10 | P56T-E | Human | Esophagus | ESCC | 3.98e-15 | 4.35e+00 | 0.1613 |
| 3627 | CXCL10 | P62T-E | Human | Esophagus | ESCC | 1.79e-09 | 2.79e+00 | 0.1302 |
| 3627 | CXCL10 | P75T-E | Human | Esophagus | ESCC | 1.97e-10 | 2.24e+00 | 0.1125 |
| 3627 | CXCL10 | P76T-E | Human | Esophagus | ESCC | 1.25e-08 | 1.94e+00 | 0.1207 |
| 3627 | CXCL10 | P80T-E | Human | Esophagus | ESCC | 7.34e-25 | 5.28e+00 | 0.155 |
| Page: 1 2 3 |
| Tissue | Expression Dynamics | Abbreviation |
| Breast | 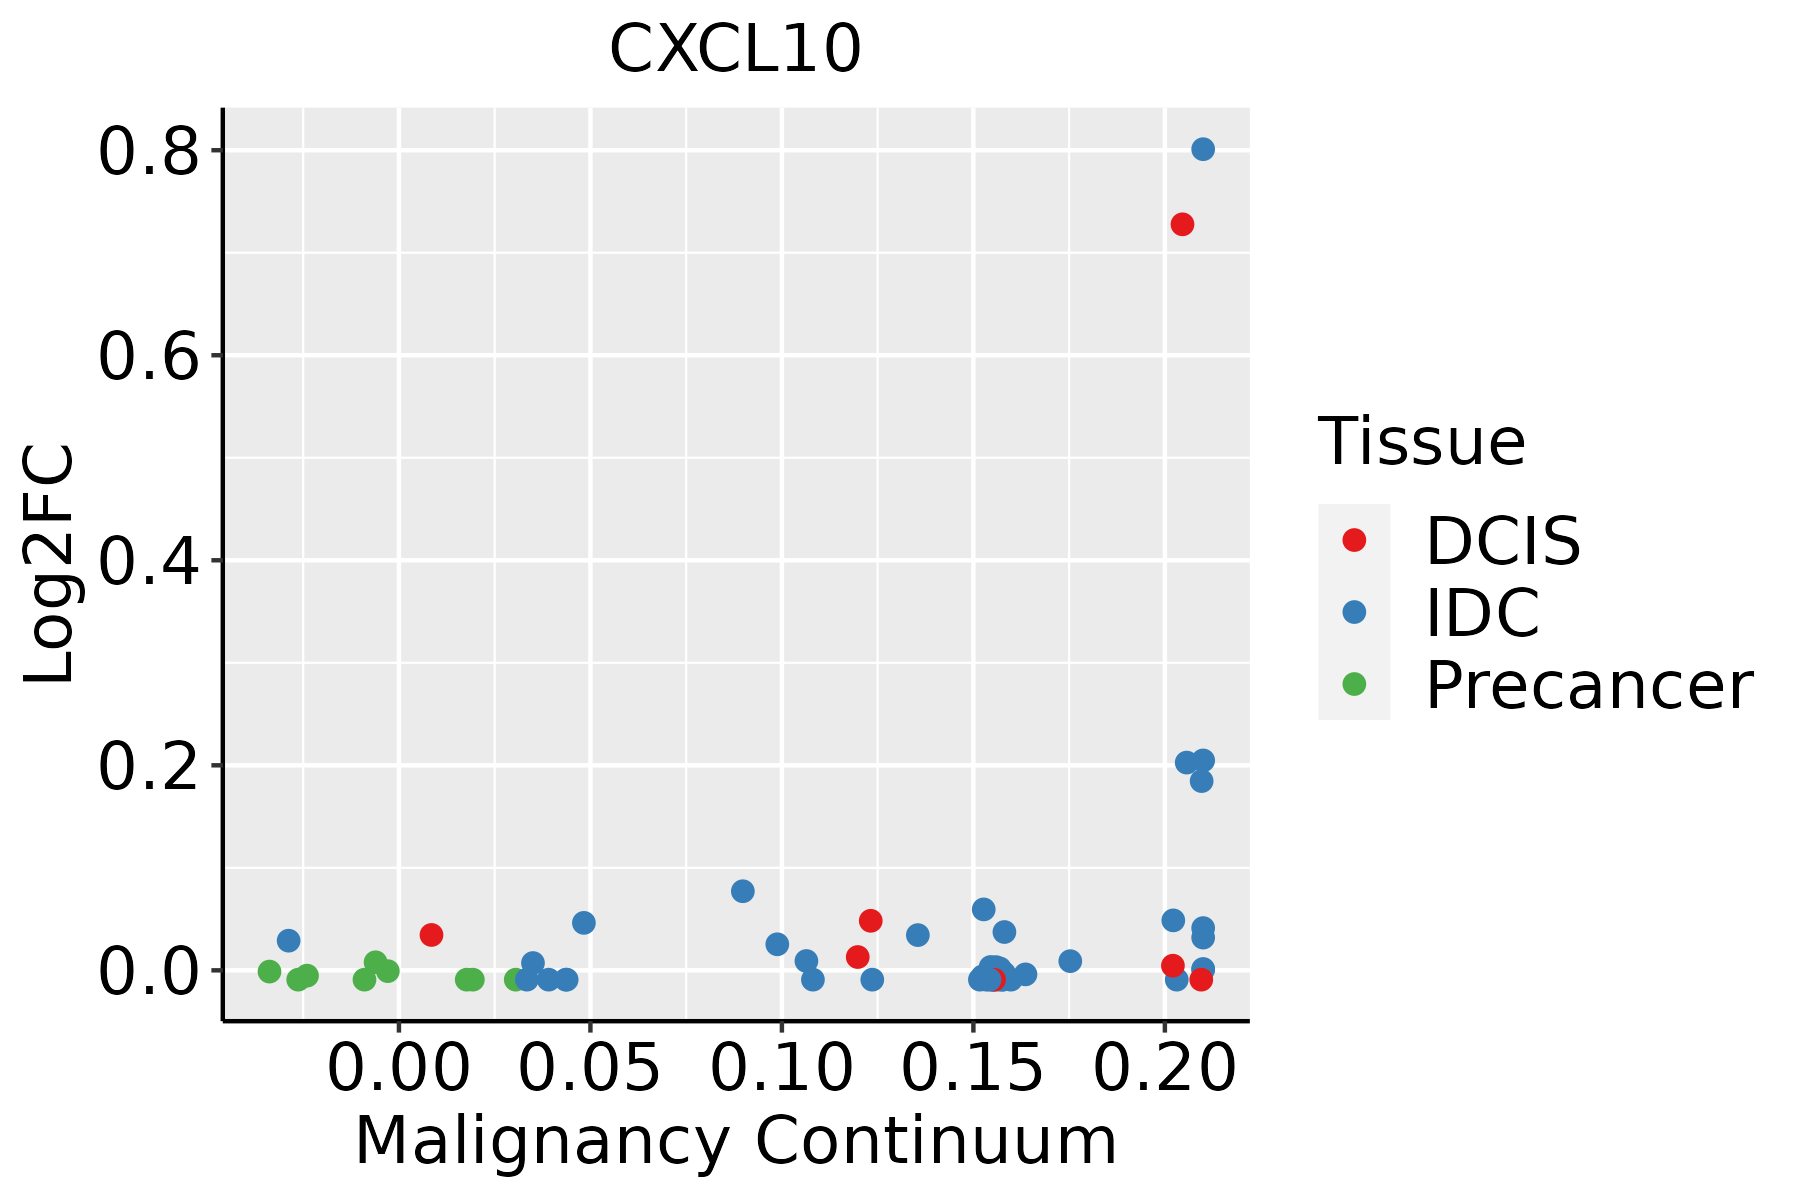 | IDC: Invasive ductal carcinoma |
| DCIS: Ductal carcinoma in situ | ||
| Precancer(BRCA1-mut): Precancerous lesion from BRCA1 mutation carriers | ||
| Cervix | 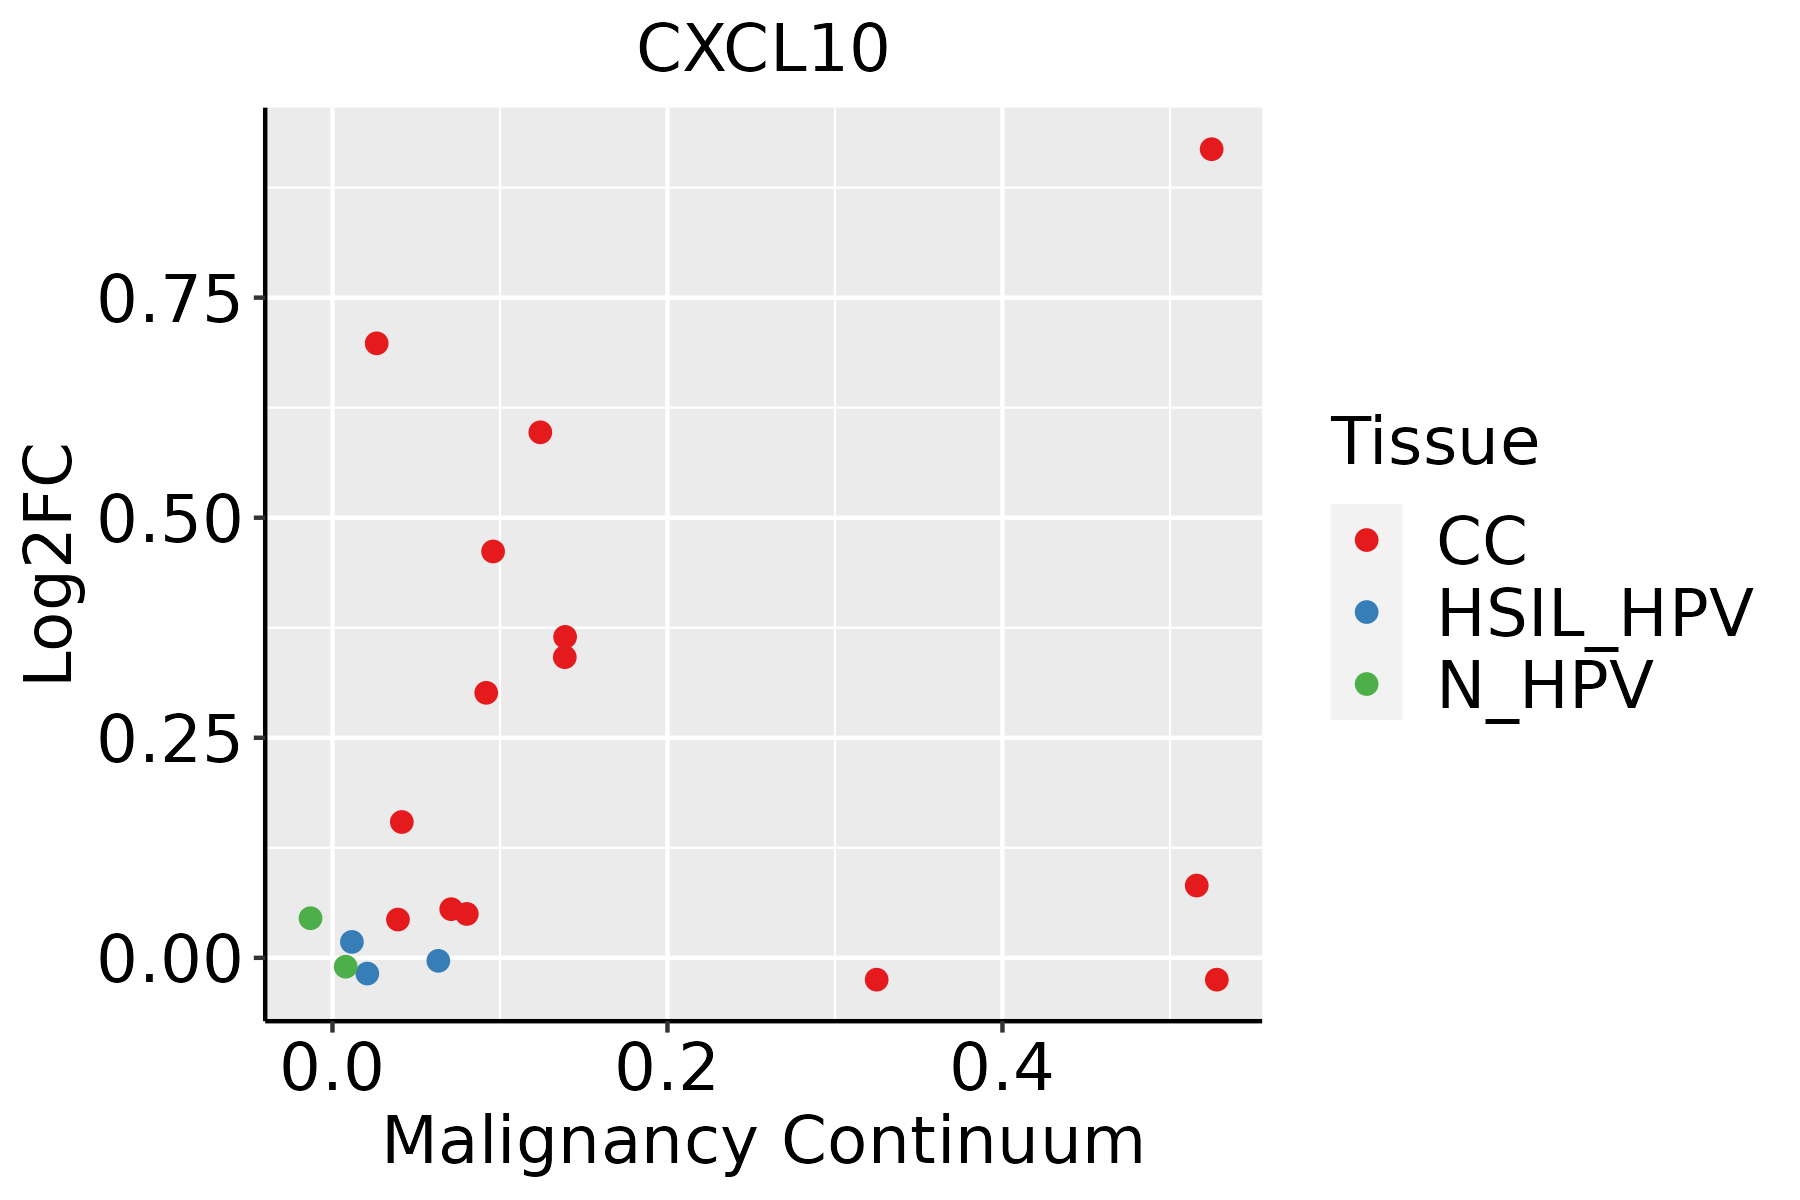 | CC: Cervix cancer |
| HSIL_HPV: HPV-infected high-grade squamous intraepithelial lesions | ||
| N_HPV: HPV-infected normal cervix | ||
| Esophagus | 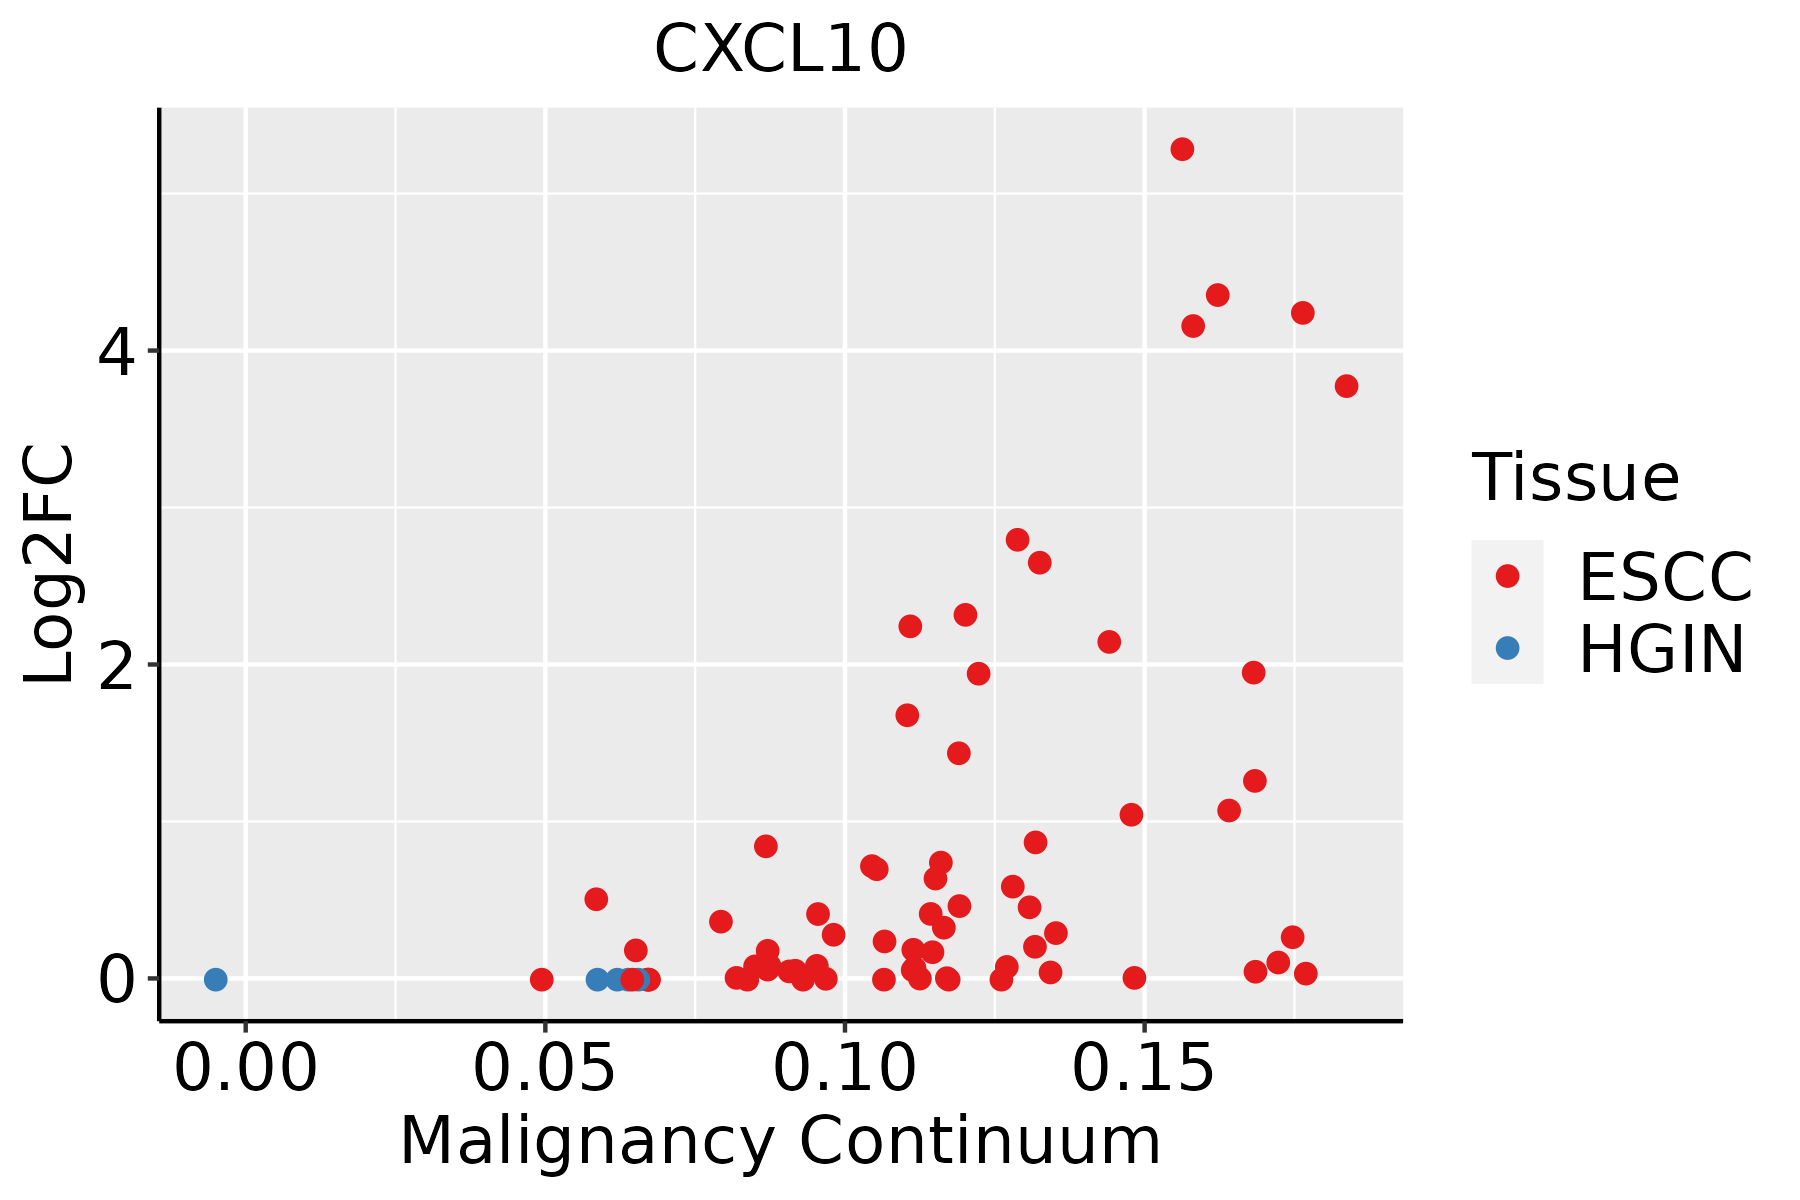 | ESCC: Esophageal squamous cell carcinoma |
| HGIN: High-grade intraepithelial neoplasias | ||
| LGIN: Low-grade intraepithelial neoplasias | ||
| Liver | 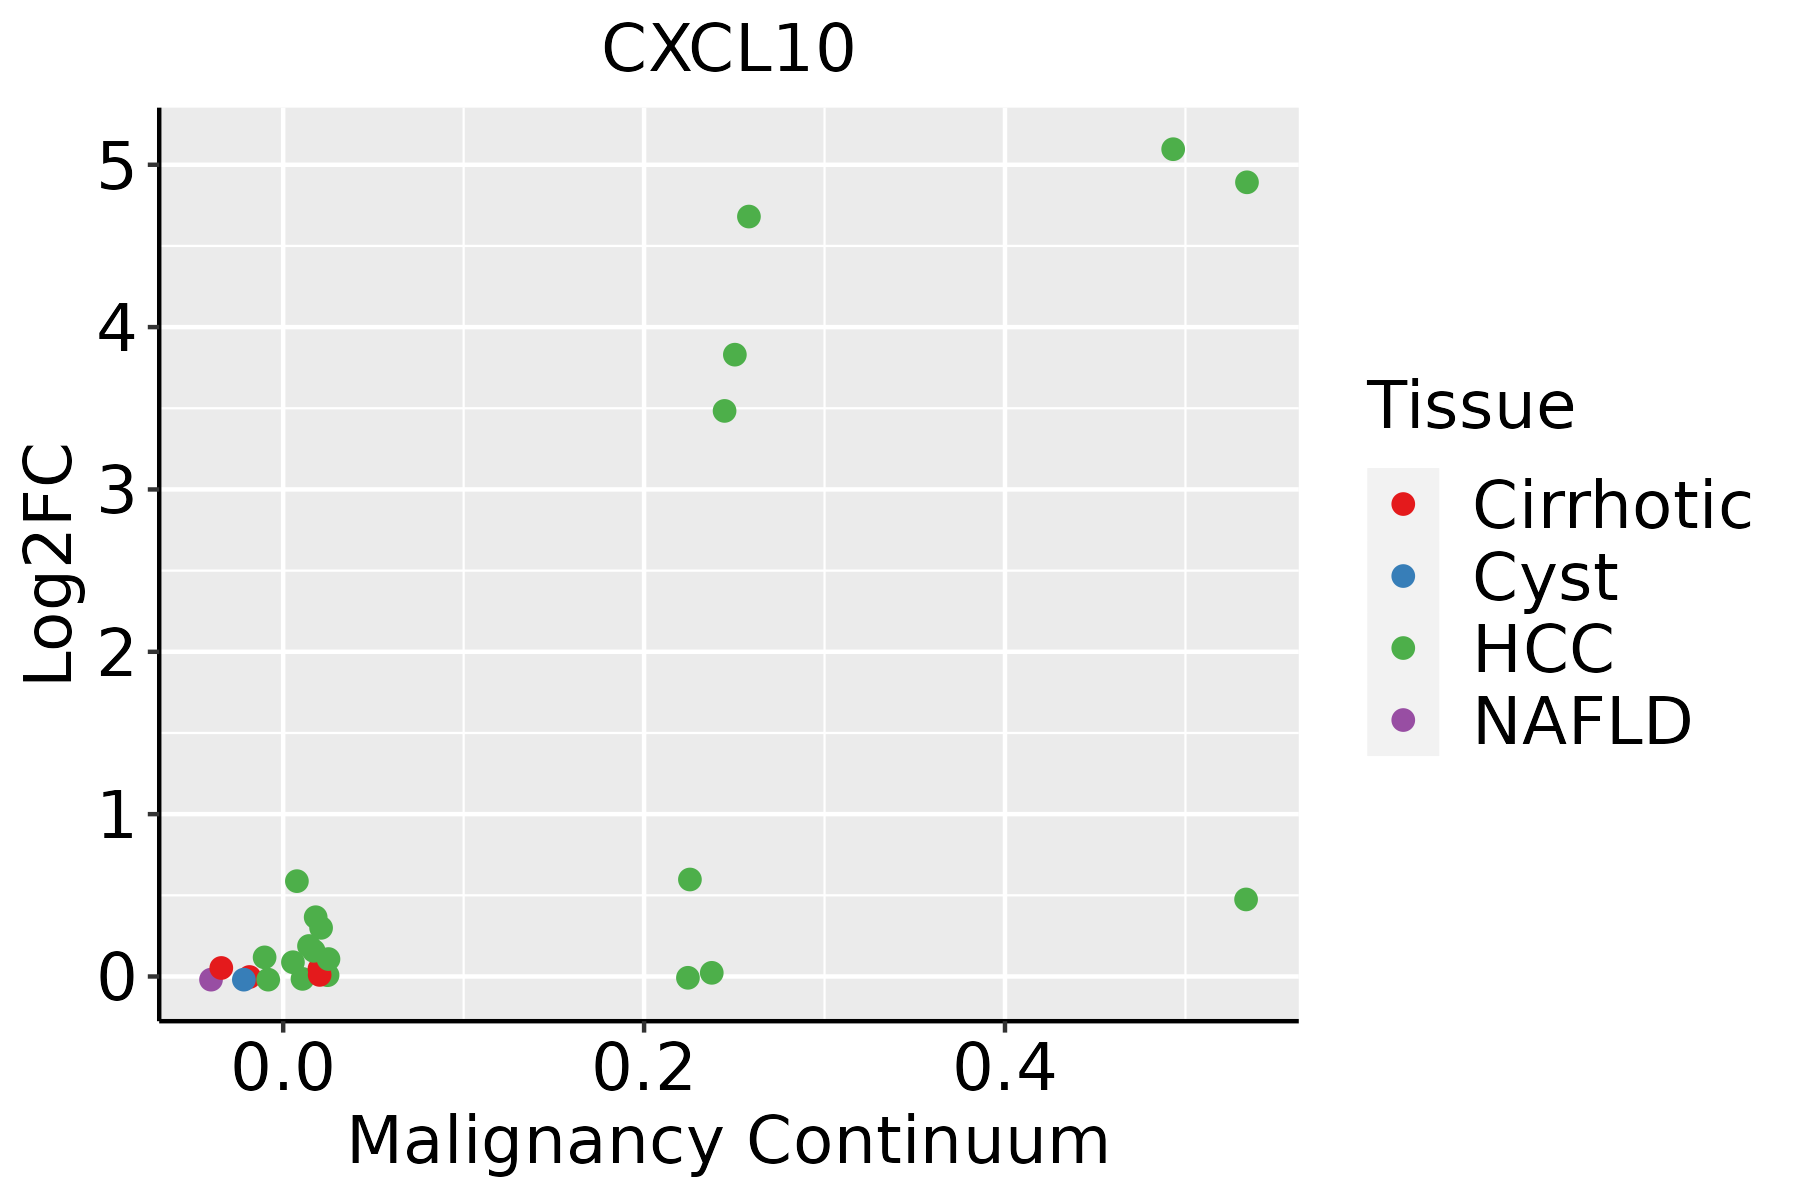 | HCC: Hepatocellular carcinoma |
| NAFLD: Non-alcoholic fatty liver disease | ||
| Oral Cavity |  | EOLP: Erosive Oral lichen planus |
| LP: leukoplakia | ||
| NEOLP: Non-erosive oral lichen planus | ||
| OSCC: Oral squamous cell carcinoma | ||
| Skin | 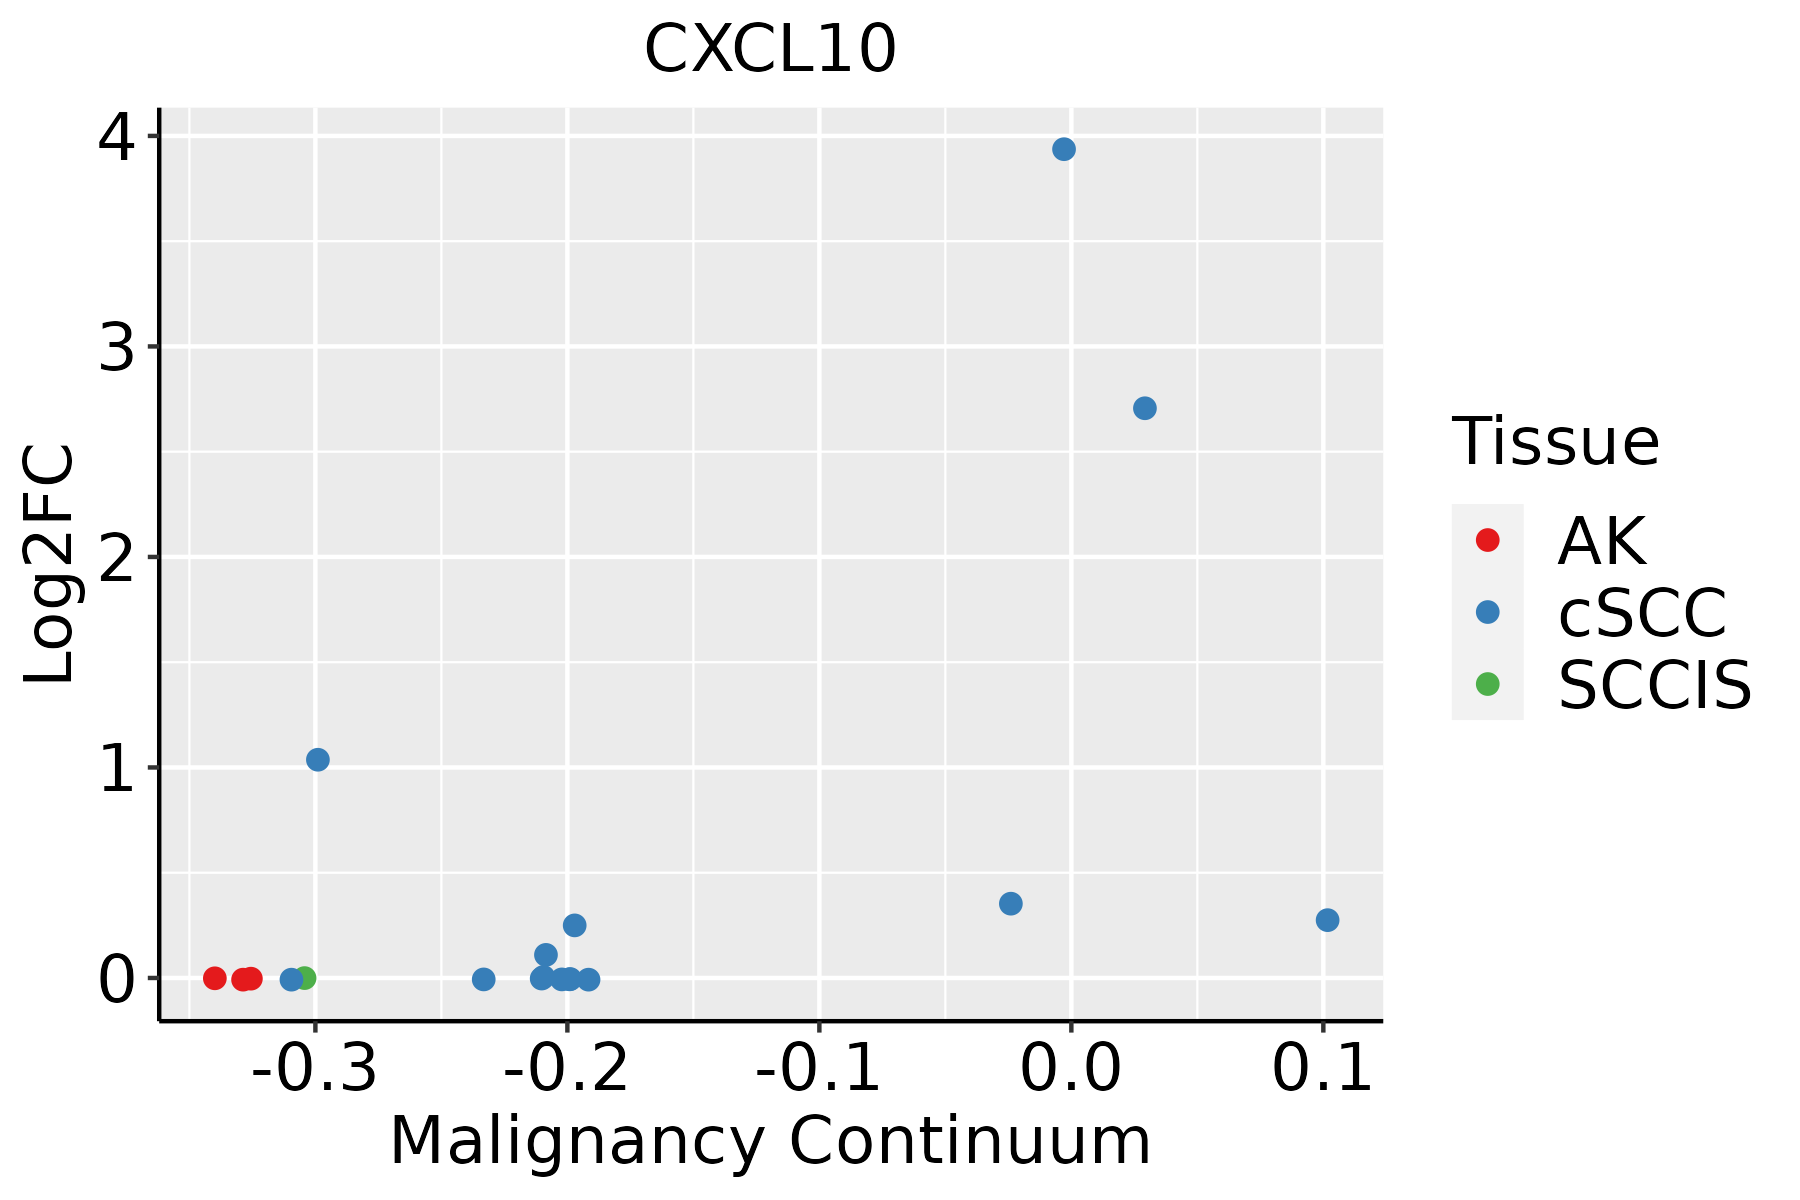 | AK: Actinic keratosis |
| cSCC: Cutaneous squamous cell carcinoma | ||
| SCCIS:squamous cell carcinoma in situ |
| ∗log2FC in expression of this searched gene in stem-like cells from each diseased tissue sample relative to stem-like cells in normal samples in each tissue plotted against the malignancy continuum. Samples are colored based on if they are from different disease stage. |
Top |
Malignant transformation related pathway analysis |
| Find out the enriched GO biological processes and KEGG pathways involved in transition from healthy to precancer to cancer |
| Tissue | Disease Stage | Enriched GO biological Processes |
| Colorectum | AD |  |
| Colorectum | SER |  |
| Colorectum | MSS |  |
| Colorectum | MSI-H |  |
| Colorectum | FAP |  |
| ∗Top 15 enriched GO BP terms are showed in the bar plot of each disease state in each tissue. Each row represents a significant GO biological process which is colored according to the -log10(p.adjust). |
| Page: 1 2 3 4 5 6 7 8 9 |
| GO ID | Tissue | Disease Stage | Description | Gene Ratio | Bg Ratio | pvalue | p.adjust | Count |
| GO:003249617 | Oral cavity | OSCC | response to lipopolysaccharide | 178/7305 | 343/18723 | 7.27e-07 | 1.03e-05 | 178 |
| GO:000268714 | Oral cavity | OSCC | positive regulation of leukocyte migration | 78/7305 | 135/18723 | 7.43e-06 | 8.08e-05 | 78 |
| GO:000926616 | Oral cavity | OSCC | response to temperature stimulus | 98/7305 | 178/18723 | 9.78e-06 | 1.03e-04 | 98 |
| GO:007121615 | Oral cavity | OSCC | cellular response to biotic stimulus | 129/7305 | 246/18723 | 1.20e-05 | 1.23e-04 | 129 |
| GO:000961210 | Oral cavity | OSCC | response to mechanical stimulus | 115/7305 | 216/18723 | 1.43e-05 | 1.44e-04 | 115 |
| GO:000223717 | Oral cavity | OSCC | response to molecule of bacterial origin | 181/7305 | 363/18723 | 1.48e-05 | 1.49e-04 | 181 |
| GO:00075849 | Oral cavity | OSCC | response to nutrient | 95/7305 | 174/18723 | 2.09e-05 | 1.99e-04 | 95 |
| GO:007122210 | Oral cavity | OSCC | cellular response to lipopolysaccharide | 110/7305 | 209/18723 | 4.15e-05 | 3.60e-04 | 110 |
| GO:00103326 | Oral cavity | OSCC | response to gamma radiation | 36/7305 | 56/18723 | 1.12e-04 | 8.24e-04 | 36 |
| GO:000268510 | Oral cavity | OSCC | regulation of leukocyte migration | 108/7305 | 210/18723 | 1.63e-04 | 1.13e-03 | 108 |
| GO:00321037 | Oral cavity | OSCC | positive regulation of response to external stimulus | 203/7305 | 427/18723 | 1.79e-04 | 1.22e-03 | 203 |
| GO:00192214 | Oral cavity | OSCC | cytokine-mediated signaling pathway | 222/7305 | 472/18723 | 2.02e-04 | 1.35e-03 | 222 |
| GO:0140374 | Oral cavity | OSCC | antiviral innate immune response | 13/7305 | 15/18723 | 2.07e-04 | 1.36e-03 | 13 |
| GO:00509216 | Oral cavity | OSCC | positive regulation of chemotaxis | 76/7305 | 141/18723 | 2.30e-04 | 1.49e-03 | 76 |
| GO:007121910 | Oral cavity | OSCC | cellular response to molecule of bacterial origin | 112/7305 | 221/18723 | 2.64e-04 | 1.69e-03 | 112 |
| GO:005090010 | Oral cavity | OSCC | leukocyte migration | 176/7305 | 369/18723 | 3.80e-04 | 2.31e-03 | 176 |
| GO:00026908 | Oral cavity | OSCC | positive regulation of leukocyte chemotaxis | 53/7305 | 94/18723 | 4.71e-04 | 2.79e-03 | 53 |
| GO:000315816 | Oral cavity | OSCC | endothelium development | 71/7305 | 136/18723 | 1.18e-03 | 5.99e-03 | 71 |
| GO:00985866 | Oral cavity | OSCC | cellular response to virus | 47/7305 | 84/18723 | 1.20e-03 | 6.06e-03 | 47 |
| GO:00603269 | Oral cavity | OSCC | cell chemotaxis | 146/7305 | 310/18723 | 2.13e-03 | 9.80e-03 | 146 |
| Page: 1 2 3 4 5 6 7 8 9 10 11 12 13 14 15 16 |
| Pathway ID | Tissue | Disease Stage | Description | Gene Ratio | Bg Ratio | pvalue | p.adjust | qvalue | Count |
| hsa0517144 | Breast | DCIS | Coronavirus disease - COVID-19 | 86/846 | 232/8465 | 2.42e-29 | 1.56e-27 | 1.15e-27 | 86 |
| hsa0516941 | Breast | DCIS | Epstein-Barr virus infection | 46/846 | 202/8465 | 5.60e-08 | 1.13e-06 | 8.33e-07 | 46 |
| hsa0517154 | Breast | DCIS | Coronavirus disease - COVID-19 | 86/846 | 232/8465 | 2.42e-29 | 1.56e-27 | 1.15e-27 | 86 |
| hsa0516951 | Breast | DCIS | Epstein-Barr virus infection | 46/846 | 202/8465 | 5.60e-08 | 1.13e-06 | 8.33e-07 | 46 |
| hsa0517120 | Cervix | CC | Coronavirus disease - COVID-19 | 111/1267 | 232/8465 | 1.82e-33 | 5.90e-31 | 3.49e-31 | 111 |
| hsa0516920 | Cervix | CC | Epstein-Barr virus infection | 57/1267 | 202/8465 | 7.30e-07 | 7.39e-06 | 4.37e-06 | 57 |
| hsa0465718 | Cervix | CC | IL-17 signaling pathway | 31/1267 | 94/8465 | 8.71e-06 | 7.43e-05 | 4.39e-05 | 31 |
| hsa0516414 | Cervix | CC | Influenza A | 43/1267 | 171/8465 | 3.03e-04 | 1.64e-03 | 9.68e-04 | 43 |
| hsa04062 | Cervix | CC | Chemokine signaling pathway | 43/1267 | 192/8465 | 3.60e-03 | 1.34e-02 | 7.91e-03 | 43 |
| hsa046686 | Cervix | CC | TNF signaling pathway | 28/1267 | 114/8465 | 4.60e-03 | 1.62e-02 | 9.59e-03 | 28 |
| hsa05171110 | Cervix | CC | Coronavirus disease - COVID-19 | 111/1267 | 232/8465 | 1.82e-33 | 5.90e-31 | 3.49e-31 | 111 |
| hsa05169110 | Cervix | CC | Epstein-Barr virus infection | 57/1267 | 202/8465 | 7.30e-07 | 7.39e-06 | 4.37e-06 | 57 |
| hsa0465719 | Cervix | CC | IL-17 signaling pathway | 31/1267 | 94/8465 | 8.71e-06 | 7.43e-05 | 4.39e-05 | 31 |
| hsa0516415 | Cervix | CC | Influenza A | 43/1267 | 171/8465 | 3.03e-04 | 1.64e-03 | 9.68e-04 | 43 |
| hsa040621 | Cervix | CC | Chemokine signaling pathway | 43/1267 | 192/8465 | 3.60e-03 | 1.34e-02 | 7.91e-03 | 43 |
| hsa0466813 | Cervix | CC | TNF signaling pathway | 28/1267 | 114/8465 | 4.60e-03 | 1.62e-02 | 9.59e-03 | 28 |
| hsa05169210 | Esophagus | ESCC | Epstein-Barr virus infection | 151/4205 | 202/8465 | 1.55e-13 | 3.45e-12 | 1.77e-12 | 151 |
| hsa0466810 | Esophagus | ESCC | TNF signaling pathway | 89/4205 | 114/8465 | 3.36e-10 | 4.01e-09 | 2.06e-09 | 89 |
| hsa0516425 | Esophagus | ESCC | Influenza A | 122/4205 | 171/8465 | 5.01e-09 | 4.79e-08 | 2.45e-08 | 122 |
| hsa05171211 | Esophagus | ESCC | Coronavirus disease - COVID-19 | 156/4205 | 232/8465 | 3.18e-08 | 2.68e-07 | 1.37e-07 | 156 |
| Page: 1 2 3 4 |
Top |
Cell-cell communication analysis |
| Identification of potential cell-cell interactions between two cell types and their ligand-receptor pairs for different disease states |
| Ligand | Receptor | LRpair | Pathway | Tissue | Disease Stage |
| CXCL10 | ACKR1 | CXCL10_ACKR1 | CXCL | Breast | IDC |
| CXCL10 | CXCR3 | CXCL10_CXCR3 | CXCL | Breast | IDC |
| CXCL10 | ACKR1 | CXCL10_ACKR1 | CXCL | Cervix | CC |
| CXCL10 | CXCR3 | CXCL10_CXCR3 | CXCL | Cervix | CC |
| Page: 1 |
Top |
Single-cell gene regulatory network inference analysis |
| Find out the significant the regulons (TFs) and the target genes of each regulon across cell types for different disease states |
| TF | Cell Type | Tissue | Disease Stage | Target Gene | RSS | Regulon Activity |
| ∗The dot plots of a searched regulon are shown for all cell subpopulations in each disease state of each tissue based on the regulon specific score inferred using pySCENIC and by calculating the average expression. |
| Page: 1 |
Top |
Somatic mutation of malignant transformation related genes |
| Annotation of somatic variants for genes involved in malignant transformation |
| Hugo Symbol | Variant Class | Variant Classification | dbSNP RS | HGVSc | HGVSp | HGVSp Short | SWISSPROT | BIOTYPE | SIFT | PolyPhen | Tumor Sample Barcode | Tissue | Histology | Sex | Age | Stage | Therapy Types | Drugs | Outcome |
| CXCL10 | SNV | Missense_Mutation | c.82N>A | p.Val28Ile | p.V28I | P02778 | protein_coding | tolerated(0.23) | benign(0.003) | TCGA-AN-A0AK-01 | Breast | breast invasive carcinoma | Female | >=65 | I/II | Unknown | Unknown | SD | |
| CXCL10 | SNV | Missense_Mutation | c.275N>T | p.Glu92Val | p.E92V | P02778 | protein_coding | deleterious(0.02) | benign(0.01) | TCGA-AG-A002-01 | Colorectum | rectum adenocarcinoma | Male | <65 | I/II | Unknown | Unknown | SD | |
| CXCL10 | SNV | Missense_Mutation | novel | c.140A>C | p.Lys47Thr | p.K47T | P02778 | protein_coding | tolerated(0.05) | benign(0.311) | TCGA-F5-6814-01 | Colorectum | rectum adenocarcinoma | Male | <65 | I/II | Unknown | Unknown | SD |
| CXCL10 | SNV | Missense_Mutation | c.249N>T | p.Lys83Asn | p.K83N | P02778 | protein_coding | deleterious(0.03) | benign(0.376) | TCGA-AJ-A3EL-01 | Endometrium | uterine corpus endometrioid carcinoma | Female | <65 | I/II | Unknown | Unknown | SD | |
| CXCL10 | SNV | Missense_Mutation | c.22A>G | p.Ile8Val | p.I8V | P02778 | protein_coding | tolerated(0.48) | benign(0.007) | TCGA-AP-A051-01 | Endometrium | uterine corpus endometrioid carcinoma | Female | >=65 | I/II | Unknown | Unknown | SD | |
| CXCL10 | SNV | Missense_Mutation | c.249N>T | p.Lys83Asn | p.K83N | P02778 | protein_coding | deleterious(0.03) | benign(0.376) | TCGA-AP-A1DV-01 | Endometrium | uterine corpus endometrioid carcinoma | Female | <65 | I/II | Unknown | Unknown | SD | |
| CXCL10 | SNV | Missense_Mutation | c.249N>T | p.Lys83Asn | p.K83N | P02778 | protein_coding | deleterious(0.03) | benign(0.376) | TCGA-AX-A0J0-01 | Endometrium | uterine corpus endometrioid carcinoma | Female | <65 | I/II | Unknown | Unknown | SD | |
| CXCL10 | SNV | Missense_Mutation | c.273G>T | p.Lys91Asn | p.K91N | P02778 | protein_coding | tolerated(0.08) | benign(0) | TCGA-EO-A22X-01 | Endometrium | uterine corpus endometrioid carcinoma | Female | <65 | III/IV | Unspecific | Carboplatin | Complete Response | |
| CXCL10 | insertion | Frame_Shift_Ins | novel | c.141dupA | p.Leu48ThrfsTer2 | p.L48Tfs*2 | P02778 | protein_coding | TCGA-AP-A051-01 | Endometrium | uterine corpus endometrioid carcinoma | Female | >=65 | I/II | Unknown | Unknown | SD | ||
| CXCL10 | SNV | Missense_Mutation | c.101N>T | p.Ser34Ile | p.S34I | P02778 | protein_coding | tolerated(0.14) | benign(0.213) | TCGA-L9-A7SV-01 | Lung | lung adenocarcinoma | Male | >=65 | I/II | Chemotherapy | cisplatin | CR |
| Page: 1 2 |
Top |
Related drugs of malignant transformation related genes |
| Identification of chemicals and drugs interact with genes involved in malignant transfromation |
| (DGIdb 4.0) |
| Entrez ID | Symbol | Category | Interaction Types | Drug Claim Name | Drug Name | PMIDs |
| 3627 | CXCL10 | DRUGGABLE GENOME, EXTERNAL SIDE OF PLASMA MEMBRANE | RITONAVIR | RITONAVIR | 11141242 | |
| 3627 | CXCL10 | DRUGGABLE GENOME, EXTERNAL SIDE OF PLASMA MEMBRANE | peginterferon alfa-2b | |||
| 3627 | CXCL10 | DRUGGABLE GENOME, EXTERNAL SIDE OF PLASMA MEMBRANE | ATROPINE | ATROPINE | 15315164 | |
| 3627 | CXCL10 | DRUGGABLE GENOME, EXTERNAL SIDE OF PLASMA MEMBRANE | Anti-IP10 | |||
| 3627 | CXCL10 | DRUGGABLE GENOME, EXTERNAL SIDE OF PLASMA MEMBRANE | ANTIBIOTIC | ANTIBIOTIC | 10634213 | |
| 3627 | CXCL10 | DRUGGABLE GENOME, EXTERNAL SIDE OF PLASMA MEMBRANE | ATORVASTATIN | ATORVASTATIN | 10559511 | |
| 3627 | CXCL10 | DRUGGABLE GENOME, EXTERNAL SIDE OF PLASMA MEMBRANE | MDX-1100 | ELDELUMAB | ||
| 3627 | CXCL10 | DRUGGABLE GENOME, EXTERNAL SIDE OF PLASMA MEMBRANE | BMS-936557 | ELDELUMAB | ||
| 3627 | CXCL10 | DRUGGABLE GENOME, EXTERNAL SIDE OF PLASMA MEMBRANE | PLATELET FACTOR 4 | 7790818 | ||
| 3627 | CXCL10 | DRUGGABLE GENOME, EXTERNAL SIDE OF PLASMA MEMBRANE | GM-CSF | REGRAMOSTIM | 11591765 |
| Page: 1 2 3 |

Copyright 2023-Present -The University of Texas Health Science Center at Houston |