
|
|||||
|
 | |
| |
| |
| |
| |
| |
|
Gene: CTDSPL |
Gene summary for CTDSPL |
| Gene information | Species | Human | Gene symbol | CTDSPL | Gene ID | 10217 |
| Gene name | CTD small phosphatase like | |
| Gene Alias | C3orf8 | |
| Cytomap | 3p22.2 | |
| Gene Type | protein-coding | GO ID | GO:0000082 | UniProtAcc | O15194 |
Top |
Malignant transformation analysis |
| Identification of the aberrant gene expression in precancerous and cancerous lesions by comparing the gene expression of stem-like cells in diseased tissues with normal stem cells |
| Entrez ID | Symbol | Replicates | Species | Organ | Tissue | Adj P-value | Log2FC | Malignancy |
| 10217 | CTDSPL | CA_HPV_3 | Human | Cervix | CC | 5.93e-05 | 1.67e-01 | 0.0414 |
| 10217 | CTDSPL | CCI_2 | Human | Cervix | CC | 9.93e-05 | 7.93e-01 | 0.5249 |
| 10217 | CTDSPL | HTA11_347_2000001011 | Human | Colorectum | AD | 7.57e-12 | 6.53e-01 | -0.1954 |
| 10217 | CTDSPL | HTA11_7663_2000001011 | Human | Colorectum | SER | 4.92e-11 | 9.03e-01 | 0.0131 |
| 10217 | CTDSPL | HTA11_7469_2000001011 | Human | Colorectum | AD | 1.40e-03 | 6.63e-01 | -0.0124 |
| 10217 | CTDSPL | HTA11_99999965062_69753 | Human | Colorectum | MSI-H | 7.15e-06 | 1.06e+00 | 0.3487 |
| 10217 | CTDSPL | F007 | Human | Colorectum | FAP | 1.11e-08 | -5.51e-01 | 0.1176 |
| 10217 | CTDSPL | A001-C-207 | Human | Colorectum | FAP | 5.78e-04 | -3.69e-01 | 0.1278 |
| 10217 | CTDSPL | A015-C-203 | Human | Colorectum | FAP | 1.90e-24 | -5.20e-01 | -0.1294 |
| 10217 | CTDSPL | A015-C-204 | Human | Colorectum | FAP | 4.08e-07 | -4.46e-01 | -0.0228 |
| 10217 | CTDSPL | A014-C-040 | Human | Colorectum | FAP | 1.57e-05 | -6.08e-01 | -0.1184 |
| 10217 | CTDSPL | A002-C-201 | Human | Colorectum | FAP | 7.41e-17 | -5.22e-01 | 0.0324 |
| 10217 | CTDSPL | A002-C-203 | Human | Colorectum | FAP | 9.80e-03 | -2.32e-01 | 0.2786 |
| 10217 | CTDSPL | A001-C-119 | Human | Colorectum | FAP | 3.04e-10 | -6.42e-01 | -0.1557 |
| 10217 | CTDSPL | A001-C-108 | Human | Colorectum | FAP | 6.46e-20 | -5.36e-01 | -0.0272 |
| 10217 | CTDSPL | A002-C-205 | Human | Colorectum | FAP | 3.49e-29 | -7.11e-01 | -0.1236 |
| 10217 | CTDSPL | A001-C-104 | Human | Colorectum | FAP | 1.36e-05 | -3.73e-01 | 0.0184 |
| 10217 | CTDSPL | A015-C-005 | Human | Colorectum | FAP | 6.54e-03 | -2.86e-01 | -0.0336 |
| 10217 | CTDSPL | A015-C-006 | Human | Colorectum | FAP | 9.56e-19 | -6.40e-01 | -0.0994 |
| 10217 | CTDSPL | A015-C-106 | Human | Colorectum | FAP | 1.41e-12 | -3.37e-01 | -0.0511 |
| Page: 1 2 3 4 5 6 |
| Tissue | Expression Dynamics | Abbreviation |
| Cervix |  | CC: Cervix cancer |
| HSIL_HPV: HPV-infected high-grade squamous intraepithelial lesions | ||
| N_HPV: HPV-infected normal cervix | ||
| Colorectum (GSE201348) |  | FAP: Familial adenomatous polyposis |
| CRC: Colorectal cancer | ||
| Colorectum (HTA11) |  | AD: Adenomas |
| SER: Sessile serrated lesions | ||
| MSI-H: Microsatellite-high colorectal cancer | ||
| MSS: Microsatellite stable colorectal cancer | ||
| Liver | 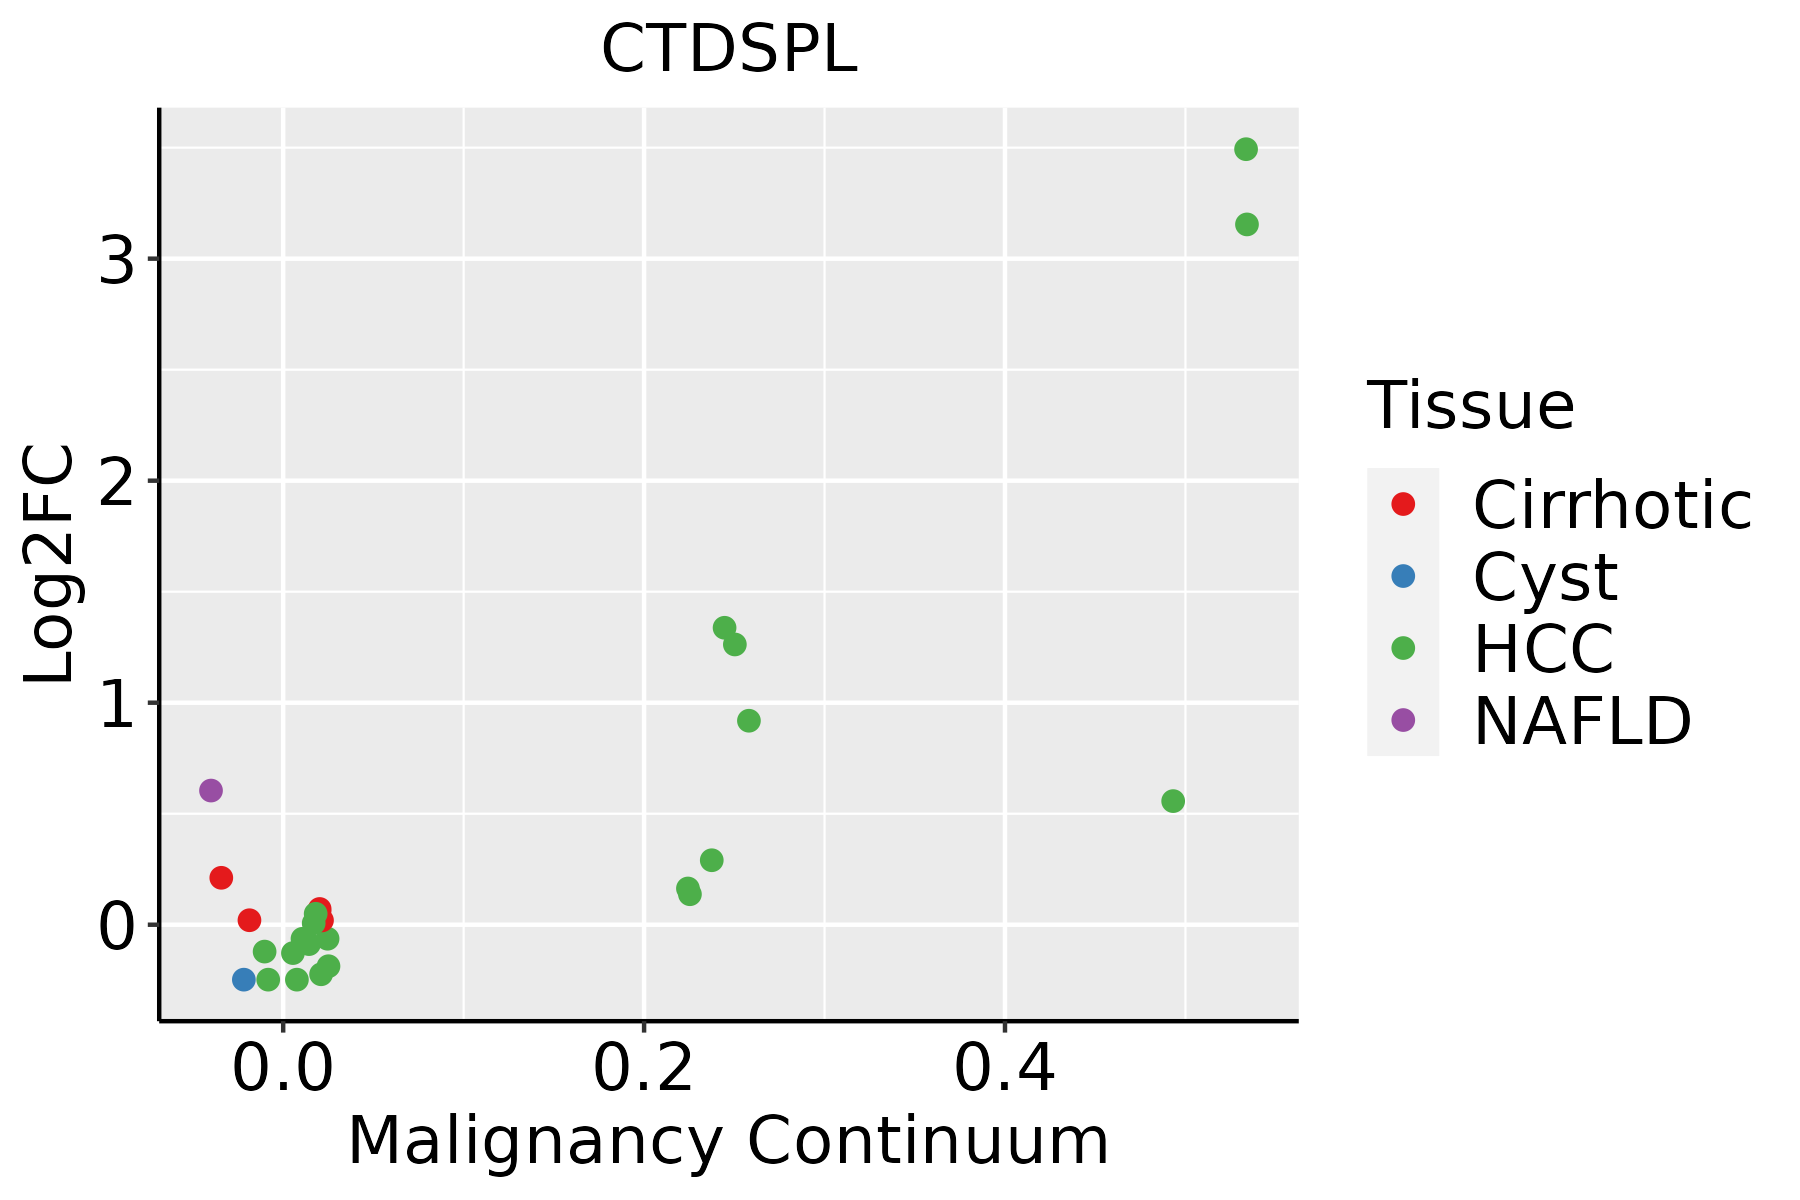 | HCC: Hepatocellular carcinoma |
| NAFLD: Non-alcoholic fatty liver disease | ||
| Lung | 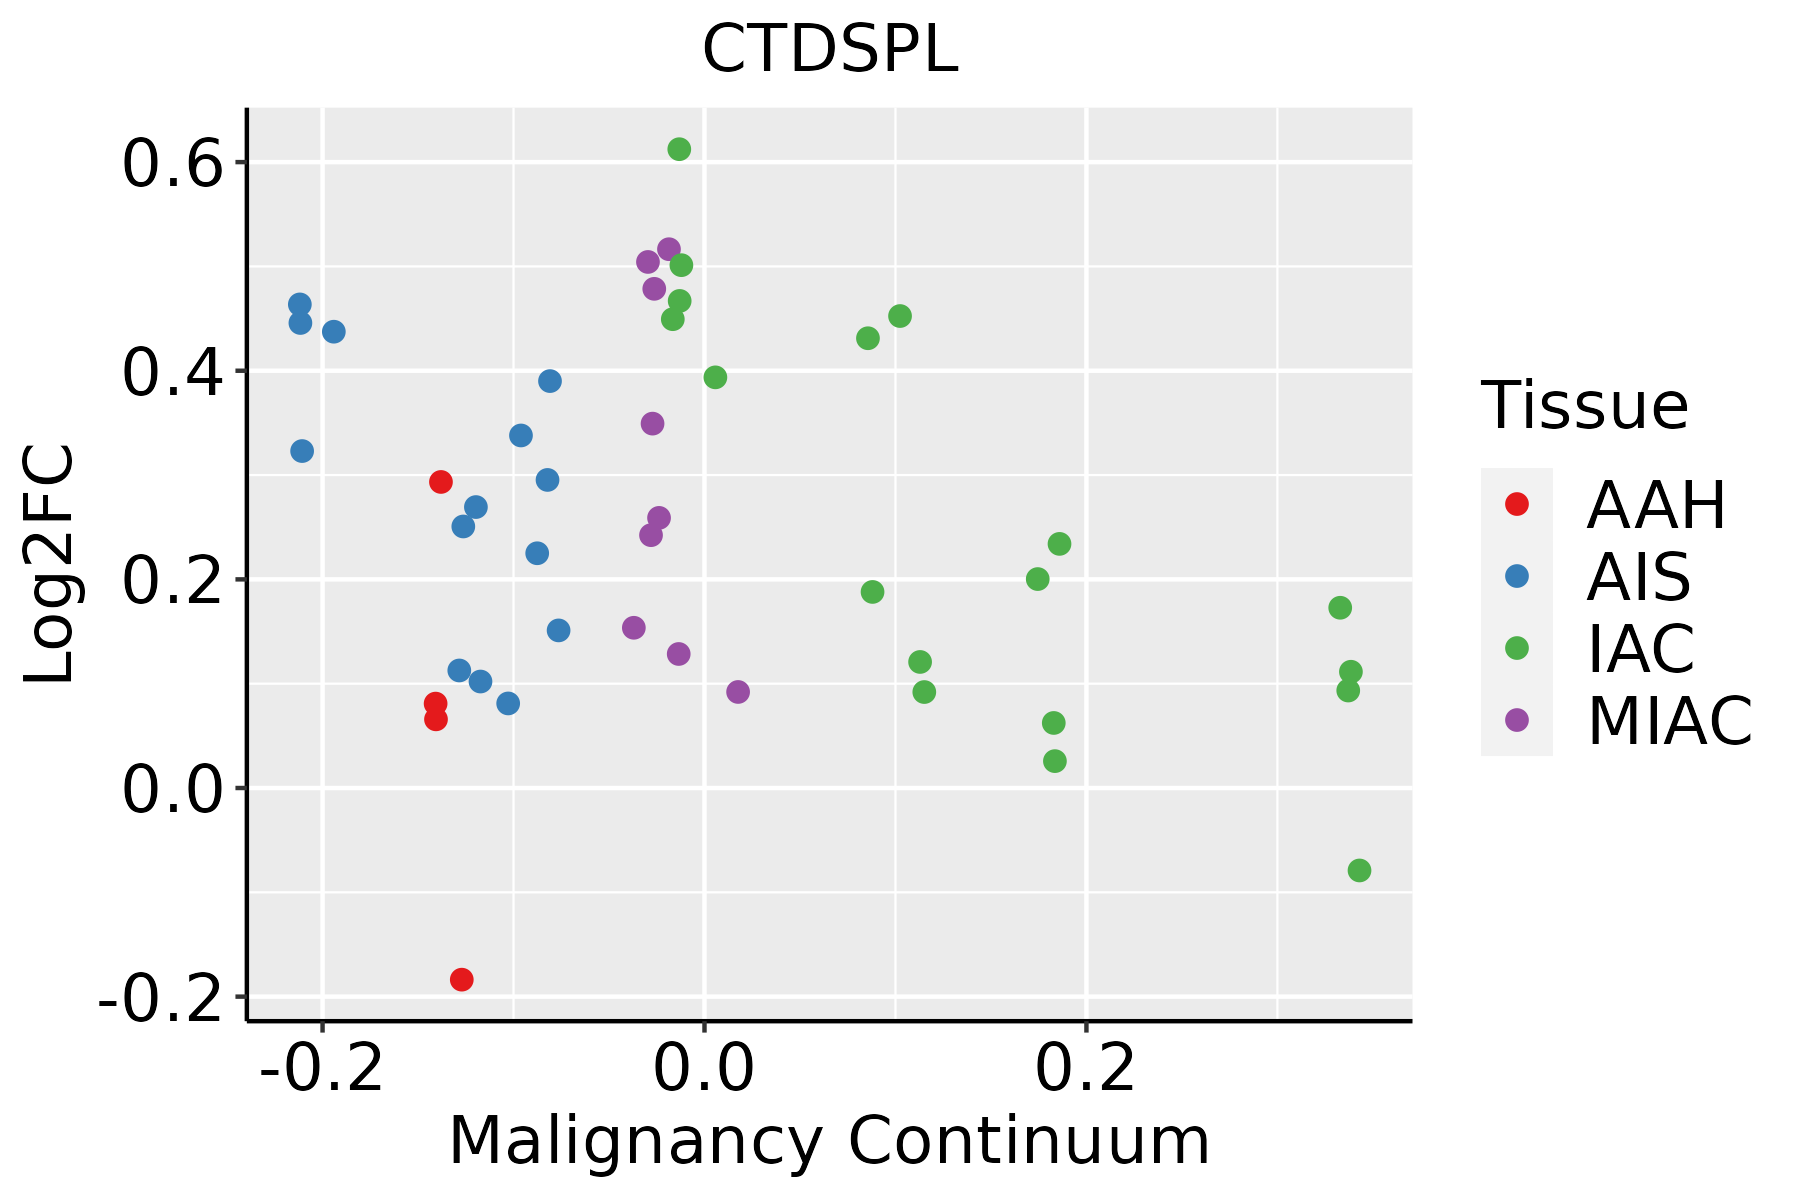 | AAH: Atypical adenomatous hyperplasia |
| AIS: Adenocarcinoma in situ | ||
| IAC: Invasive lung adenocarcinoma | ||
| MIA: Minimally invasive adenocarcinoma | ||
| Prostate | 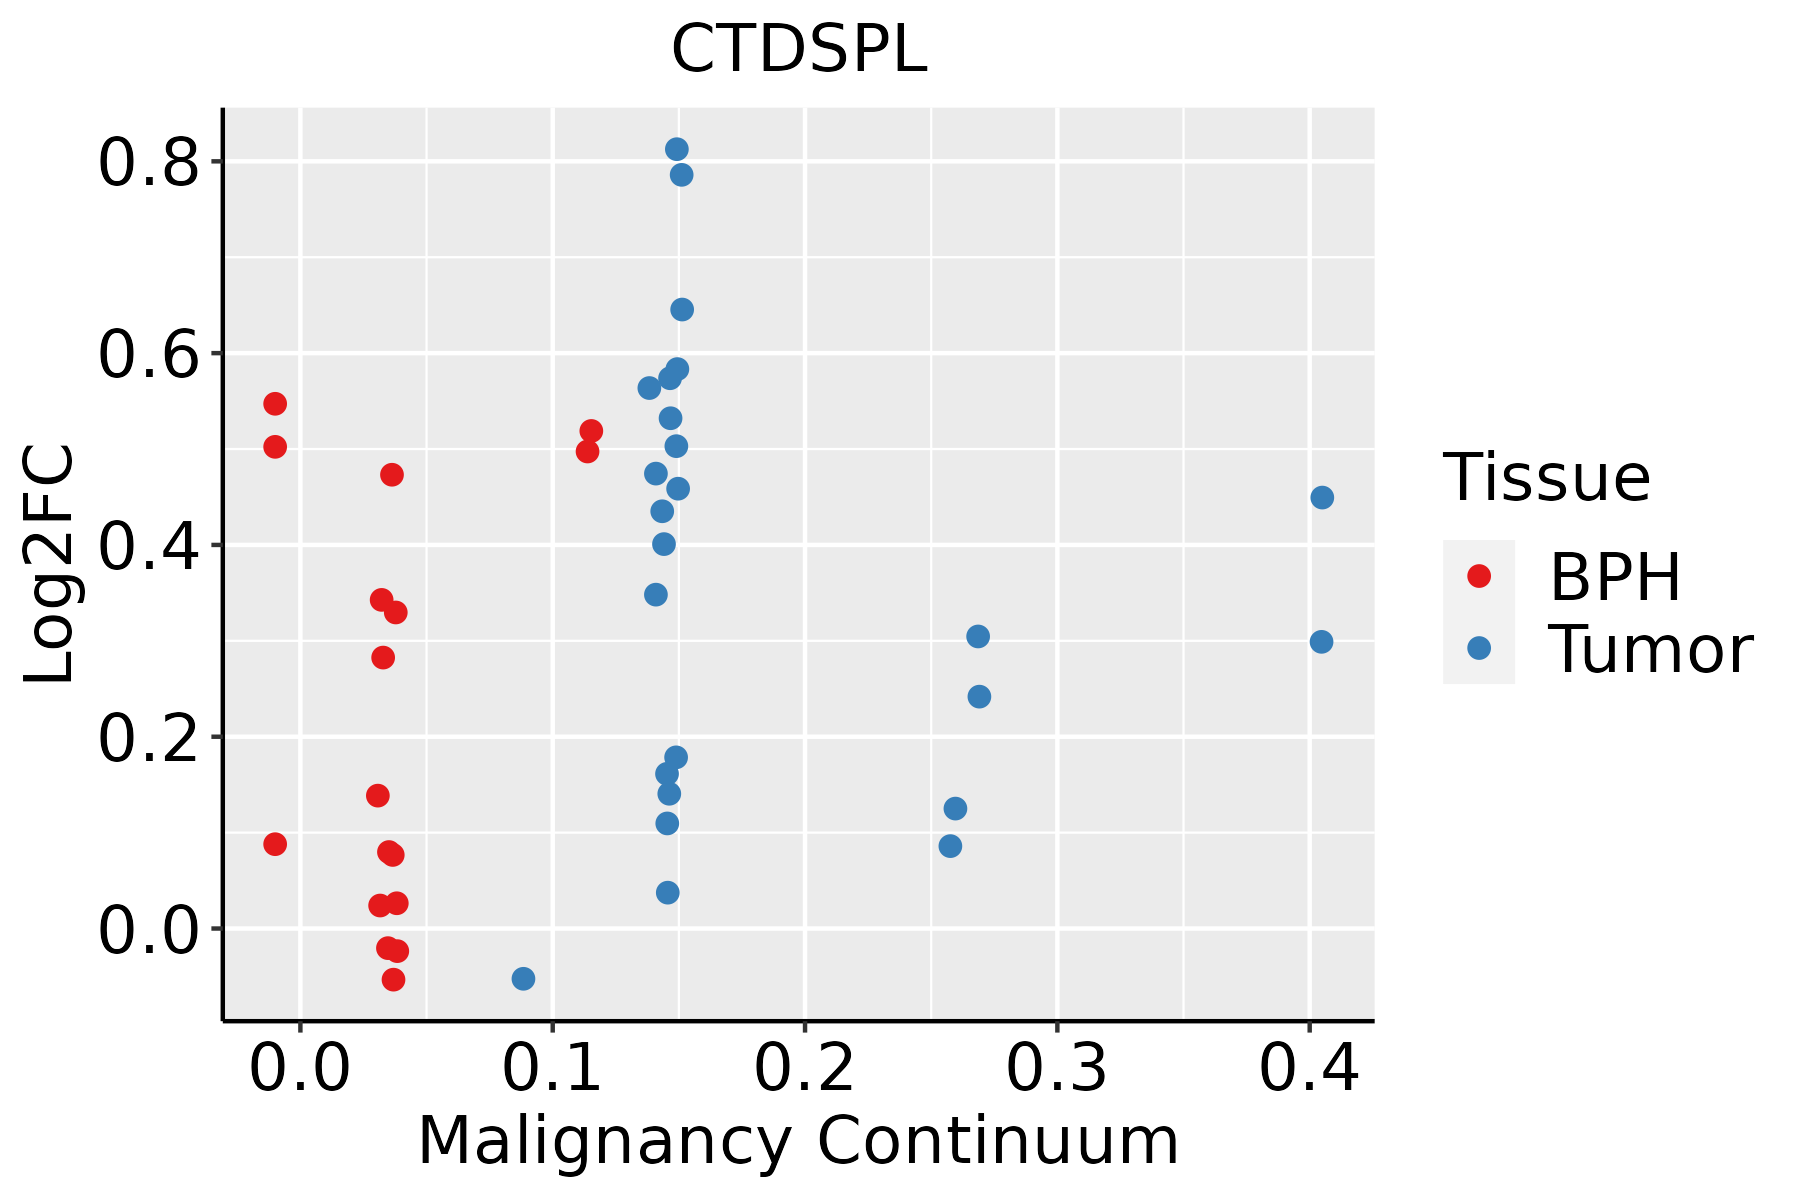 | BPH: Benign Prostatic Hyperplasia |
| Skin |  | AK: Actinic keratosis |
| cSCC: Cutaneous squamous cell carcinoma | ||
| SCCIS:squamous cell carcinoma in situ | ||
| Thyroid |  | ATC: Anaplastic thyroid cancer |
| HT: Hashimoto's thyroiditis | ||
| PTC: Papillary thyroid cancer |
| ∗log2FC in expression of this searched gene in stem-like cells from each diseased tissue sample relative to stem-like cells in normal samples in each tissue plotted against the malignancy continuum. Samples are colored based on if they are from different disease stage. |
Top |
Malignant transformation related pathway analysis |
| Find out the enriched GO biological processes and KEGG pathways involved in transition from healthy to precancer to cancer |
| Tissue | Disease Stage | Enriched GO biological Processes |
| Colorectum | AD |  |
| Colorectum | SER |  |
| Colorectum | MSS |  |
| Colorectum | MSI-H |  |
| Colorectum | FAP |  |
| ∗Top 15 enriched GO BP terms are showed in the bar plot of each disease state in each tissue. Each row represents a significant GO biological process which is colored according to the -log10(p.adjust). |
| Page: 1 2 3 4 5 6 7 8 9 |
| GO ID | Tissue | Disease Stage | Description | Gene Ratio | Bg Ratio | pvalue | p.adjust | Count |
| GO:000647010 | Prostate | BPH | protein dephosphorylation | 78/3107 | 281/18723 | 1.53e-06 | 2.63e-05 | 78 |
| GO:00448435 | Prostate | BPH | cell cycle G1/S phase transition | 68/3107 | 241/18723 | 3.80e-06 | 5.83e-05 | 68 |
| GO:00000825 | Prostate | BPH | G1/S transition of mitotic cell cycle | 62/3107 | 214/18723 | 3.93e-06 | 5.97e-05 | 62 |
| GO:19028063 | Prostate | BPH | regulation of cell cycle G1/S phase transition | 50/3107 | 168/18723 | 1.47e-05 | 1.89e-04 | 50 |
| GO:20000454 | Prostate | BPH | regulation of G1/S transition of mitotic cell cycle | 44/3107 | 142/18723 | 1.55e-05 | 1.96e-04 | 44 |
| GO:19019904 | Prostate | BPH | regulation of mitotic cell cycle phase transition | 77/3107 | 299/18723 | 3.36e-05 | 3.77e-04 | 77 |
| GO:20001342 | Prostate | BPH | negative regulation of G1/S transition of mitotic cell cycle | 28/3107 | 84/18723 | 1.31e-04 | 1.18e-03 | 28 |
| GO:00163118 | Prostate | BPH | dephosphorylation | 98/3107 | 417/18723 | 1.53e-04 | 1.35e-03 | 98 |
| GO:00457863 | Prostate | BPH | negative regulation of cell cycle | 91/3107 | 385/18723 | 2.10e-04 | 1.71e-03 | 91 |
| GO:00459303 | Prostate | BPH | negative regulation of mitotic cell cycle | 60/3107 | 235/18723 | 3.00e-04 | 2.32e-03 | 60 |
| GO:19019874 | Prostate | BPH | regulation of cell cycle phase transition | 89/3107 | 390/18723 | 8.17e-04 | 5.34e-03 | 89 |
| GO:19028072 | Prostate | BPH | negative regulation of cell cycle G1/S phase transition | 28/3107 | 93/18723 | 8.54e-04 | 5.53e-03 | 28 |
| GO:19019913 | Prostate | BPH | negative regulation of mitotic cell cycle phase transition | 46/3107 | 179/18723 | 1.24e-03 | 7.51e-03 | 46 |
| GO:004232618 | Prostate | Tumor | negative regulation of phosphorylation | 112/3246 | 385/18723 | 6.17e-09 | 2.42e-07 | 112 |
| GO:004593619 | Prostate | Tumor | negative regulation of phosphate metabolic process | 124/3246 | 441/18723 | 9.08e-09 | 3.44e-07 | 124 |
| GO:001056319 | Prostate | Tumor | negative regulation of phosphorus metabolic process | 124/3246 | 442/18723 | 1.05e-08 | 3.88e-07 | 124 |
| GO:000193318 | Prostate | Tumor | negative regulation of protein phosphorylation | 97/3246 | 342/18723 | 2.36e-07 | 5.60e-06 | 97 |
| GO:000008212 | Prostate | Tumor | G1/S transition of mitotic cell cycle | 62/3246 | 214/18723 | 1.63e-05 | 2.18e-04 | 62 |
| GO:000647014 | Prostate | Tumor | protein dephosphorylation | 76/3246 | 281/18723 | 2.86e-05 | 3.46e-04 | 76 |
| GO:004484312 | Prostate | Tumor | cell cycle G1/S phase transition | 67/3246 | 241/18723 | 3.28e-05 | 3.88e-04 | 67 |
| Page: 1 2 3 4 5 6 7 8 9 10 11 12 13 14 15 16 17 18 19 20 |
| Pathway ID | Tissue | Disease Stage | Description | Gene Ratio | Bg Ratio | pvalue | p.adjust | qvalue | Count |
| Page: 1 |
Top |
Cell-cell communication analysis |
| Identification of potential cell-cell interactions between two cell types and their ligand-receptor pairs for different disease states |
| Ligand | Receptor | LRpair | Pathway | Tissue | Disease Stage |
| Page: 1 |
Top |
Single-cell gene regulatory network inference analysis |
| Find out the significant the regulons (TFs) and the target genes of each regulon across cell types for different disease states |
| TF | Cell Type | Tissue | Disease Stage | Target Gene | RSS | Regulon Activity |
| ∗The dot plots of a searched regulon are shown for all cell subpopulations in each disease state of each tissue based on the regulon specific score inferred using pySCENIC and by calculating the average expression. |
| Page: 1 |
Top |
Somatic mutation of malignant transformation related genes |
| Annotation of somatic variants for genes involved in malignant transformation |
| Hugo Symbol | Variant Class | Variant Classification | dbSNP RS | HGVSc | HGVSp | HGVSp Short | SWISSPROT | BIOTYPE | SIFT | PolyPhen | Tumor Sample Barcode | Tissue | Histology | Sex | Age | Stage | Therapy Types | Drugs | Outcome |
| CTDSPL | SNV | Missense_Mutation | novel | c.154G>A | p.Asp52Asn | p.D52N | O15194 | protein_coding | tolerated(0.55) | benign(0) | TCGA-5L-AAT1-01 | Breast | breast invasive carcinoma | Female | <65 | III/IV | Hormone Therapy | letrozol | SD |
| CTDSPL | SNV | Missense_Mutation | c.292N>A | p.Glu98Lys | p.E98K | O15194 | protein_coding | tolerated(0.17) | benign(0.139) | TCGA-BH-A0HP-01 | Breast | breast invasive carcinoma | Female | >=65 | III/IV | Chemotherapy | doxorubicin | SD | |
| CTDSPL | SNV | Missense_Mutation | novel | c.385N>C | p.Asp129His | p.D129H | O15194 | protein_coding | deleterious(0) | probably_damaging(0.999) | TCGA-D8-A4Z1-01 | Breast | breast invasive carcinoma | Female | >=65 | I/II | Hormone Therapy | tamoxiphen | SD |
| CTDSPL | SNV | Missense_Mutation | c.166G>C | p.Glu56Gln | p.E56Q | O15194 | protein_coding | tolerated(0.2) | benign(0.043) | TCGA-EW-A1J5-01 | Breast | breast invasive carcinoma | Female | <65 | I/II | Chemotherapy | adriamycin | SD | |
| CTDSPL | SNV | Missense_Mutation | c.415N>G | p.Thr139Ala | p.T139A | O15194 | protein_coding | deleterious(0.03) | benign(0.097) | TCGA-AA-3811-01 | Colorectum | colon adenocarcinoma | Female | >=65 | III/IV | Unknown | Unknown | PD | |
| CTDSPL | SNV | Missense_Mutation | novel | c.226N>T | p.Leu76Phe | p.L76F | O15194 | protein_coding | tolerated(0.16) | benign(0.001) | TCGA-AA-3984-01 | Colorectum | colon adenocarcinoma | Female | <65 | I/II | Unknown | Unknown | SD |
| CTDSPL | SNV | Missense_Mutation | c.485N>G | p.Phe162Cys | p.F162C | O15194 | protein_coding | deleterious(0) | probably_damaging(1) | TCGA-CA-6718-01 | Colorectum | colon adenocarcinoma | Male | <65 | I/II | Unknown | Unknown | PD | |
| CTDSPL | SNV | Missense_Mutation | rs370003443 | c.551N>A | p.Arg184His | p.R184H | O15194 | protein_coding | deleterious(0.03) | possibly_damaging(0.571) | TCGA-CM-4746-01 | Colorectum | colon adenocarcinoma | Male | <65 | I/II | Unknown | Unknown | SD |
| CTDSPL | SNV | Missense_Mutation | rs567415488 | c.94N>A | p.Val32Ile | p.V32I | O15194 | protein_coding | tolerated(0.3) | benign(0) | TCGA-A5-A1OF-01 | Endometrium | uterine corpus endometrioid carcinoma | Female | <65 | I/II | Unknown | Unknown | SD |
| CTDSPL | SNV | Missense_Mutation | rs747525595 | c.152G>A | p.Arg51His | p.R51H | O15194 | protein_coding | tolerated(0.11) | benign(0.02) | TCGA-AJ-A3BG-01 | Endometrium | uterine corpus endometrioid carcinoma | Female | >=65 | I/II | Chemotherapy | carboplatin | PD |
| Page: 1 2 3 |
Top |
Related drugs of malignant transformation related genes |
| Identification of chemicals and drugs interact with genes involved in malignant transfromation |
| (DGIdb 4.0) |
| Entrez ID | Symbol | Category | Interaction Types | Drug Claim Name | Drug Name | PMIDs |
| Page: 1 |

Copyright 2023-Present -The University of Texas Health Science Center at Houston |