
|
|||||
|
 | |
| |
| |
| |
| |
| |
|
Gene: COL1A1 |
Gene summary for COL1A1 |
| Gene information | Species | Human | Gene symbol | COL1A1 | Gene ID | 1277 |
| Gene name | collagen type I alpha 1 chain | |
| Gene Alias | CAFYD | |
| Cytomap | 17q21.33 | |
| Gene Type | protein-coding | GO ID | GO:0000302 | UniProtAcc | P02452 |
Top |
Malignant transformation analysis |
| Identification of the aberrant gene expression in precancerous and cancerous lesions by comparing the gene expression of stem-like cells in diseased tissues with normal stem cells |
| Entrez ID | Symbol | Replicates | Species | Organ | Tissue | Adj P-value | Log2FC | Malignancy |
| 1277 | COL1A1 | GSM4909291 | Human | Breast | IDC | 4.13e-26 | 6.68e-01 | 0.1753 |
| 1277 | COL1A1 | GSM4909296 | Human | Breast | IDC | 1.34e-03 | 2.71e-01 | 0.1524 |
| 1277 | COL1A1 | GSM4909302 | Human | Breast | IDC | 4.86e-86 | 1.33e+00 | 0.1545 |
| 1277 | COL1A1 | GSM4909308 | Human | Breast | IDC | 3.36e-03 | 2.06e-01 | 0.158 |
| 1277 | COL1A1 | P2 | Human | Breast | IDC | 1.09e-02 | 3.05e-01 | 0.21 |
| 1277 | COL1A1 | N_HPV_2 | Human | Cervix | N_HPV | 5.70e-05 | 3.41e-01 | -0.0131 |
| 1277 | COL1A1 | CCII_1 | Human | Cervix | CC | 1.34e-03 | 2.30e-01 | 0.3249 |
| 1277 | COL1A1 | sample1 | Human | Cervix | CC | 2.12e-05 | 4.26e-01 | 0.0959 |
| 1277 | COL1A1 | H2 | Human | Cervix | HSIL_HPV | 3.38e-03 | 2.63e-01 | 0.0632 |
| 1277 | COL1A1 | T1 | Human | Cervix | CC | 1.02e-16 | 5.18e-01 | 0.0918 |
| 1277 | COL1A1 | AEH-subject1 | Human | Endometrium | AEH | 9.32e-37 | -1.08e+00 | -0.3059 |
| 1277 | COL1A1 | AEH-subject2 | Human | Endometrium | AEH | 4.74e-30 | -1.06e+00 | -0.2525 |
| 1277 | COL1A1 | AEH-subject3 | Human | Endometrium | AEH | 5.88e-36 | -1.07e+00 | -0.2576 |
| 1277 | COL1A1 | AEH-subject4 | Human | Endometrium | AEH | 8.24e-03 | -4.44e-01 | -0.2657 |
| 1277 | COL1A1 | AEH-subject5 | Human | Endometrium | AEH | 4.00e-52 | -1.27e+00 | -0.2953 |
| 1277 | COL1A1 | EEC-subject1 | Human | Endometrium | EEC | 2.19e-38 | -1.16e+00 | -0.2682 |
| 1277 | COL1A1 | EEC-subject2 | Human | Endometrium | EEC | 1.74e-54 | -1.21e+00 | -0.2607 |
| 1277 | COL1A1 | EEC-subject3 | Human | Endometrium | EEC | 1.41e-61 | -1.25e+00 | -0.2525 |
| 1277 | COL1A1 | EEC-subject4 | Human | Endometrium | EEC | 3.33e-42 | -1.15e+00 | -0.2571 |
| 1277 | COL1A1 | EEC-subject5 | Human | Endometrium | EEC | 2.18e-47 | -1.19e+00 | -0.249 |
| Page: 1 2 3 4 5 6 7 |
| Tissue | Expression Dynamics | Abbreviation |
| Breast | 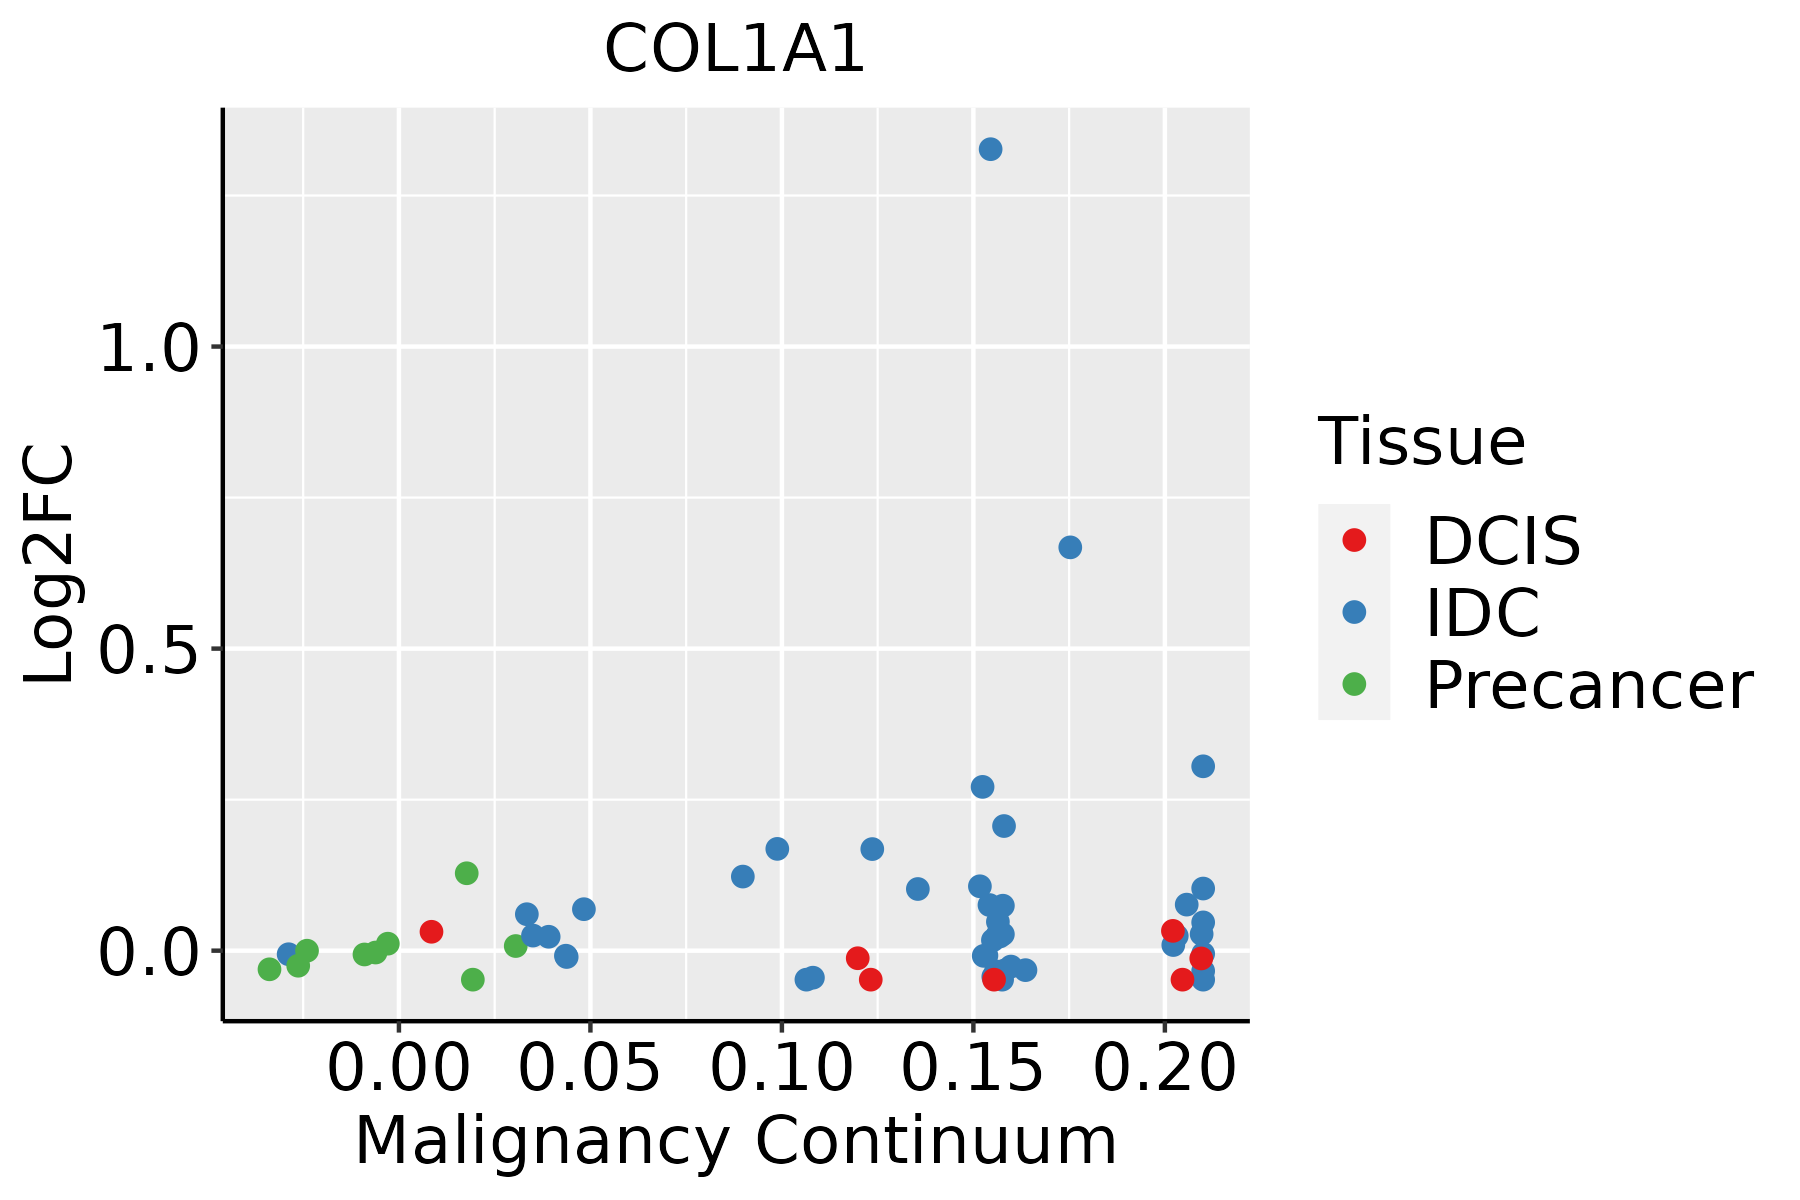 | IDC: Invasive ductal carcinoma |
| DCIS: Ductal carcinoma in situ | ||
| Precancer(BRCA1-mut): Precancerous lesion from BRCA1 mutation carriers | ||
| Cervix |  | CC: Cervix cancer |
| HSIL_HPV: HPV-infected high-grade squamous intraepithelial lesions | ||
| N_HPV: HPV-infected normal cervix | ||
| Endometrium |  | AEH: Atypical endometrial hyperplasia |
| EEC: Endometrioid Cancer | ||
| Esophagus |  | ESCC: Esophageal squamous cell carcinoma |
| HGIN: High-grade intraepithelial neoplasias | ||
| LGIN: Low-grade intraepithelial neoplasias | ||
| Liver |  | HCC: Hepatocellular carcinoma |
| NAFLD: Non-alcoholic fatty liver disease | ||
| Oral Cavity | 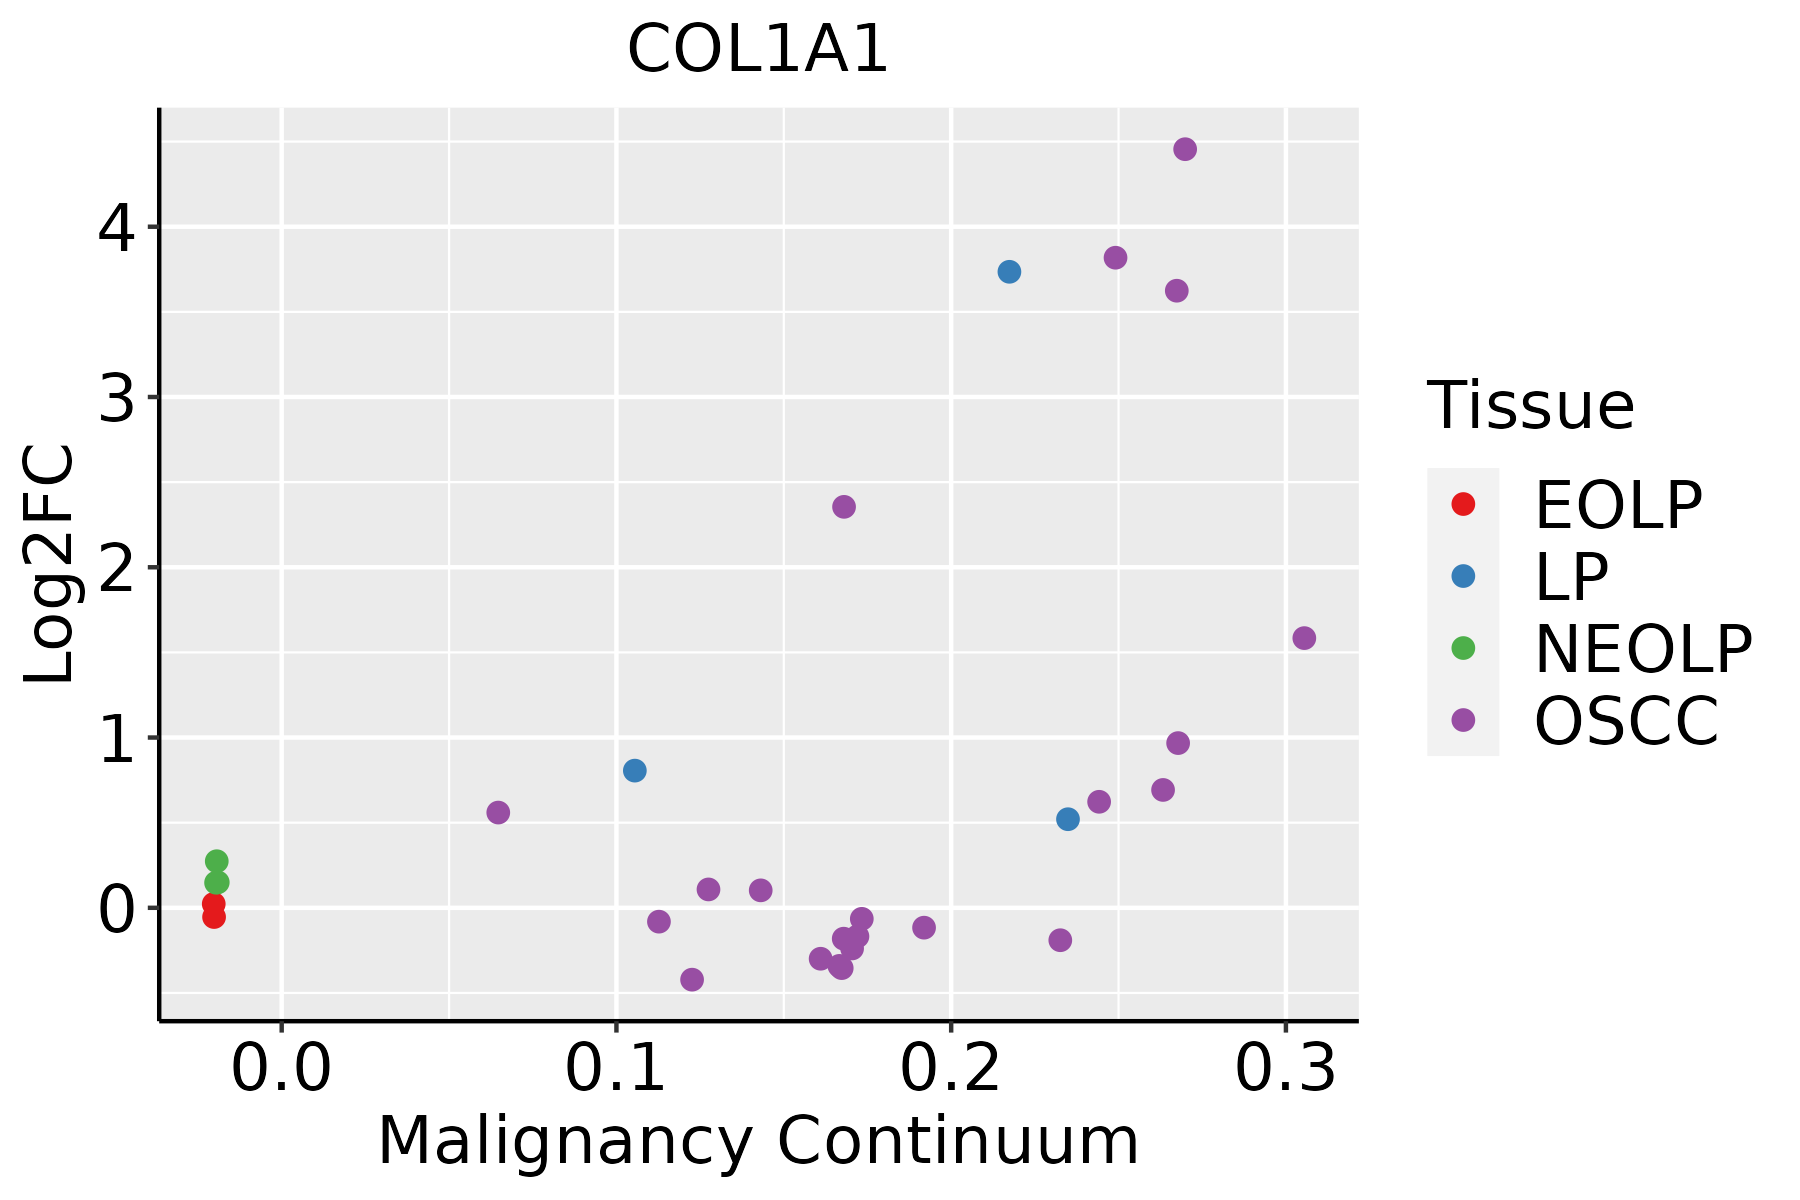 | EOLP: Erosive Oral lichen planus |
| LP: leukoplakia | ||
| NEOLP: Non-erosive oral lichen planus | ||
| OSCC: Oral squamous cell carcinoma | ||
| Skin | 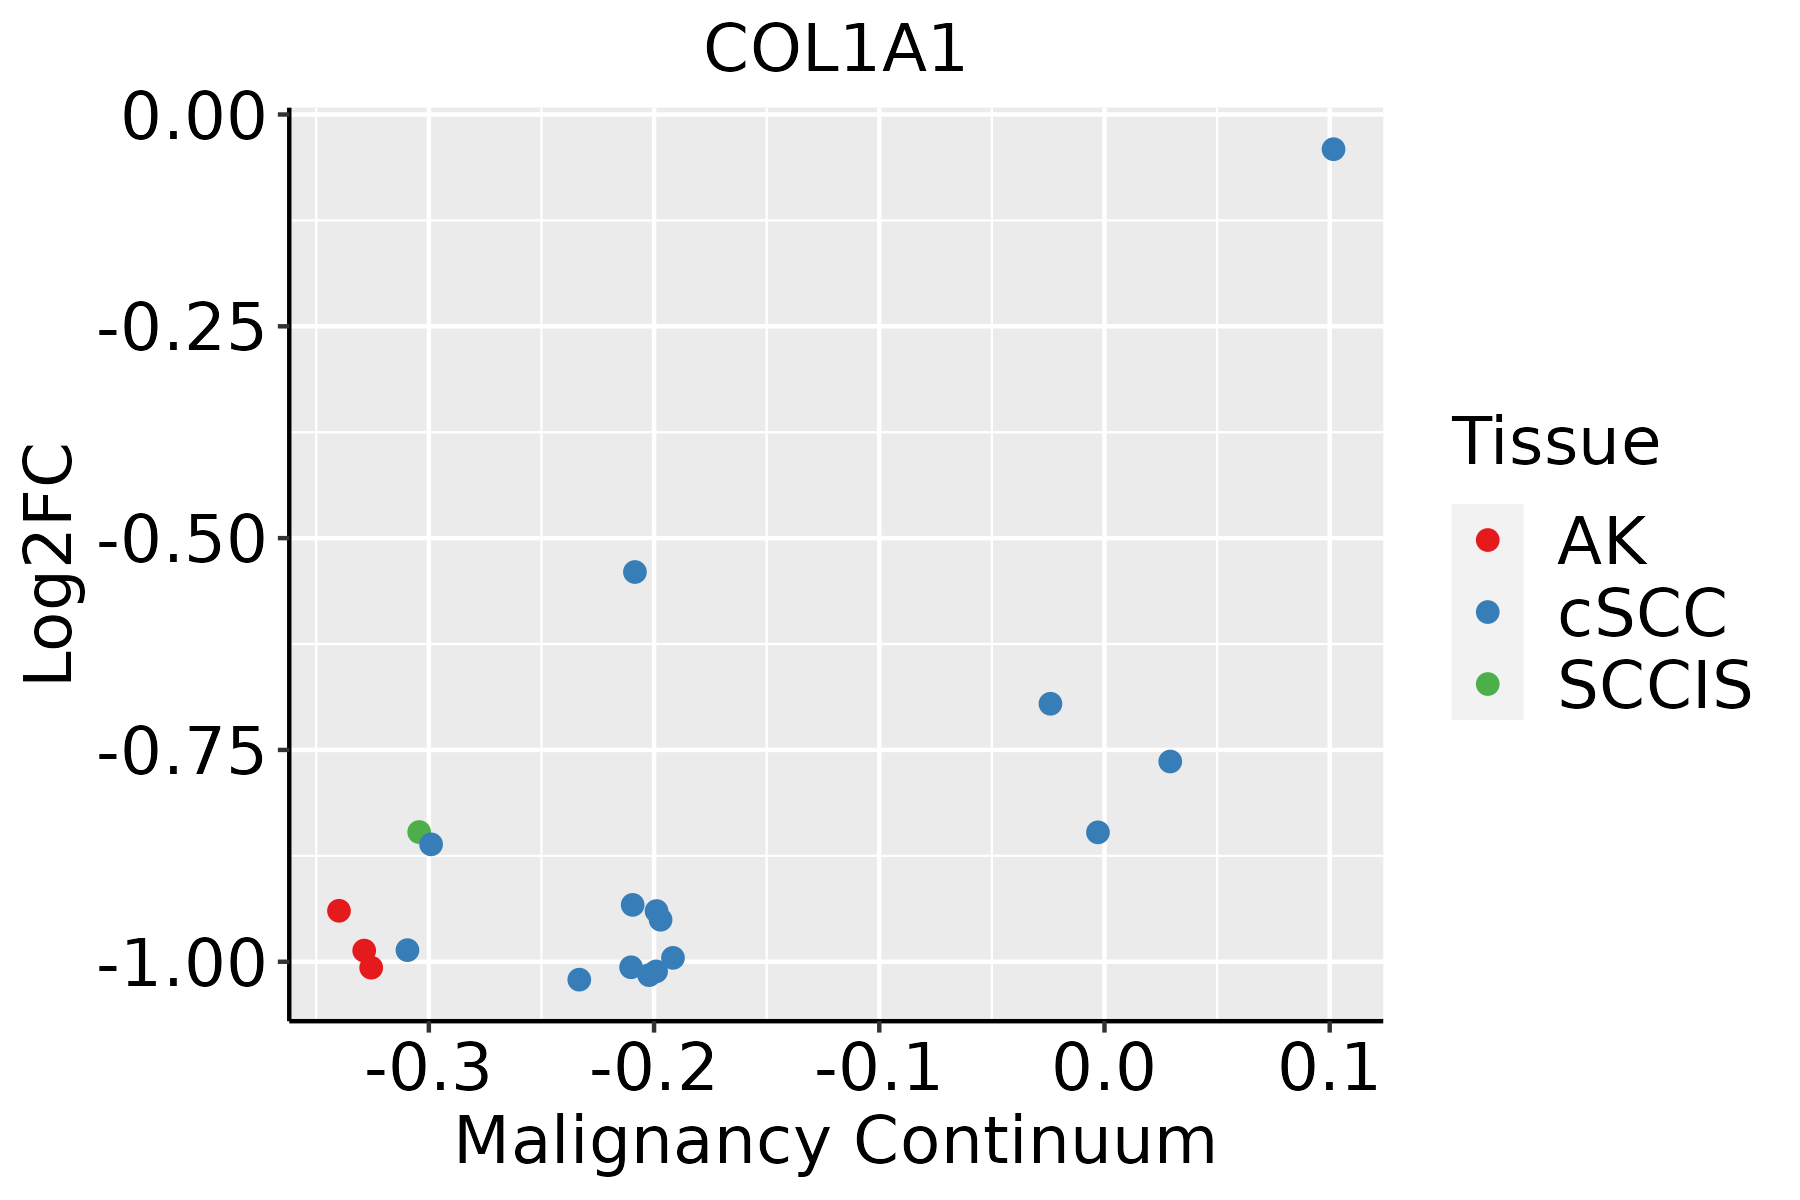 | AK: Actinic keratosis |
| cSCC: Cutaneous squamous cell carcinoma | ||
| SCCIS:squamous cell carcinoma in situ | ||
| Thyroid | 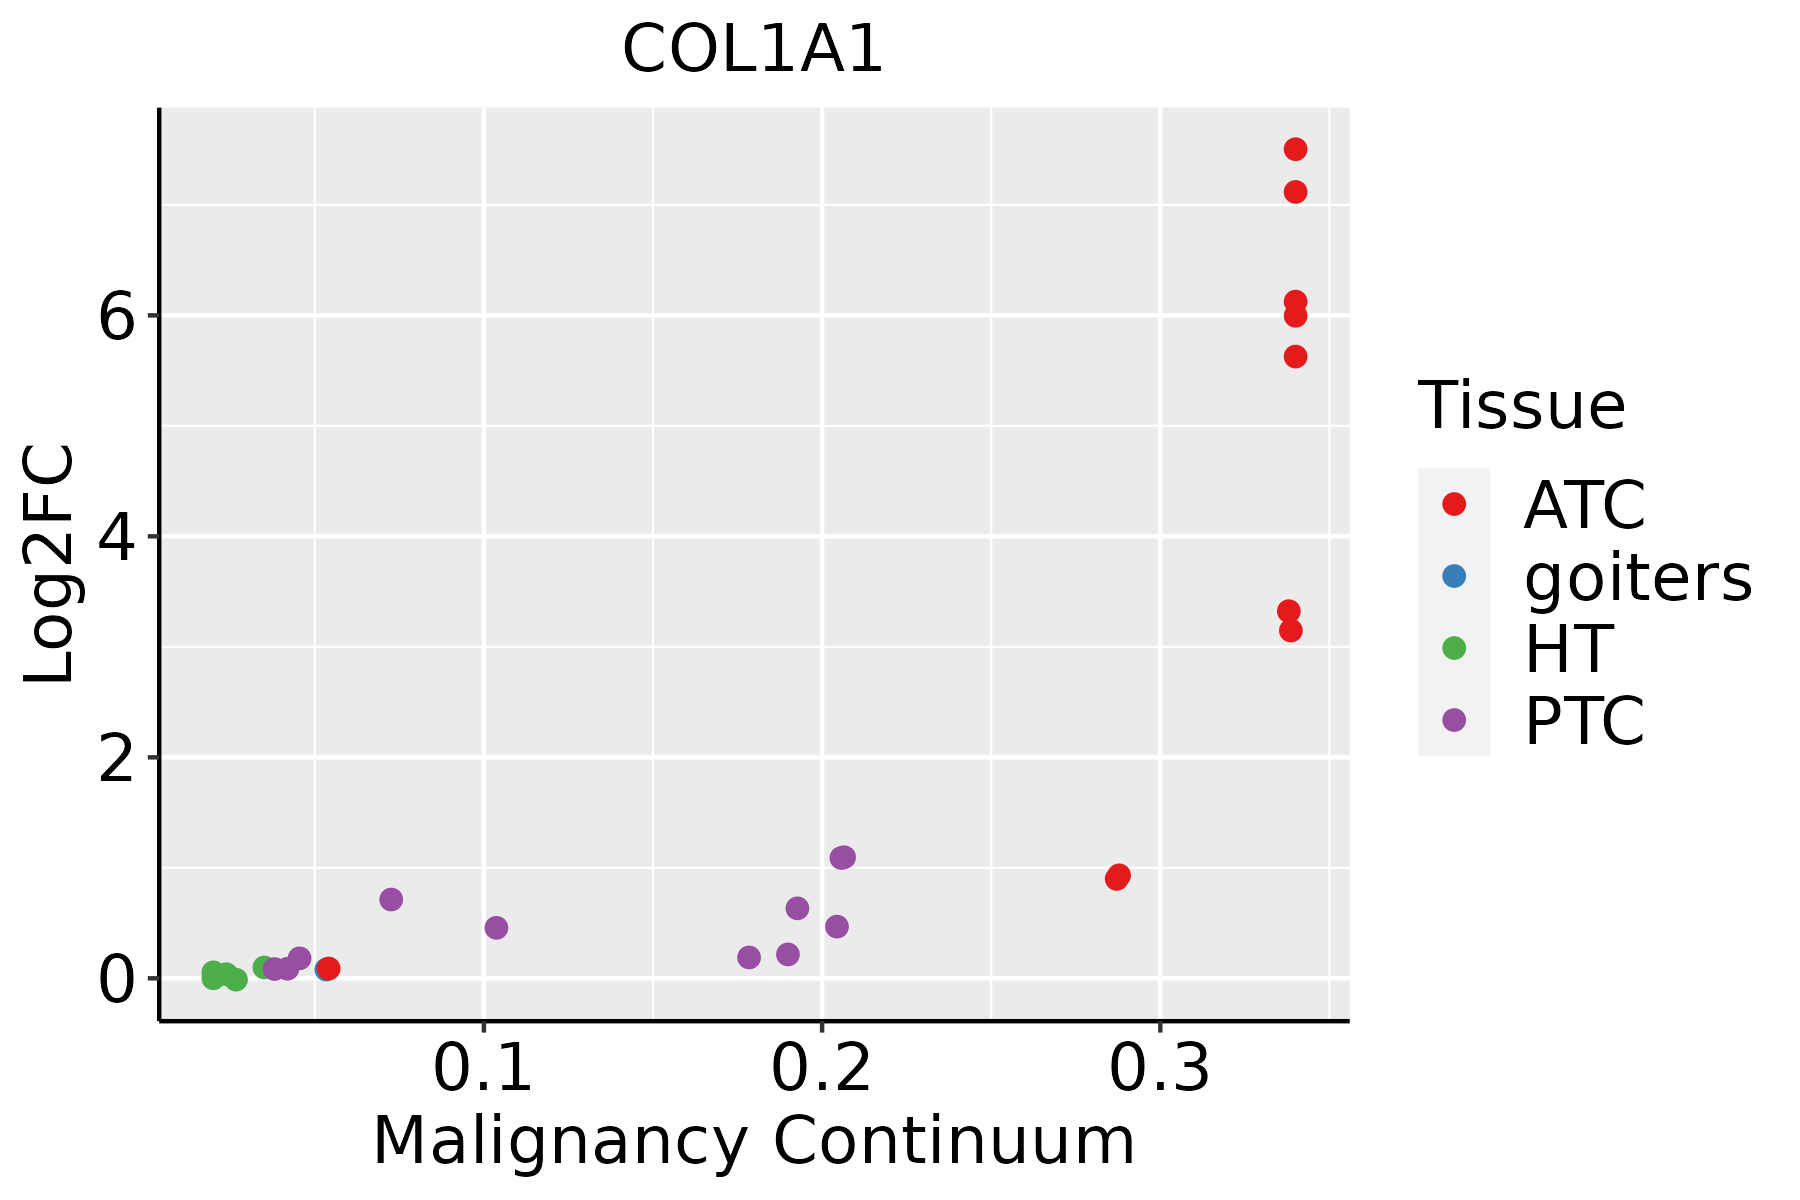 | ATC: Anaplastic thyroid cancer |
| HT: Hashimoto's thyroiditis | ||
| PTC: Papillary thyroid cancer |
| ∗log2FC in expression of this searched gene in stem-like cells from each diseased tissue sample relative to stem-like cells in normal samples in each tissue plotted against the malignancy continuum. Samples are colored based on if they are from different disease stage. |
Top |
Malignant transformation related pathway analysis |
| Find out the enriched GO biological processes and KEGG pathways involved in transition from healthy to precancer to cancer |
| Tissue | Disease Stage | Enriched GO biological Processes |
| Colorectum | AD |  |
| Colorectum | SER |  |
| Colorectum | MSS |  |
| Colorectum | MSI-H |  |
| Colorectum | FAP |  |
| ∗Top 15 enriched GO BP terms are showed in the bar plot of each disease state in each tissue. Each row represents a significant GO biological process which is colored according to the -log10(p.adjust). |
| Page: 1 2 3 4 5 6 7 8 9 |
| GO ID | Tissue | Disease Stage | Description | Gene Ratio | Bg Ratio | pvalue | p.adjust | Count |
| GO:004358814 | Endometrium | EEC | skin development | 45/2168 | 263/18723 | 4.69e-03 | 2.99e-02 | 45 |
| GO:00075847 | Endometrium | EEC | response to nutrient | 32/2168 | 174/18723 | 5.35e-03 | 3.31e-02 | 32 |
| GO:00362961 | Endometrium | EEC | response to increased oxygen levels | 9/2168 | 30/18723 | 5.44e-03 | 3.32e-02 | 9 |
| GO:001407415 | Endometrium | EEC | response to purine-containing compound | 28/2168 | 148/18723 | 5.93e-03 | 3.54e-02 | 28 |
| GO:00301991 | Endometrium | EEC | collagen fibril organization | 14/2168 | 61/18723 | 8.76e-03 | 4.74e-02 | 14 |
| GO:0006979111 | Esophagus | ESCC | response to oxidative stress | 303/8552 | 446/18723 | 7.15e-22 | 1.30e-19 | 303 |
| GO:003450418 | Esophagus | ESCC | protein localization to nucleus | 211/8552 | 290/18723 | 4.06e-21 | 6.60e-19 | 211 |
| GO:0071496111 | Esophagus | ESCC | cellular response to external stimulus | 215/8552 | 320/18723 | 4.29e-15 | 2.43e-13 | 215 |
| GO:0031668111 | Esophagus | ESCC | cellular response to extracellular stimulus | 168/8552 | 246/18723 | 4.93e-13 | 2.23e-11 | 168 |
| GO:0031669110 | Esophagus | ESCC | cellular response to nutrient levels | 148/8552 | 215/18723 | 4.58e-12 | 1.76e-10 | 148 |
| GO:0031667111 | Esophagus | ESCC | response to nutrient levels | 289/8552 | 474/18723 | 9.25e-12 | 3.47e-10 | 289 |
| GO:0000302111 | Esophagus | ESCC | response to reactive oxygen species | 150/8552 | 222/18723 | 3.06e-11 | 1.02e-09 | 150 |
| GO:0070482111 | Esophagus | ESCC | response to oxygen levels | 218/8552 | 347/18723 | 6.91e-11 | 2.17e-09 | 218 |
| GO:001605517 | Esophagus | ESCC | Wnt signaling pathway | 268/8552 | 444/18723 | 2.32e-10 | 6.58e-09 | 268 |
| GO:019873817 | Esophagus | ESCC | cell-cell signaling by wnt | 269/8552 | 446/18723 | 2.41e-10 | 6.79e-09 | 269 |
| GO:007121419 | Esophagus | ESCC | cellular response to abiotic stimulus | 206/8552 | 331/18723 | 7.52e-10 | 1.88e-08 | 206 |
| GO:010400419 | Esophagus | ESCC | cellular response to environmental stimulus | 206/8552 | 331/18723 | 7.52e-10 | 1.88e-08 | 206 |
| GO:0042542111 | Esophagus | ESCC | response to hydrogen peroxide | 102/8552 | 146/18723 | 2.64e-09 | 5.81e-08 | 102 |
| GO:003158919 | Esophagus | ESCC | cell-substrate adhesion | 221/8552 | 363/18723 | 3.06e-09 | 6.62e-08 | 221 |
| GO:001081020 | Esophagus | ESCC | regulation of cell-substrate adhesion | 144/8552 | 221/18723 | 3.55e-09 | 7.45e-08 | 144 |
| Page: 1 2 3 4 5 6 7 8 9 10 11 12 13 14 15 16 17 18 19 20 21 22 23 24 25 26 27 28 29 30 31 32 33 34 35 36 37 38 39 40 41 42 43 |
| Pathway ID | Tissue | Disease Stage | Description | Gene Ratio | Bg Ratio | pvalue | p.adjust | qvalue | Count |
| hsa0541523 | Breast | IDC | Diabetic cardiomyopathy | 67/867 | 203/8465 | 3.17e-19 | 8.59e-18 | 6.43e-18 | 67 |
| hsa0520523 | Breast | IDC | Proteoglycans in cancer | 42/867 | 205/8465 | 7.69e-06 | 9.99e-05 | 7.48e-05 | 42 |
| hsa045109 | Breast | IDC | Focal adhesion | 32/867 | 203/8465 | 8.60e-03 | 4.23e-02 | 3.17e-02 | 32 |
| hsa0541533 | Breast | IDC | Diabetic cardiomyopathy | 67/867 | 203/8465 | 3.17e-19 | 8.59e-18 | 6.43e-18 | 67 |
| hsa0520533 | Breast | IDC | Proteoglycans in cancer | 42/867 | 205/8465 | 7.69e-06 | 9.99e-05 | 7.48e-05 | 42 |
| hsa0451013 | Breast | IDC | Focal adhesion | 32/867 | 203/8465 | 8.60e-03 | 4.23e-02 | 3.17e-02 | 32 |
| hsa0520516 | Cervix | CC | Proteoglycans in cancer | 60/1267 | 205/8465 | 9.13e-08 | 1.18e-06 | 7.00e-07 | 60 |
| hsa0451010 | Cervix | CC | Focal adhesion | 59/1267 | 203/8465 | 1.53e-07 | 1.84e-06 | 1.09e-06 | 59 |
| hsa051657 | Cervix | CC | Human papillomavirus infection | 74/1267 | 331/8465 | 1.70e-04 | 1.02e-03 | 6.03e-04 | 74 |
| hsa051465 | Cervix | CC | Amoebiasis | 29/1267 | 102/8465 | 3.31e-04 | 1.70e-03 | 1.01e-03 | 29 |
| hsa049265 | Cervix | CC | Relaxin signaling pathway | 30/1267 | 129/8465 | 7.92e-03 | 2.56e-02 | 1.51e-02 | 30 |
| hsa0520517 | Cervix | CC | Proteoglycans in cancer | 60/1267 | 205/8465 | 9.13e-08 | 1.18e-06 | 7.00e-07 | 60 |
| hsa0451014 | Cervix | CC | Focal adhesion | 59/1267 | 203/8465 | 1.53e-07 | 1.84e-06 | 1.09e-06 | 59 |
| hsa0516512 | Cervix | CC | Human papillomavirus infection | 74/1267 | 331/8465 | 1.70e-04 | 1.02e-03 | 6.03e-04 | 74 |
| hsa0514612 | Cervix | CC | Amoebiasis | 29/1267 | 102/8465 | 3.31e-04 | 1.70e-03 | 1.01e-03 | 29 |
| hsa0492613 | Cervix | CC | Relaxin signaling pathway | 30/1267 | 129/8465 | 7.92e-03 | 2.56e-02 | 1.51e-02 | 30 |
| hsa0541524 | Cervix | HSIL_HPV | Diabetic cardiomyopathy | 30/459 | 203/8465 | 4.38e-07 | 1.07e-05 | 8.64e-06 | 30 |
| hsa045124 | Cervix | HSIL_HPV | ECM-receptor interaction | 12/459 | 89/8465 | 2.95e-03 | 1.88e-02 | 1.52e-02 | 12 |
| hsa0451023 | Cervix | HSIL_HPV | Focal adhesion | 21/459 | 203/8465 | 3.24e-03 | 2.02e-02 | 1.63e-02 | 21 |
| hsa0541534 | Cervix | HSIL_HPV | Diabetic cardiomyopathy | 30/459 | 203/8465 | 4.38e-07 | 1.07e-05 | 8.64e-06 | 30 |
| Page: 1 2 3 4 5 6 7 |
Top |
Cell-cell communication analysis |
| Identification of potential cell-cell interactions between two cell types and their ligand-receptor pairs for different disease states |
| Ligand | Receptor | LRpair | Pathway | Tissue | Disease Stage |
| COL1A1 | ITGA1_ITGB1 | COL1A1_ITGA1_ITGB1 | COLLAGEN | Breast | ADJ |
| COL1A1 | ITGA2_ITGB1 | COL1A1_ITGA2_ITGB1 | COLLAGEN | Breast | ADJ |
| COL1A1 | CD44 | COL1A1_CD44 | COLLAGEN | Breast | ADJ |
| COL1A1 | SDC4 | COL1A1_SDC4 | COLLAGEN | Breast | ADJ |
| COL1A1 | ITGA1_ITGB1 | COL1A1_ITGA1_ITGB1 | COLLAGEN | Breast | DCIS |
| COL1A1 | ITGA2_ITGB1 | COL1A1_ITGA2_ITGB1 | COLLAGEN | Breast | DCIS |
| COL1A1 | CD44 | COL1A1_CD44 | COLLAGEN | Breast | DCIS |
| COL1A1 | SDC1 | COL1A1_SDC1 | COLLAGEN | Breast | DCIS |
| COL1A1 | SDC4 | COL1A1_SDC4 | COLLAGEN | Breast | DCIS |
| COL1A1 | ITGA1_ITGB1 | COL1A1_ITGA1_ITGB1 | COLLAGEN | Breast | Healthy |
| COL1A1 | ITGA2_ITGB1 | COL1A1_ITGA2_ITGB1 | COLLAGEN | Breast | Healthy |
| COL1A1 | ITGAV_ITGB8 | COL1A1_ITGAV_ITGB8 | COLLAGEN | Breast | Healthy |
| COL1A1 | CD44 | COL1A1_CD44 | COLLAGEN | Breast | Healthy |
| COL1A1 | SDC1 | COL1A1_SDC1 | COLLAGEN | Breast | Healthy |
| COL1A1 | SDC4 | COL1A1_SDC4 | COLLAGEN | Breast | Healthy |
| COL1A1 | ITGA1_ITGB1 | COL1A1_ITGA1_ITGB1 | COLLAGEN | Breast | IDC |
| COL1A1 | CD44 | COL1A1_CD44 | COLLAGEN | Breast | IDC |
| COL1A1 | SDC1 | COL1A1_SDC1 | COLLAGEN | Breast | IDC |
| COL1A1 | SDC4 | COL1A1_SDC4 | COLLAGEN | Breast | IDC |
| COL1A1 | ITGA1_ITGB1 | COL1A1_ITGA1_ITGB1 | COLLAGEN | Breast | Precancer |
| Page: 1 2 3 4 5 6 7 8 9 10 11 12 13 14 |
Top |
Single-cell gene regulatory network inference analysis |
| Find out the significant the regulons (TFs) and the target genes of each regulon across cell types for different disease states |
| TF | Cell Type | Tissue | Disease Stage | Target Gene | RSS | Regulon Activity |
| ∗The dot plots of a searched regulon are shown for all cell subpopulations in each disease state of each tissue based on the regulon specific score inferred using pySCENIC and by calculating the average expression. |
| Page: 1 |
Top |
Somatic mutation of malignant transformation related genes |
| Annotation of somatic variants for genes involved in malignant transformation |
| Hugo Symbol | Variant Class | Variant Classification | dbSNP RS | HGVSc | HGVSp | HGVSp Short | SWISSPROT | BIOTYPE | SIFT | PolyPhen | Tumor Sample Barcode | Tissue | Histology | Sex | Age | Stage | Therapy Types | Drugs | Outcome |
| COL1A1 | SNV | Missense_Mutation | novel | c.1591N>A | p.Glu531Lys | p.E531K | P02452 | protein_coding | deleterious(0.04) | benign(0.297) | TCGA-3C-AALI-01 | Breast | breast invasive carcinoma | Female | <65 | I/II | Unspecific | Poly E | Complete Response |
| COL1A1 | SNV | Missense_Mutation | c.1918C>A | p.Pro640Thr | p.P640T | P02452 | protein_coding | tolerated(0.26) | benign(0.011) | TCGA-A8-A075-01 | Breast | breast invasive carcinoma | Female | <65 | I/II | Chemotherapy | epirubicin | CR | |
| COL1A1 | SNV | Missense_Mutation | c.944N>T | p.Ala315Val | p.A315V | P02452 | protein_coding | deleterious(0.03) | benign(0.21) | TCGA-A8-A08X-01 | Breast | breast invasive carcinoma | Female | <65 | III/IV | Chemotherapy | doxorubicin | PD | |
| COL1A1 | SNV | Missense_Mutation | novel | c.2252N>G | p.Lys751Arg | p.K751R | P02452 | protein_coding | tolerated(0.31) | probably_damaging(0.998) | TCGA-A8-A08Z-01 | Breast | breast invasive carcinoma | Female | >=65 | III/IV | Unknown | Unknown | SD |
| COL1A1 | SNV | Missense_Mutation | novel | c.2390N>A | p.Gly797Asp | p.G797D | P02452 | protein_coding | deleterious(0.01) | benign(0.058) | TCGA-AN-A046-01 | Breast | breast invasive carcinoma | Female | >=65 | I/II | Unknown | Unknown | SD |
| COL1A1 | SNV | Missense_Mutation | novel | c.551C>G | p.Ser184Cys | p.S184C | P02452 | protein_coding | tolerated(0.06) | benign(0.371) | TCGA-BH-A0BP-01 | Breast | breast invasive carcinoma | Female | >=65 | I/II | Unknown | Unknown | SD |
| COL1A1 | SNV | Missense_Mutation | rs72648365 | c.1720C>T | p.Arg574Cys | p.R574C | P02452 | protein_coding | deleterious(0) | probably_damaging(0.996) | TCGA-BH-A0EE-01 | Breast | breast invasive carcinoma | Female | >=65 | I/II | Chemotherapy | docetaxel | SD |
| COL1A1 | SNV | Missense_Mutation | c.4145G>A | p.Gly1382Asp | p.G1382D | P02452 | protein_coding | deleterious(0.03) | probably_damaging(0.999) | TCGA-C8-A132-01 | Breast | breast invasive carcinoma | Female | <65 | I/II | Unknown | Unknown | SD | |
| COL1A1 | SNV | Missense_Mutation | rs72656322 | c.3460G>C | p.Gly1154Arg | p.G1154R | P02452 | protein_coding | deleterious(0) | probably_damaging(0.999) | TCGA-C8-A132-01 | Breast | breast invasive carcinoma | Female | <65 | I/II | Unknown | Unknown | SD |
| COL1A1 | SNV | Missense_Mutation | c.3217G>A | p.Gly1073Ser | p.G1073S | P02452 | protein_coding | deleterious(0.01) | probably_damaging(0.999) | TCGA-C8-A132-01 | Breast | breast invasive carcinoma | Female | <65 | I/II | Unknown | Unknown | SD |
| Page: 1 2 3 4 5 6 7 8 9 10 11 12 13 14 15 |
Top |
Related drugs of malignant transformation related genes |
| Identification of chemicals and drugs interact with genes involved in malignant transfromation |
| (DGIdb 4.0) |
| Entrez ID | Symbol | Category | Interaction Types | Drug Claim Name | Drug Name | PMIDs |
| 1277 | COL1A1 | CLINICALLY ACTIONABLE, DRUGGABLE GENOME | CHEMBL2108709 | COLLAGENASE CLOSTRIDIUM HISTOLYTICUM | ||
| 1277 | COL1A1 | CLINICALLY ACTIONABLE, DRUGGABLE GENOME | somatropin recombinant | 22026923 | ||
| 1277 | COL1A1 | CLINICALLY ACTIONABLE, DRUGGABLE GENOME | valproic acid | 26727275 | ||
| 1277 | COL1A1 | CLINICALLY ACTIONABLE, DRUGGABLE GENOME | CHEMBL2095222 | OCRIPLASMIN | ||
| 1277 | COL1A1 | CLINICALLY ACTIONABLE, DRUGGABLE GENOME | COLLAGENASE CLOSTRIDIUM HISTOLYTICUM | |||
| 1277 | COL1A1 | CLINICALLY ACTIONABLE, DRUGGABLE GENOME | COLLAGENASE CLOSTRIDIUM HISTOLYTICUM | |||
| 1277 | COL1A1 | CLINICALLY ACTIONABLE, DRUGGABLE GENOME | COLLAGENASE | COLLAGENASE CLOSTRIDIUM HISTOLYTICUM |
| Page: 1 |

Copyright 2023-Present -The University of Texas Health Science Center at Houston |