
|
|||||
|
 | |
| |
| |
| |
| |
| |
|
Gene: CDC42EP5 |
Gene summary for CDC42EP5 |
| Gene information | Species | Human | Gene symbol | CDC42EP5 | Gene ID | 148170 |
| Gene name | CDC42 effector protein 5 | |
| Gene Alias | Borg3 | |
| Cytomap | 19q13.42 | |
| Gene Type | protein-coding | GO ID | GO:0000165 | UniProtAcc | Q6NZY7 |
Top |
Malignant transformation analysis |
| Identification of the aberrant gene expression in precancerous and cancerous lesions by comparing the gene expression of stem-like cells in diseased tissues with normal stem cells |
| Entrez ID | Symbol | Replicates | Species | Organ | Tissue | Adj P-value | Log2FC | Malignancy |
| 148170 | CDC42EP5 | HTA11_2487_2000001011 | Human | Colorectum | SER | 1.32e-15 | 9.57e-01 | -0.1808 |
| 148170 | CDC42EP5 | HTA11_1938_2000001011 | Human | Colorectum | AD | 1.78e-03 | 5.84e-01 | -0.0811 |
| 148170 | CDC42EP5 | HTA11_347_2000001011 | Human | Colorectum | AD | 9.85e-31 | 1.00e+00 | -0.1954 |
| 148170 | CDC42EP5 | HTA11_411_2000001011 | Human | Colorectum | SER | 5.70e-11 | 1.49e+00 | -0.2602 |
| 148170 | CDC42EP5 | HTA11_2112_2000001011 | Human | Colorectum | SER | 4.34e-07 | 1.16e+00 | -0.2196 |
| 148170 | CDC42EP5 | HTA11_3361_2000001011 | Human | Colorectum | AD | 3.62e-09 | 7.48e-01 | -0.1207 |
| 148170 | CDC42EP5 | HTA11_83_2000001011 | Human | Colorectum | SER | 3.51e-02 | 5.25e-01 | -0.1526 |
| 148170 | CDC42EP5 | HTA11_696_2000001011 | Human | Colorectum | AD | 1.21e-29 | 9.48e-01 | -0.1464 |
| 148170 | CDC42EP5 | HTA11_866_2000001011 | Human | Colorectum | AD | 9.14e-11 | 5.94e-01 | -0.1001 |
| 148170 | CDC42EP5 | HTA11_1391_2000001011 | Human | Colorectum | AD | 1.76e-09 | 7.13e-01 | -0.059 |
| 148170 | CDC42EP5 | HTA11_2992_2000001011 | Human | Colorectum | SER | 1.08e-10 | 1.22e+00 | -0.1706 |
| 148170 | CDC42EP5 | HTA11_5212_2000001011 | Human | Colorectum | AD | 1.92e-05 | 7.86e-01 | -0.2061 |
| 148170 | CDC42EP5 | HTA11_5216_2000001011 | Human | Colorectum | SER | 3.10e-03 | 7.55e-01 | -0.1462 |
| 148170 | CDC42EP5 | HTA11_546_2000001011 | Human | Colorectum | AD | 4.60e-06 | 8.49e-01 | -0.0842 |
| 148170 | CDC42EP5 | HTA11_10711_2000001011 | Human | Colorectum | AD | 1.21e-02 | 5.43e-01 | 0.0338 |
| 148170 | CDC42EP5 | HTA11_7696_3000711011 | Human | Colorectum | AD | 5.25e-05 | 4.48e-01 | 0.0674 |
| 148170 | CDC42EP5 | HTA11_99999970781_79442 | Human | Colorectum | MSS | 1.57e-02 | -3.15e-01 | 0.294 |
| 148170 | CDC42EP5 | HTA11_99999974143_84620 | Human | Colorectum | MSS | 1.95e-10 | -4.50e-01 | 0.3005 |
| 148170 | CDC42EP5 | F007 | Human | Colorectum | FAP | 1.10e-03 | -2.67e-01 | 0.1176 |
| 148170 | CDC42EP5 | A001-C-207 | Human | Colorectum | FAP | 5.47e-04 | -2.25e-01 | 0.1278 |
| Page: 1 2 3 4 5 6 |
| Tissue | Expression Dynamics | Abbreviation |
| Colorectum (GSE201348) | 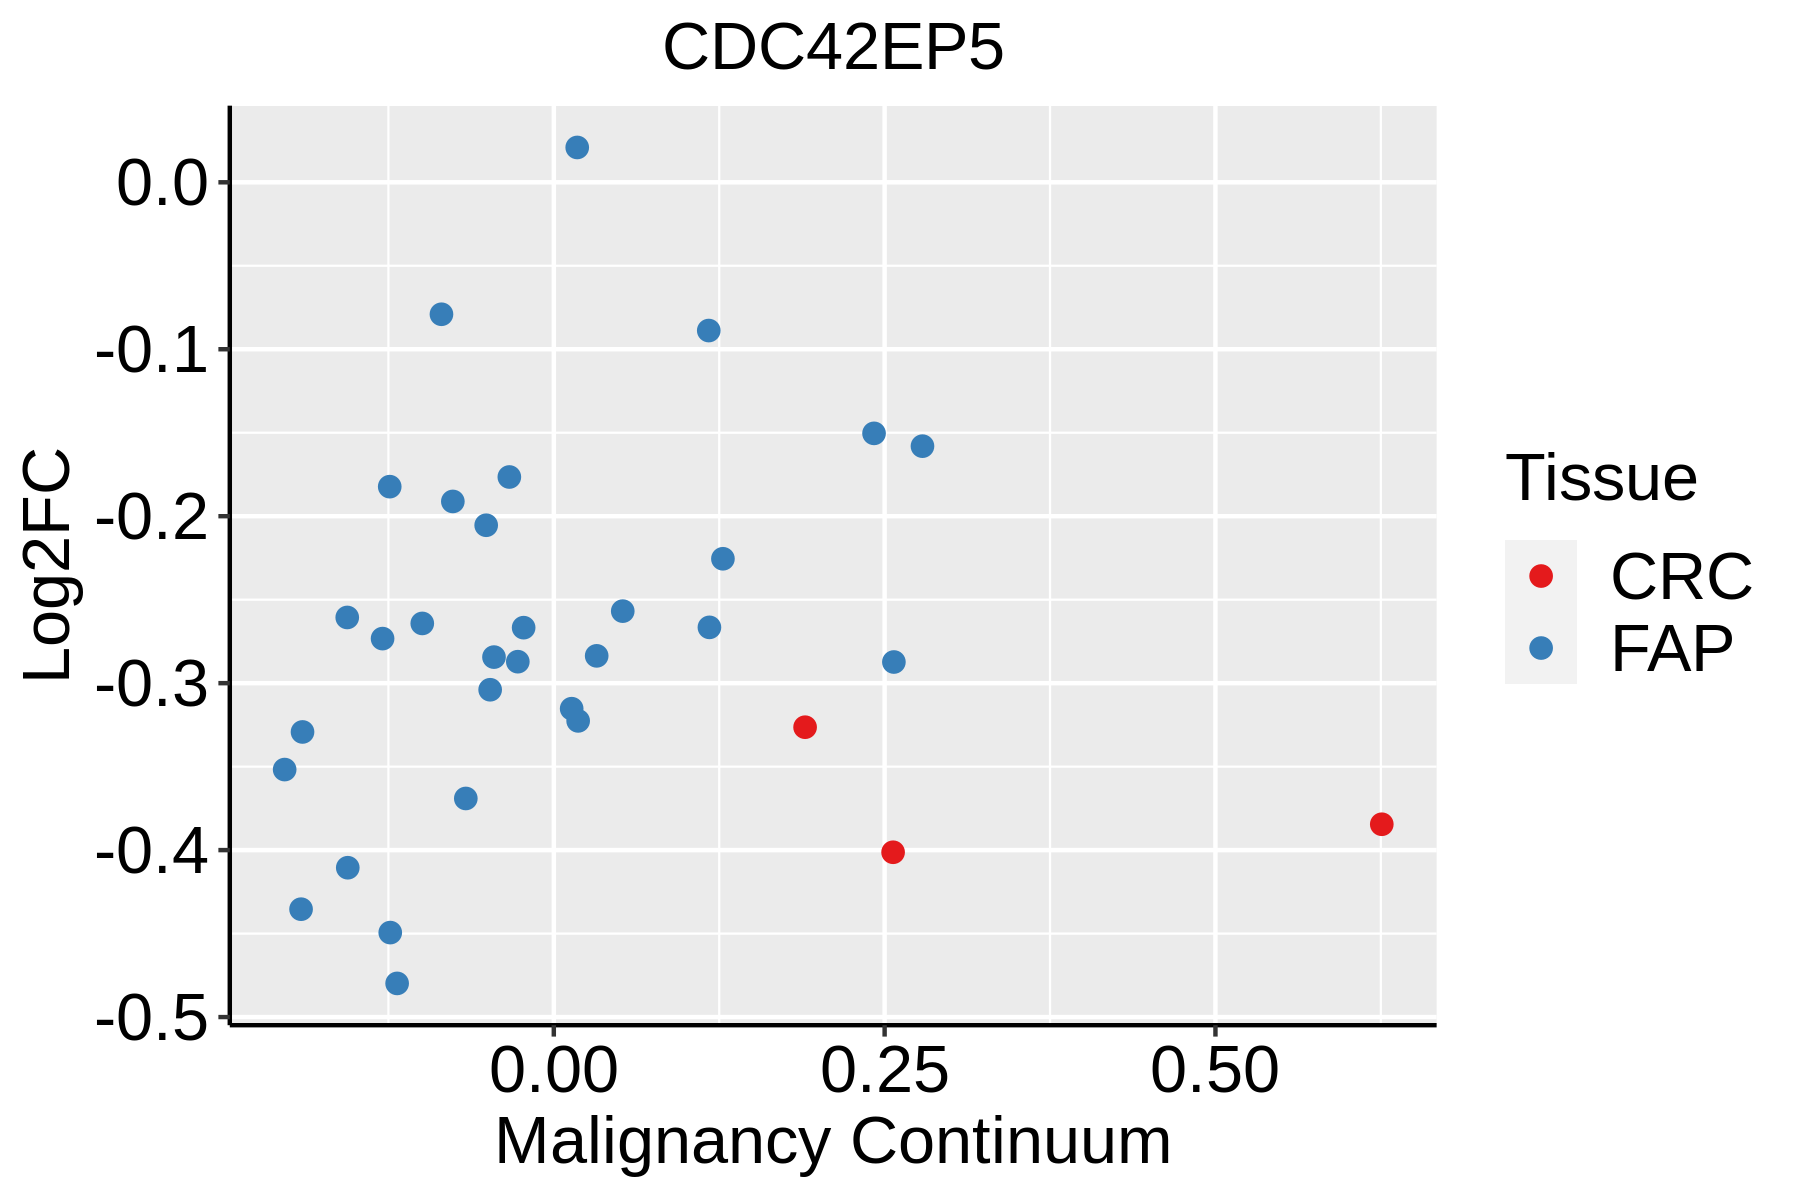 | FAP: Familial adenomatous polyposis |
| CRC: Colorectal cancer | ||
| Colorectum (HTA11) |  | AD: Adenomas |
| SER: Sessile serrated lesions | ||
| MSI-H: Microsatellite-high colorectal cancer | ||
| MSS: Microsatellite stable colorectal cancer | ||
| Esophagus | 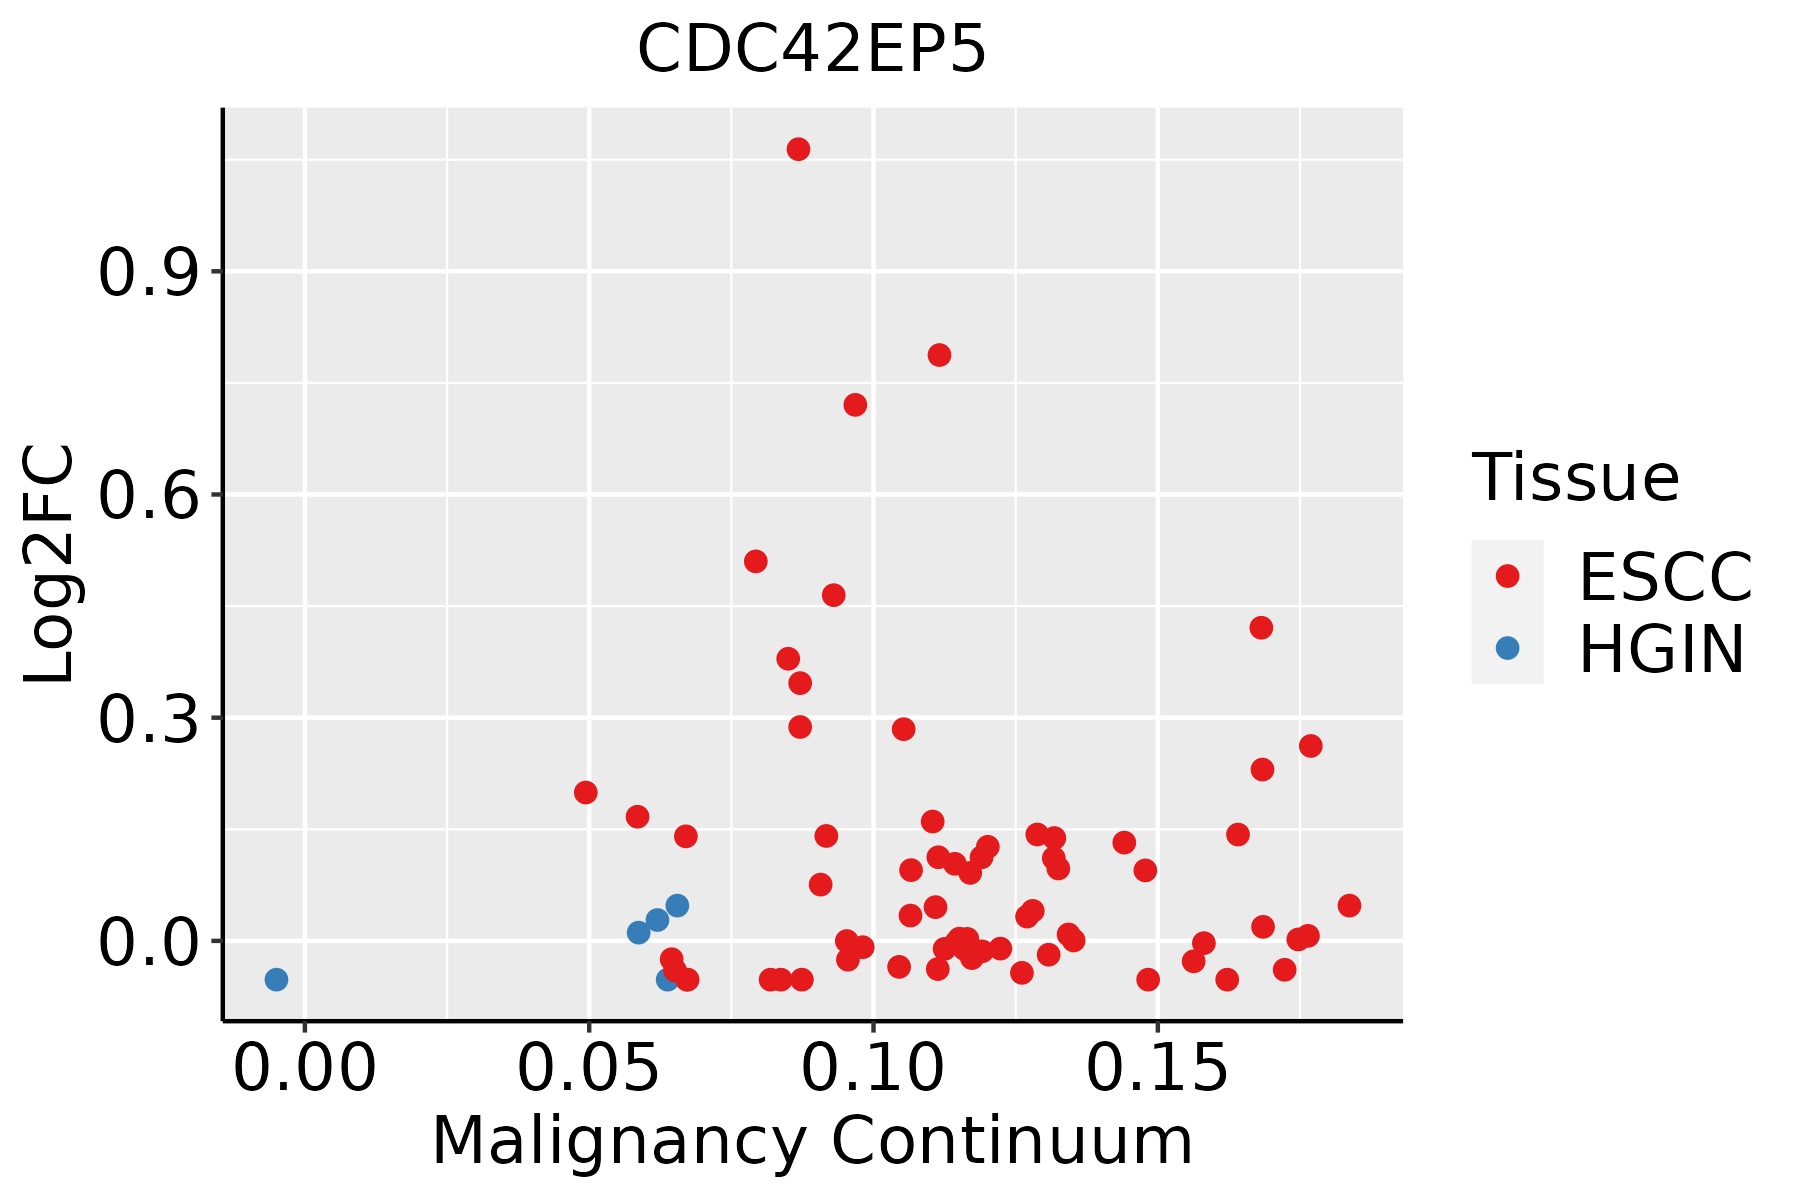 | ESCC: Esophageal squamous cell carcinoma |
| HGIN: High-grade intraepithelial neoplasias | ||
| LGIN: Low-grade intraepithelial neoplasias | ||
| GC | 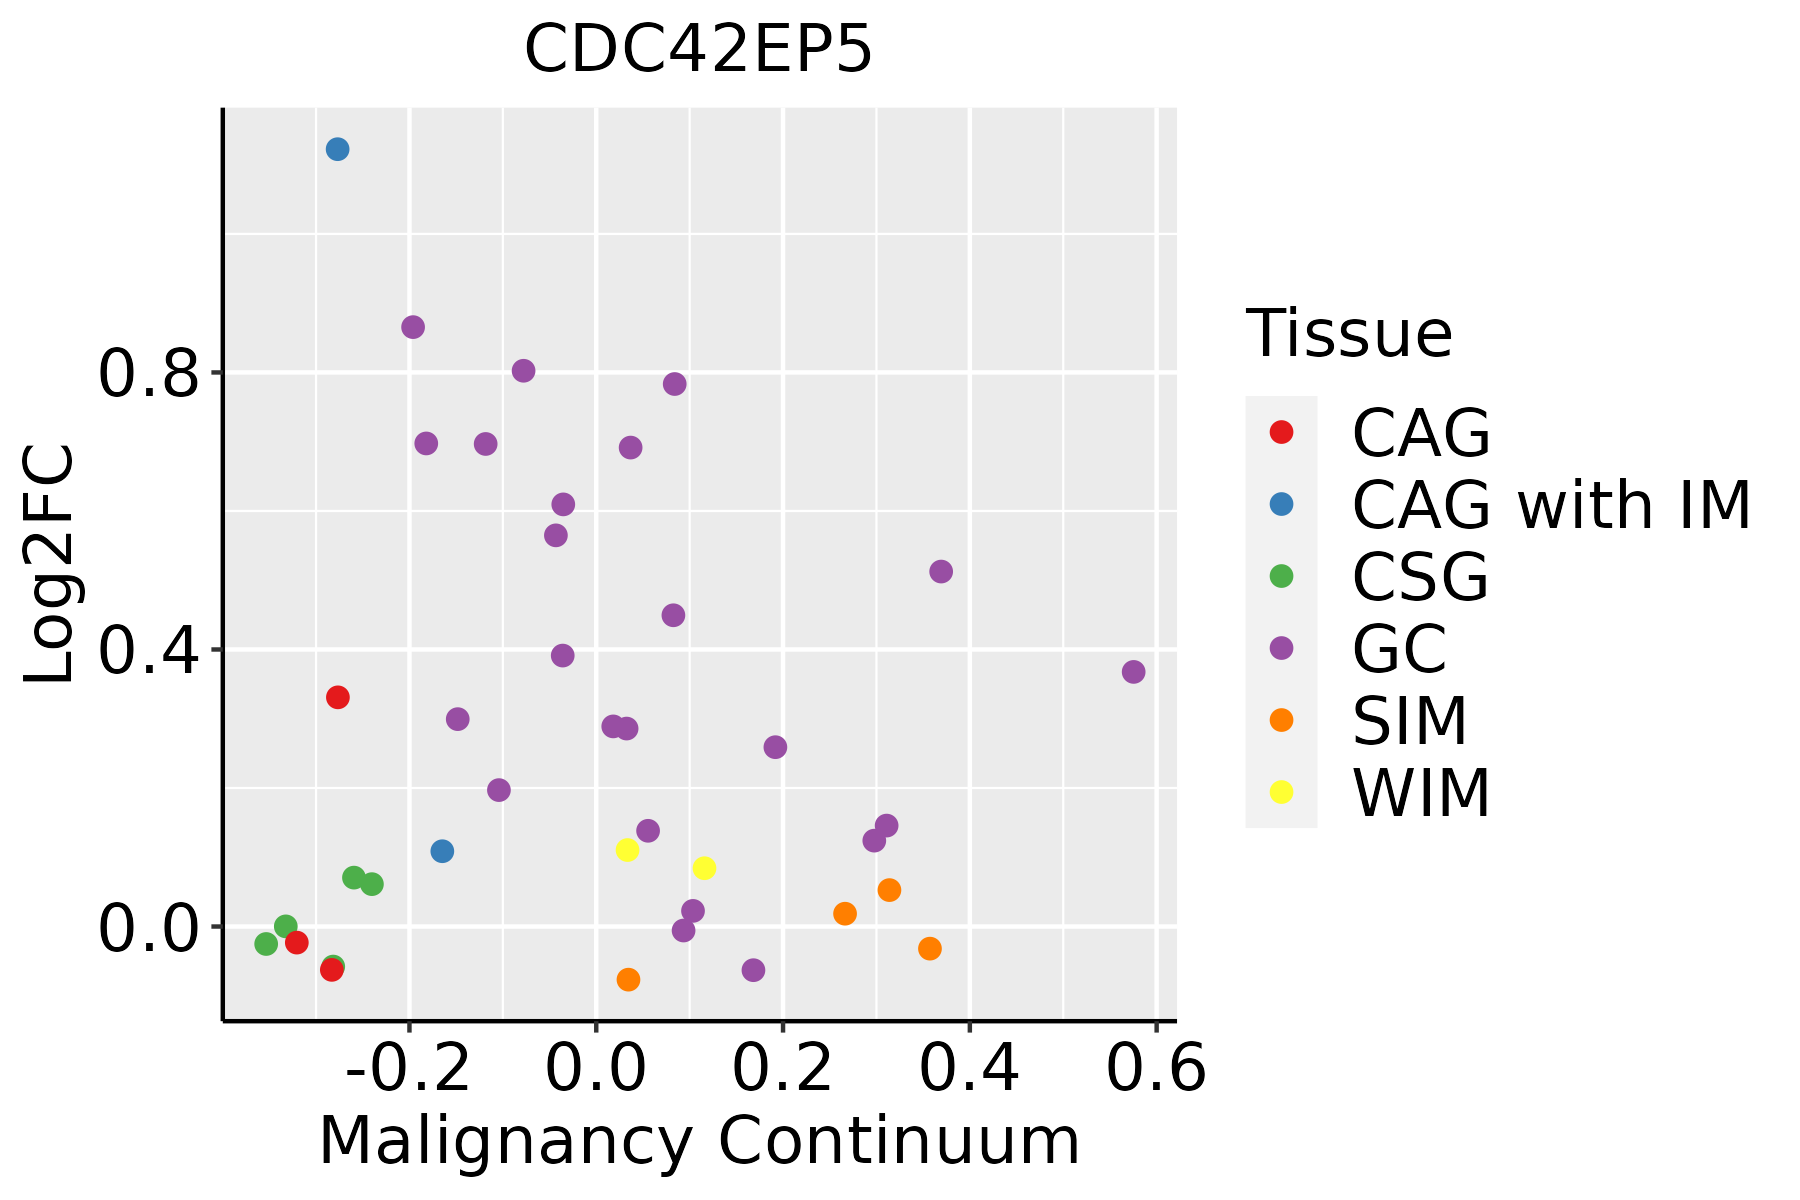 | CAG: Chronic atrophic gastritis |
| CAG with IM: Chronic atrophic gastritis with intestinal metaplasia | ||
| CSG: Chronic superficial gastritis | ||
| GC: Gastric cancer | ||
| SIM: Severe intestinal metaplasia | ||
| WIM: Wild intestinal metaplasia | ||
| Oral Cavity | 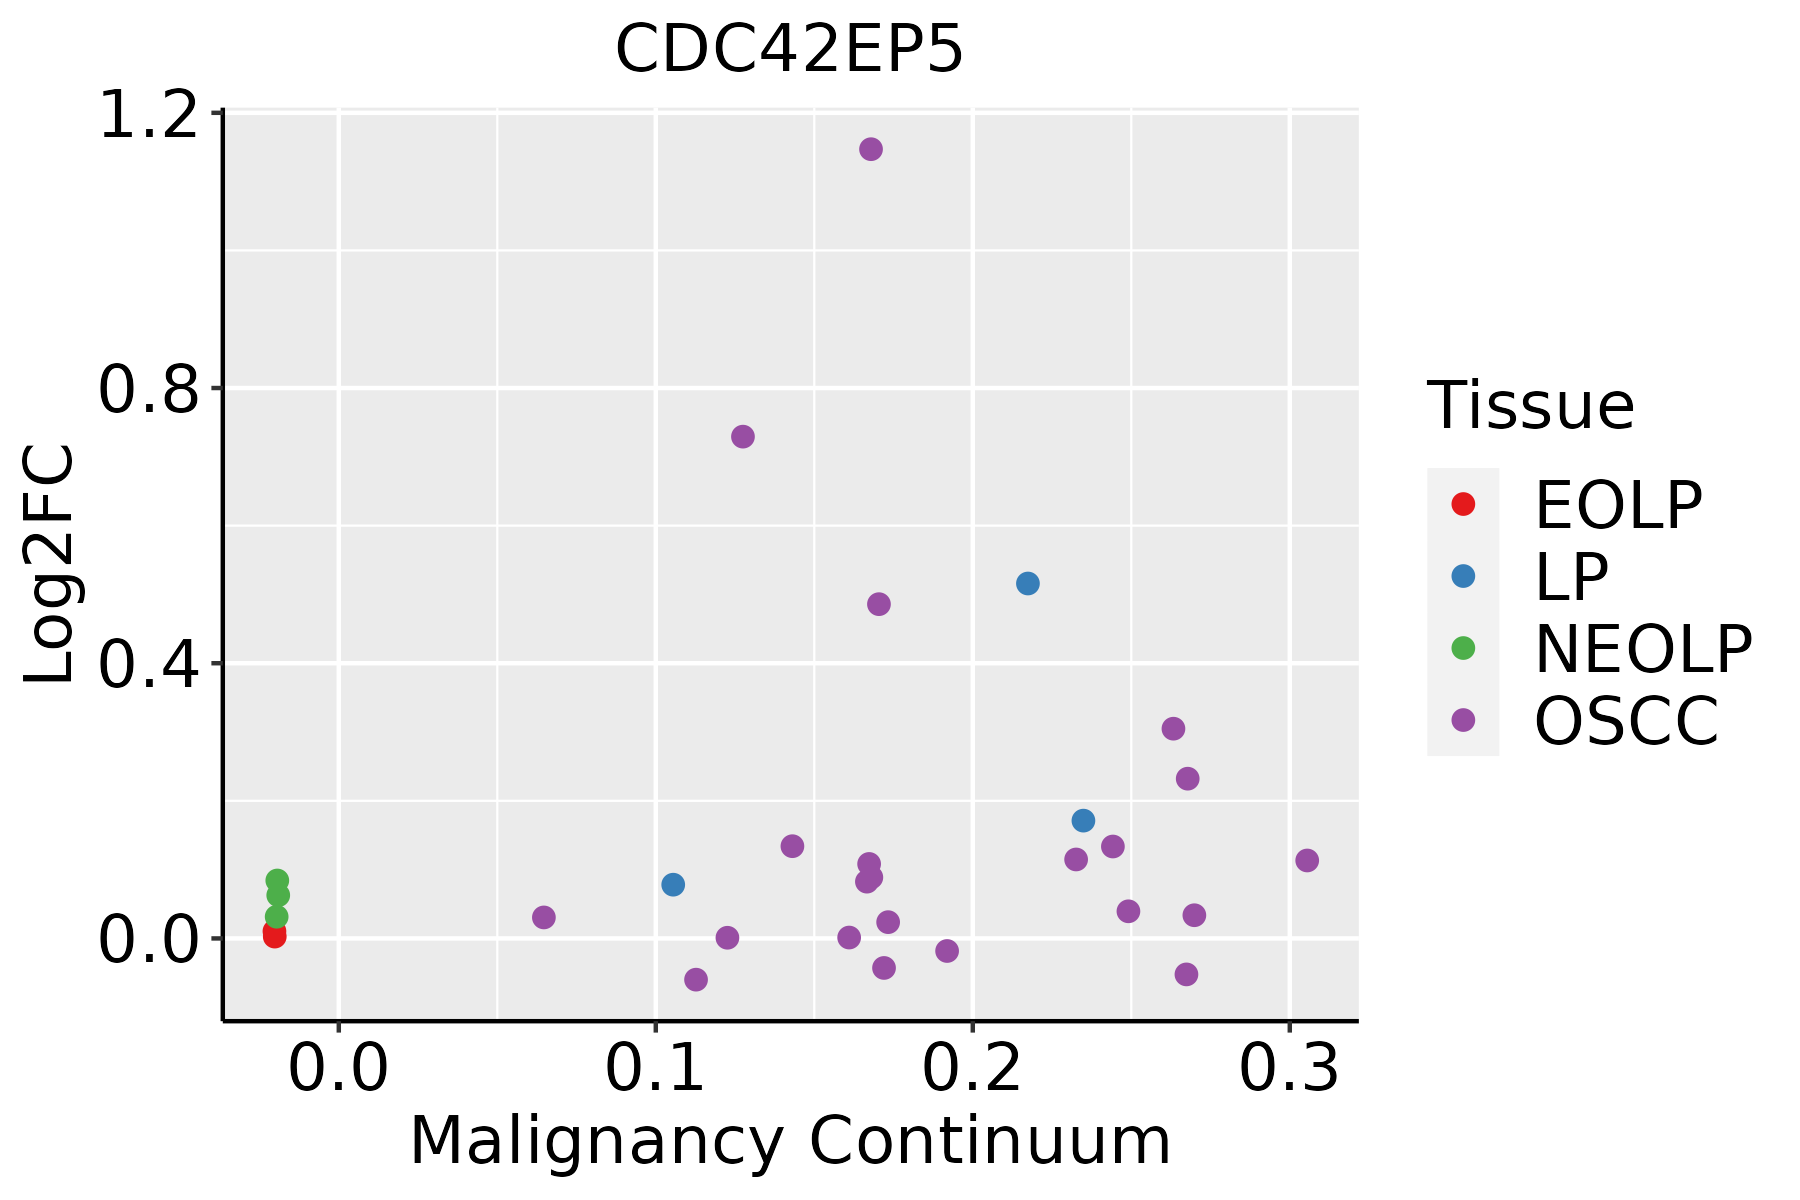 | EOLP: Erosive Oral lichen planus |
| LP: leukoplakia | ||
| NEOLP: Non-erosive oral lichen planus | ||
| OSCC: Oral squamous cell carcinoma | ||
| Thyroid | 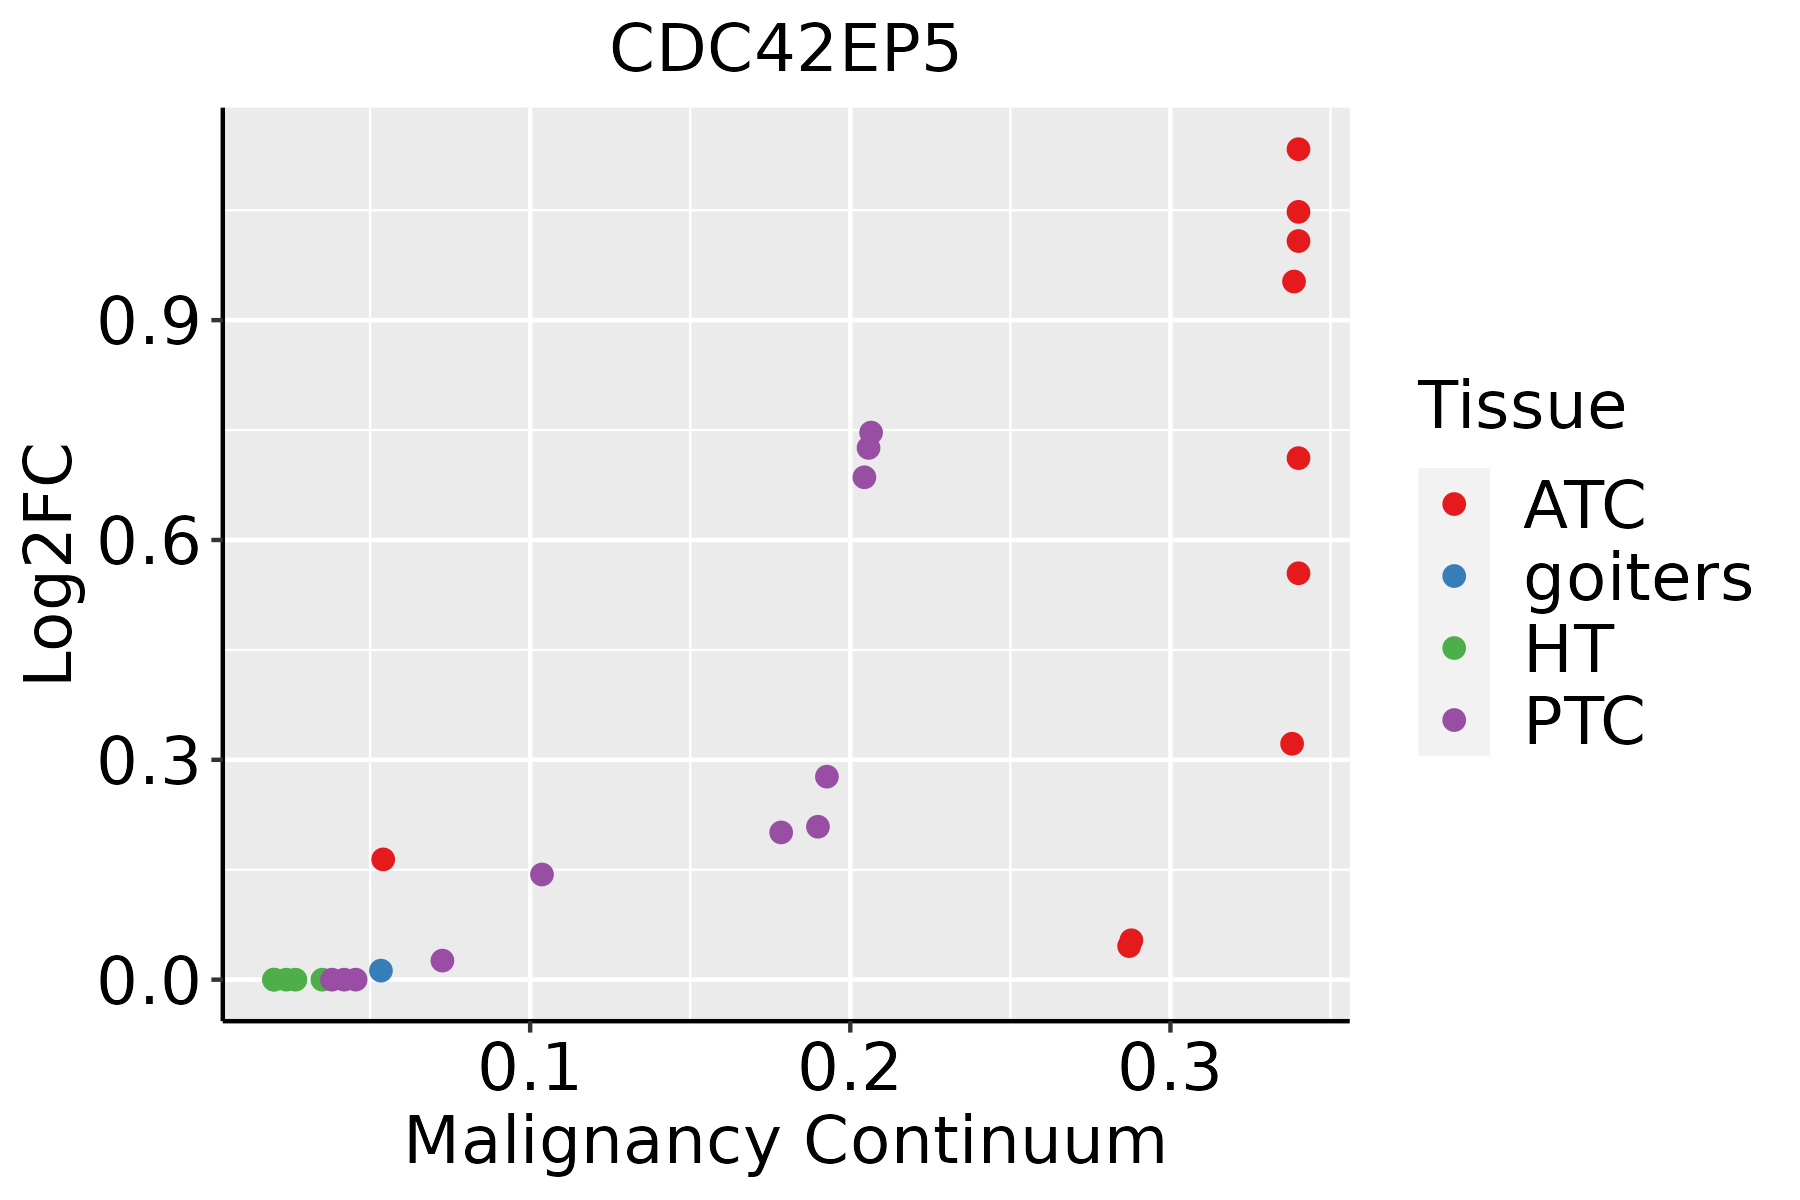 | ATC: Anaplastic thyroid cancer |
| HT: Hashimoto's thyroiditis | ||
| PTC: Papillary thyroid cancer |
| ∗log2FC in expression of this searched gene in stem-like cells from each diseased tissue sample relative to stem-like cells in normal samples in each tissue plotted against the malignancy continuum. Samples are colored based on if they are from different disease stage. |
Top |
Malignant transformation related pathway analysis |
| Find out the enriched GO biological processes and KEGG pathways involved in transition from healthy to precancer to cancer |
| Tissue | Disease Stage | Enriched GO biological Processes |
| Colorectum | AD |  |
| Colorectum | SER |  |
| Colorectum | MSS |  |
| Colorectum | MSI-H |  |
| Colorectum | FAP |  |
| ∗Top 15 enriched GO BP terms are showed in the bar plot of each disease state in each tissue. Each row represents a significant GO biological process which is colored according to the -log10(p.adjust). |
| Page: 1 2 3 4 5 6 7 8 9 |
| GO ID | Tissue | Disease Stage | Description | Gene Ratio | Bg Ratio | pvalue | p.adjust | Count |
| GO:003083211 | Stomach | CAG with IM | regulation of actin filament length | 26/1050 | 189/18723 | 2.09e-05 | 6.09e-04 | 26 |
| GO:005149511 | Stomach | CAG with IM | positive regulation of cytoskeleton organization | 29/1050 | 226/18723 | 2.73e-05 | 7.70e-04 | 29 |
| GO:003083311 | Stomach | CAG with IM | regulation of actin filament polymerization | 24/1050 | 172/18723 | 3.39e-05 | 9.45e-04 | 24 |
| GO:000836011 | Stomach | CAG with IM | regulation of cell shape | 22/1050 | 154/18723 | 4.94e-05 | 1.27e-03 | 22 |
| GO:003253511 | Stomach | CAG with IM | regulation of cellular component size | 41/1050 | 383/18723 | 5.55e-05 | 1.38e-03 | 41 |
| GO:003083811 | Stomach | CAG with IM | positive regulation of actin filament polymerization | 16/1050 | 99/18723 | 1.19e-04 | 2.53e-03 | 16 |
| GO:003109811 | Stomach | CAG with IM | stress-activated protein kinase signaling cascade | 29/1050 | 247/18723 | 1.37e-04 | 2.79e-03 | 29 |
| GO:005140311 | Stomach | CAG with IM | stress-activated MAPK cascade | 28/1050 | 239/18723 | 1.84e-04 | 3.49e-03 | 28 |
| GO:01200325 | Stomach | CAG with IM | regulation of plasma membrane bounded cell projection assembly | 20/1050 | 186/18723 | 3.99e-03 | 3.46e-02 | 20 |
| GO:00604914 | Stomach | CAG with IM | regulation of cell projection assembly | 20/1050 | 188/18723 | 4.50e-03 | 3.77e-02 | 20 |
| GO:01200343 | Stomach | CAG with IM | positive regulation of plasma membrane bounded cell projection assembly | 13/1050 | 105/18723 | 5.85e-03 | 4.55e-02 | 13 |
| GO:00072542 | Stomach | CAG with IM | JNK cascade | 18/1050 | 167/18723 | 5.96e-03 | 4.62e-02 | 18 |
| GO:000701521 | Stomach | CSG | actin filament organization | 62/1034 | 442/18723 | 1.18e-11 | 2.70e-09 | 62 |
| GO:004325421 | Stomach | CSG | regulation of protein-containing complex assembly | 56/1034 | 428/18723 | 1.67e-09 | 2.16e-07 | 56 |
| GO:003297021 | Stomach | CSG | regulation of actin filament-based process | 53/1034 | 397/18723 | 2.26e-09 | 2.65e-07 | 53 |
| GO:190290321 | Stomach | CSG | regulation of supramolecular fiber organization | 51/1034 | 383/18723 | 4.96e-09 | 5.04e-07 | 51 |
| GO:003133421 | Stomach | CSG | positive regulation of protein-containing complex assembly | 37/1034 | 237/18723 | 9.86e-09 | 9.00e-07 | 37 |
| GO:011005321 | Stomach | CSG | regulation of actin filament organization | 40/1034 | 278/18723 | 2.66e-08 | 2.20e-06 | 40 |
| GO:003295621 | Stomach | CSG | regulation of actin cytoskeleton organization | 47/1034 | 358/18723 | 3.10e-08 | 2.49e-06 | 47 |
| GO:002260421 | Stomach | CSG | regulation of cell morphogenesis | 40/1034 | 309/18723 | 4.76e-07 | 2.77e-05 | 40 |
| Page: 1 2 3 4 5 6 7 8 9 10 11 12 13 14 15 16 17 18 |
| Pathway ID | Tissue | Disease Stage | Description | Gene Ratio | Bg Ratio | pvalue | p.adjust | qvalue | Count |
| Page: 1 |
Top |
Cell-cell communication analysis |
| Identification of potential cell-cell interactions between two cell types and their ligand-receptor pairs for different disease states |
| Ligand | Receptor | LRpair | Pathway | Tissue | Disease Stage |
| Page: 1 |
Top |
Single-cell gene regulatory network inference analysis |
| Find out the significant the regulons (TFs) and the target genes of each regulon across cell types for different disease states |
| TF | Cell Type | Tissue | Disease Stage | Target Gene | RSS | Regulon Activity |
| ∗The dot plots of a searched regulon are shown for all cell subpopulations in each disease state of each tissue based on the regulon specific score inferred using pySCENIC and by calculating the average expression. |
| Page: 1 |
Top |
Somatic mutation of malignant transformation related genes |
| Annotation of somatic variants for genes involved in malignant transformation |
| Hugo Symbol | Variant Class | Variant Classification | dbSNP RS | HGVSc | HGVSp | HGVSp Short | SWISSPROT | BIOTYPE | SIFT | PolyPhen | Tumor Sample Barcode | Tissue | Histology | Sex | Age | Stage | Therapy Types | Drugs | Outcome |
| CDC42EP5 | SNV | Missense_Mutation | novel | c.322G>T | p.Asp108Tyr | p.D108Y | Q6NZY7 | protein_coding | deleterious(0) | benign(0.338) | TCGA-G3-AAV0-01 | Liver | liver hepatocellular carcinoma | Male | <65 | I/II | Unknown | Unknown | SD |
| CDC42EP5 | SNV | Missense_Mutation | novel | c.259N>G | p.Pro87Ala | p.P87A | Q6NZY7 | protein_coding | tolerated(0.34) | possibly_damaging(0.461) | TCGA-58-8391-01 | Lung | lung squamous cell carcinoma | Female | <65 | III/IV | Chemotherapy | carboplatin | PD |
| CDC42EP5 | SNV | Missense_Mutation | c.432N>G | p.Asp144Glu | p.D144E | Q6NZY7 | protein_coding | tolerated_low_confidence(0.27) | benign(0.01) | TCGA-66-2793-01 | Lung | lung squamous cell carcinoma | Male | >=65 | III/IV | Unknown | Unknown | SD | |
| CDC42EP5 | SNV | Missense_Mutation | novel | c.109N>A | p.Gly37Arg | p.G37R | Q6NZY7 | protein_coding | deleterious(0) | probably_damaging(1) | TCGA-QU-A6IO-01 | Prostate | prostate adenocarcinoma | Male | <65 | 6 | Unknown | Unknown | SD |
| Page: 1 |
Top |
Related drugs of malignant transformation related genes |
| Identification of chemicals and drugs interact with genes involved in malignant transfromation |
| (DGIdb 4.0) |
| Entrez ID | Symbol | Category | Interaction Types | Drug Claim Name | Drug Name | PMIDs |
| Page: 1 |

Copyright 2023-Present -The University of Texas Health Science Center at Houston |