| Tissue | Expression Dynamics | Abbreviation |
| Colorectum (GSE201348) |  | FAP: Familial adenomatous polyposis |
| CRC: Colorectal cancer |
| Colorectum (HTA11) | 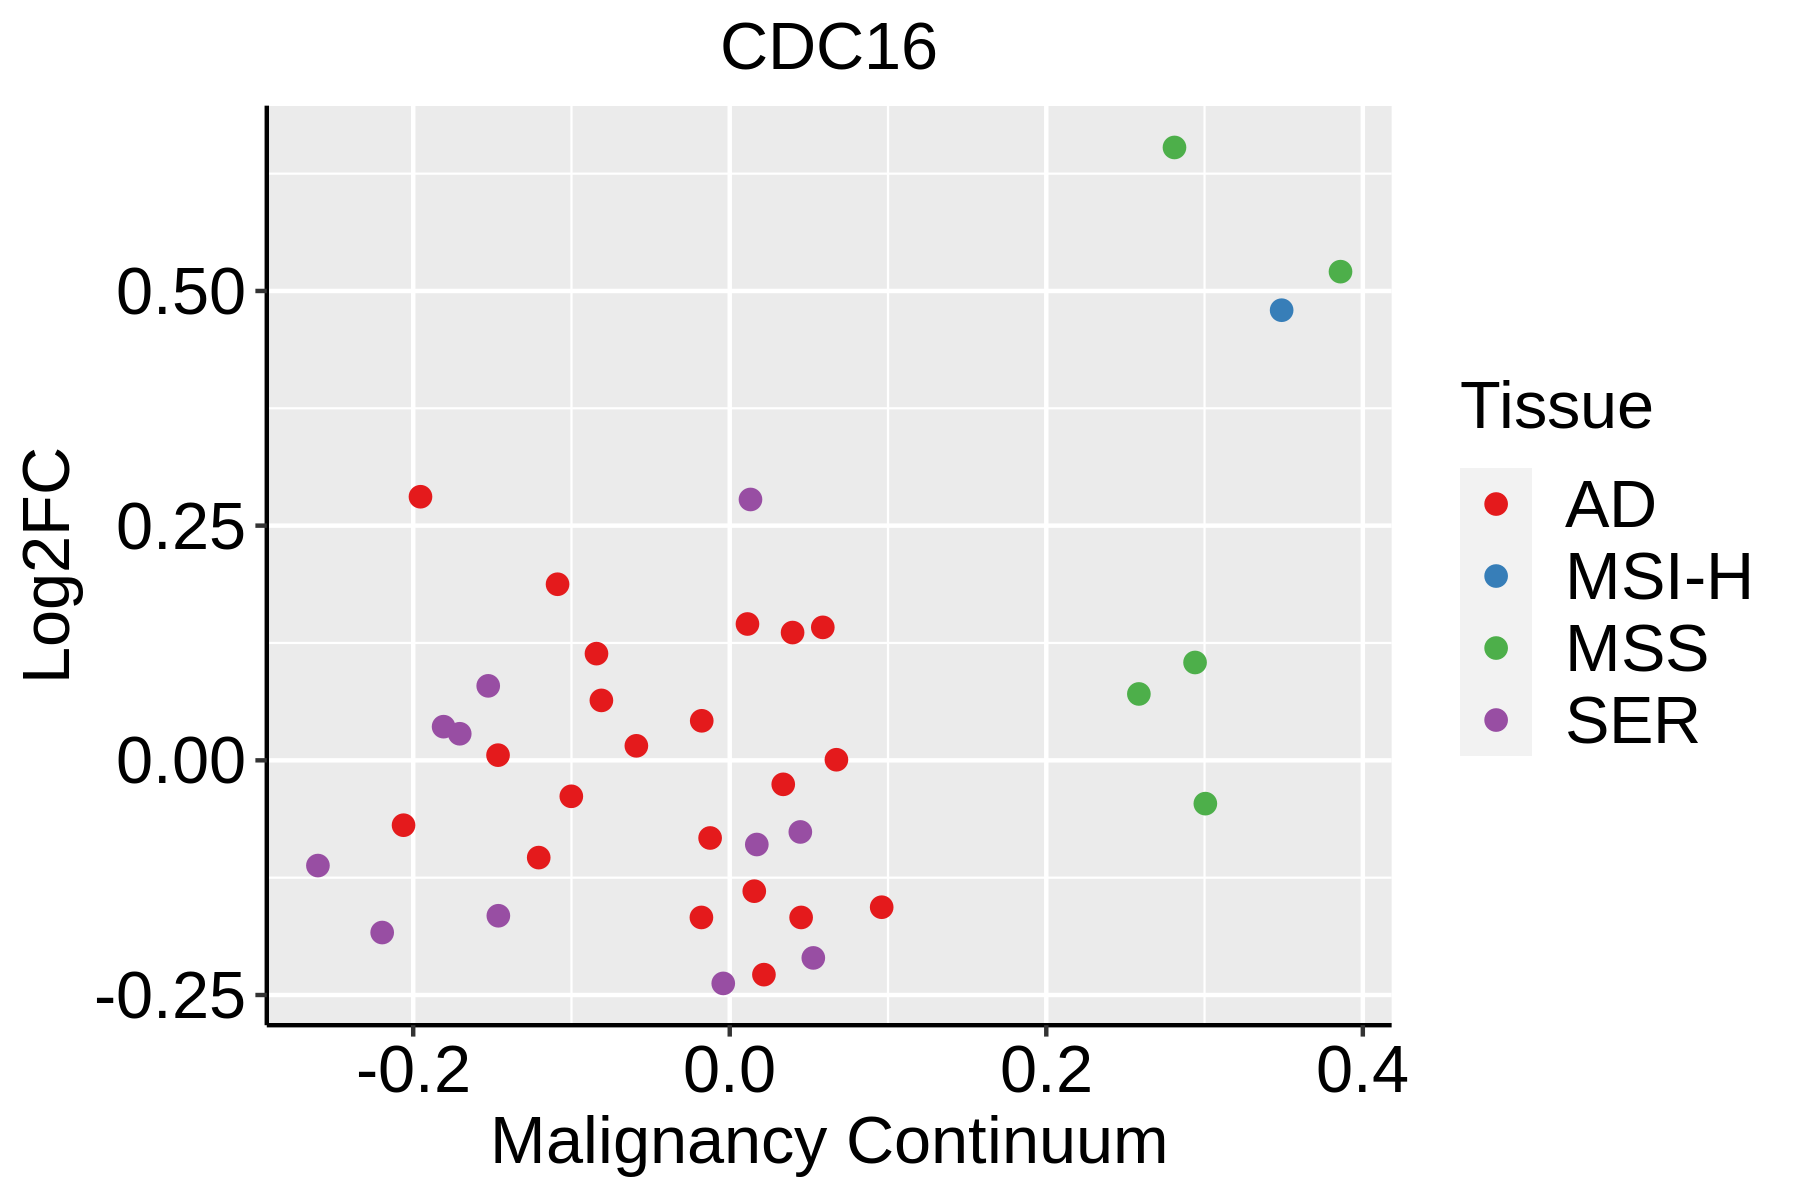 | AD: Adenomas |
| SER: Sessile serrated lesions |
| MSI-H: Microsatellite-high colorectal cancer |
| MSS: Microsatellite stable colorectal cancer |
| Esophagus | 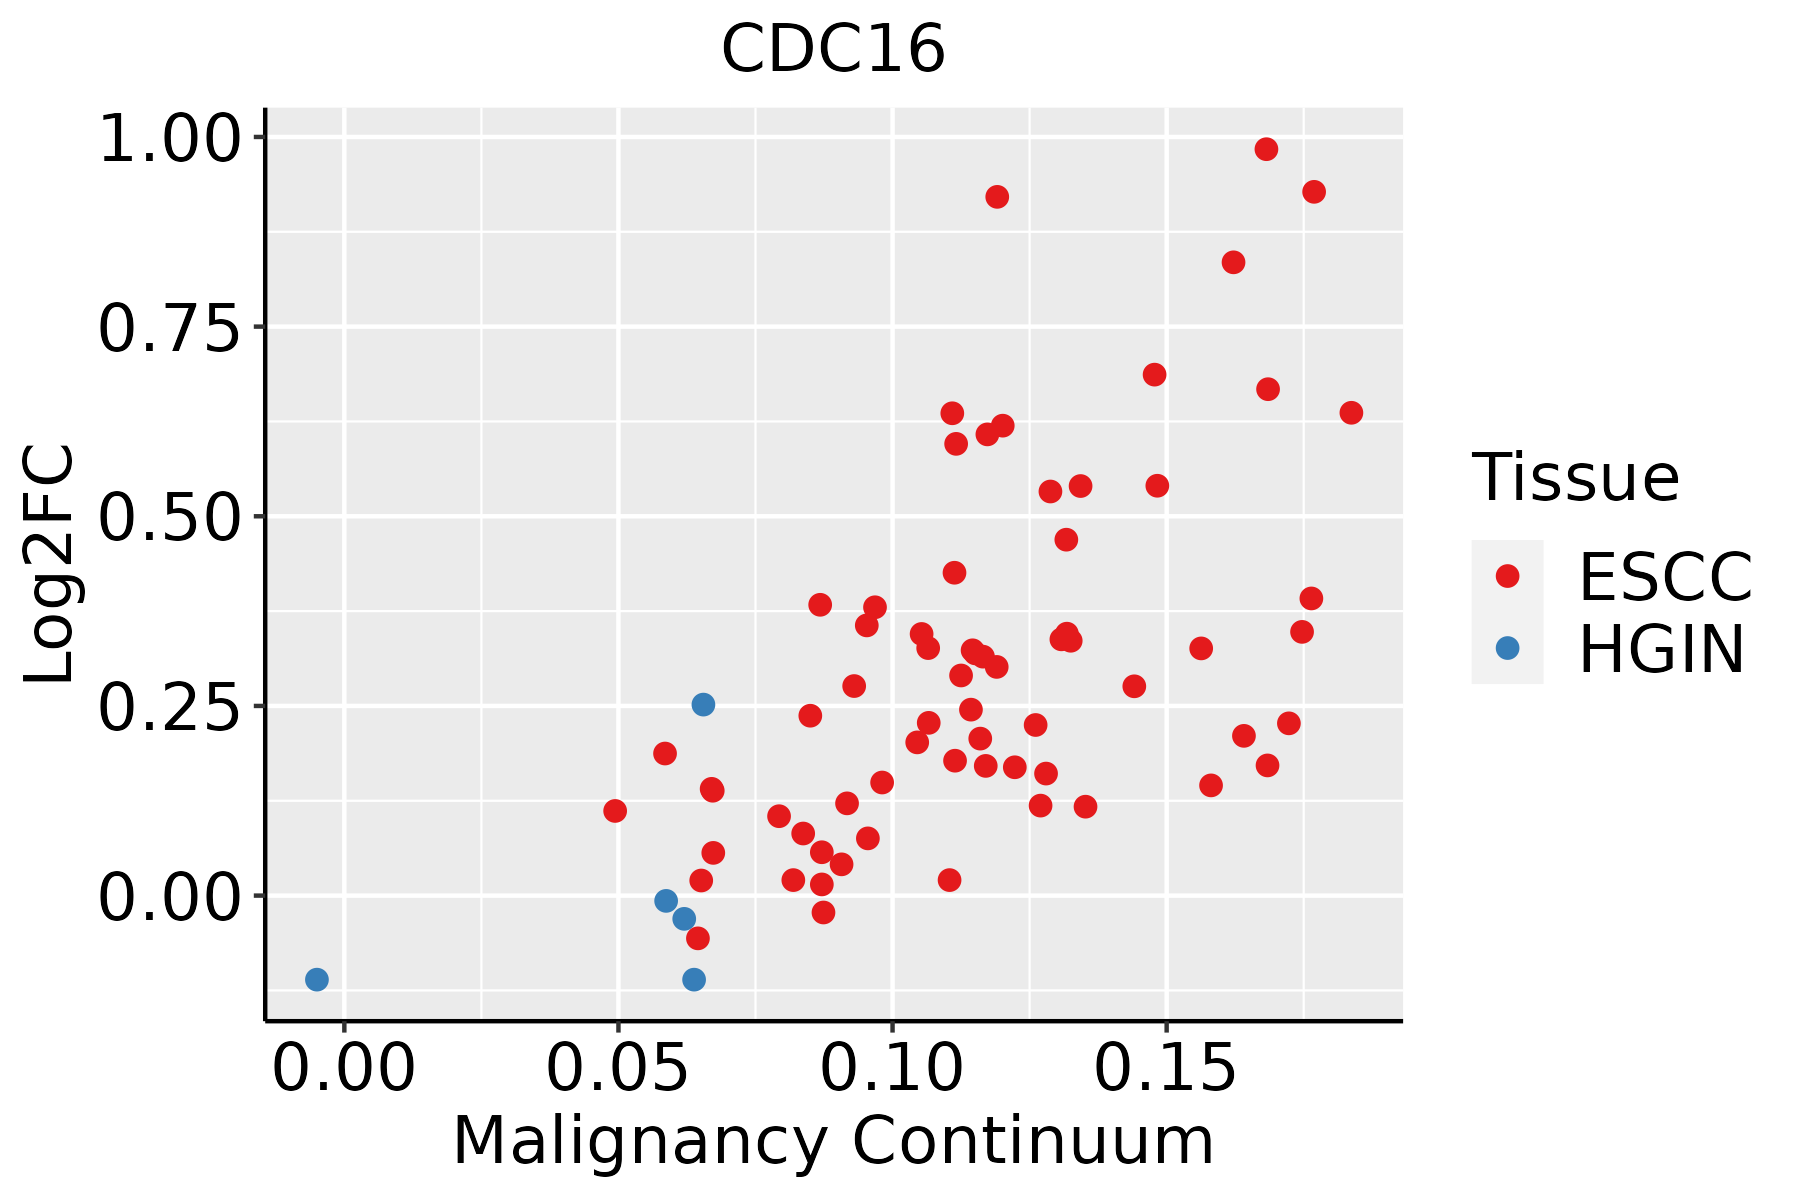 | ESCC: Esophageal squamous cell carcinoma |
| HGIN: High-grade intraepithelial neoplasias |
| LGIN: Low-grade intraepithelial neoplasias |
| Liver | 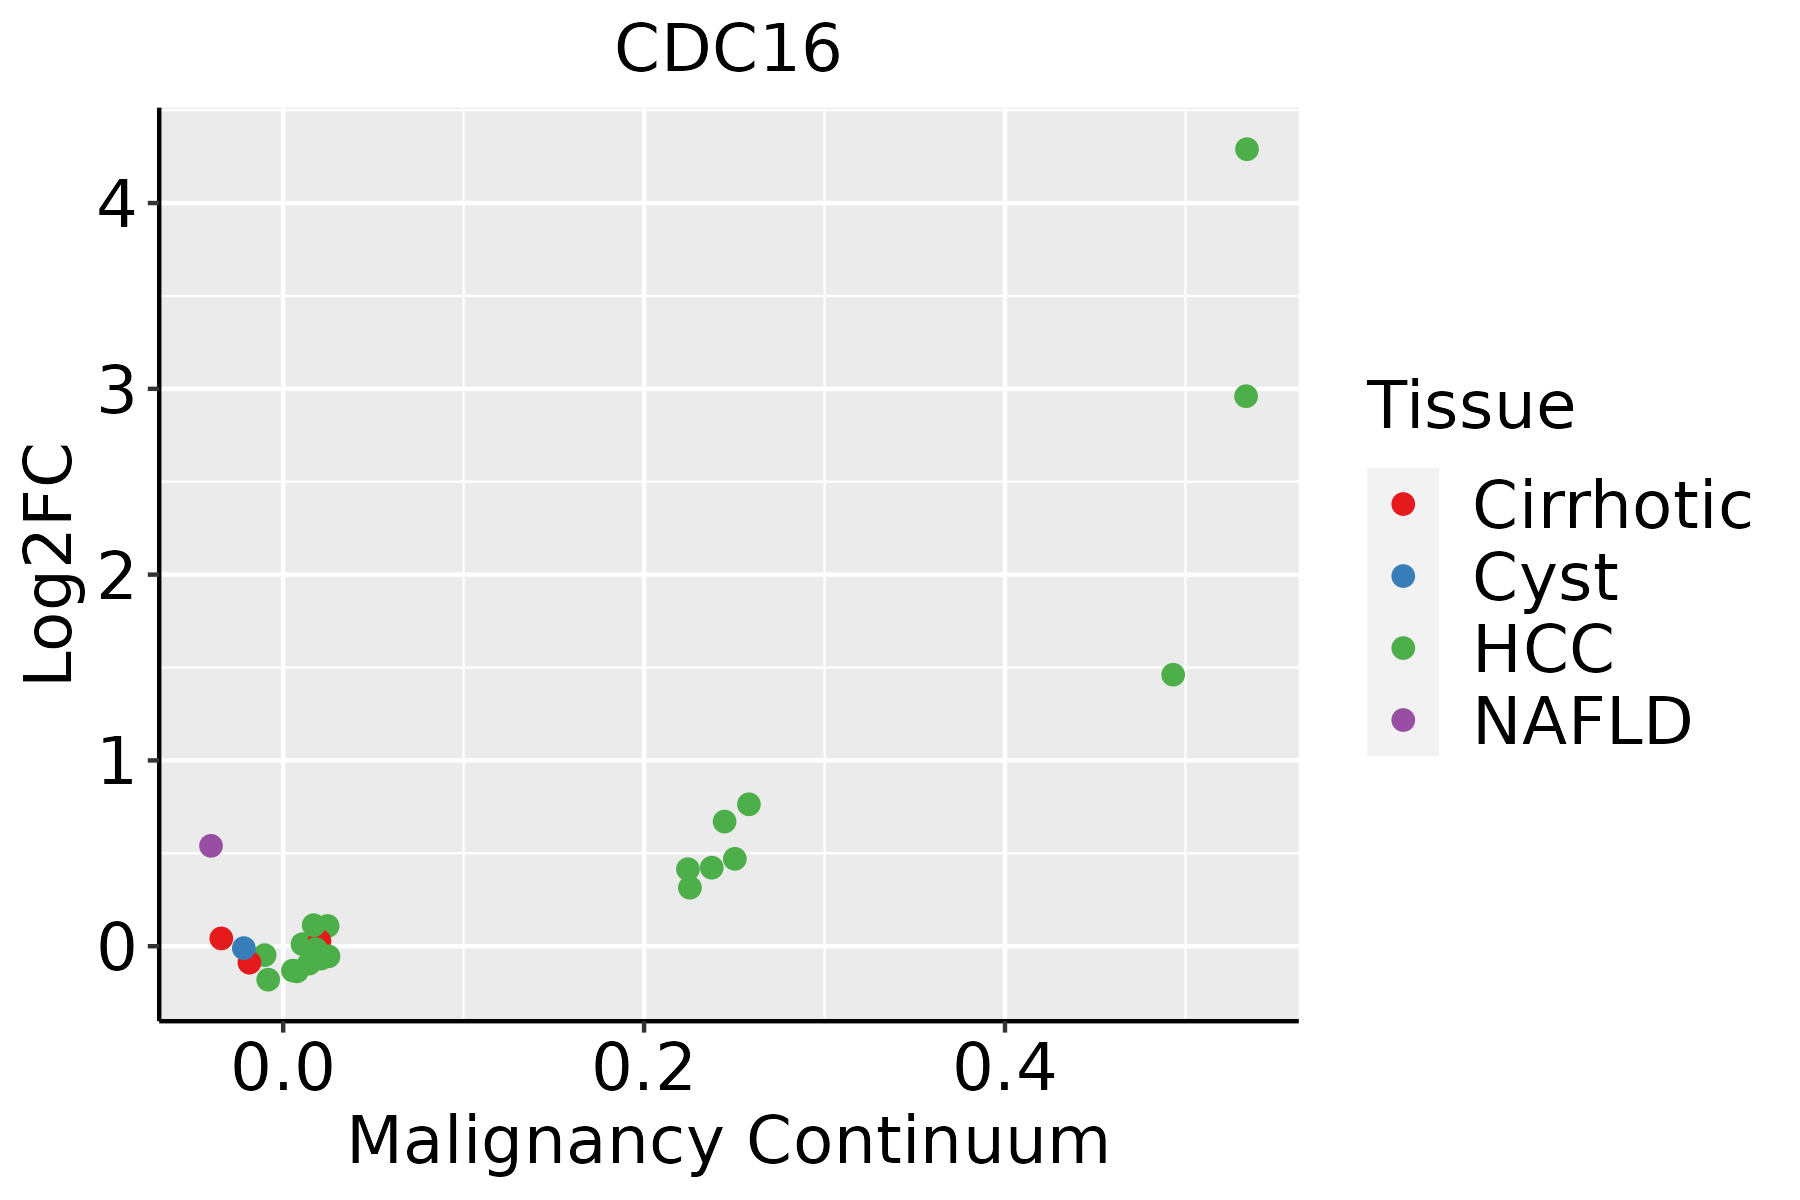 | HCC: Hepatocellular carcinoma |
| NAFLD: Non-alcoholic fatty liver disease |
| Oral Cavity | 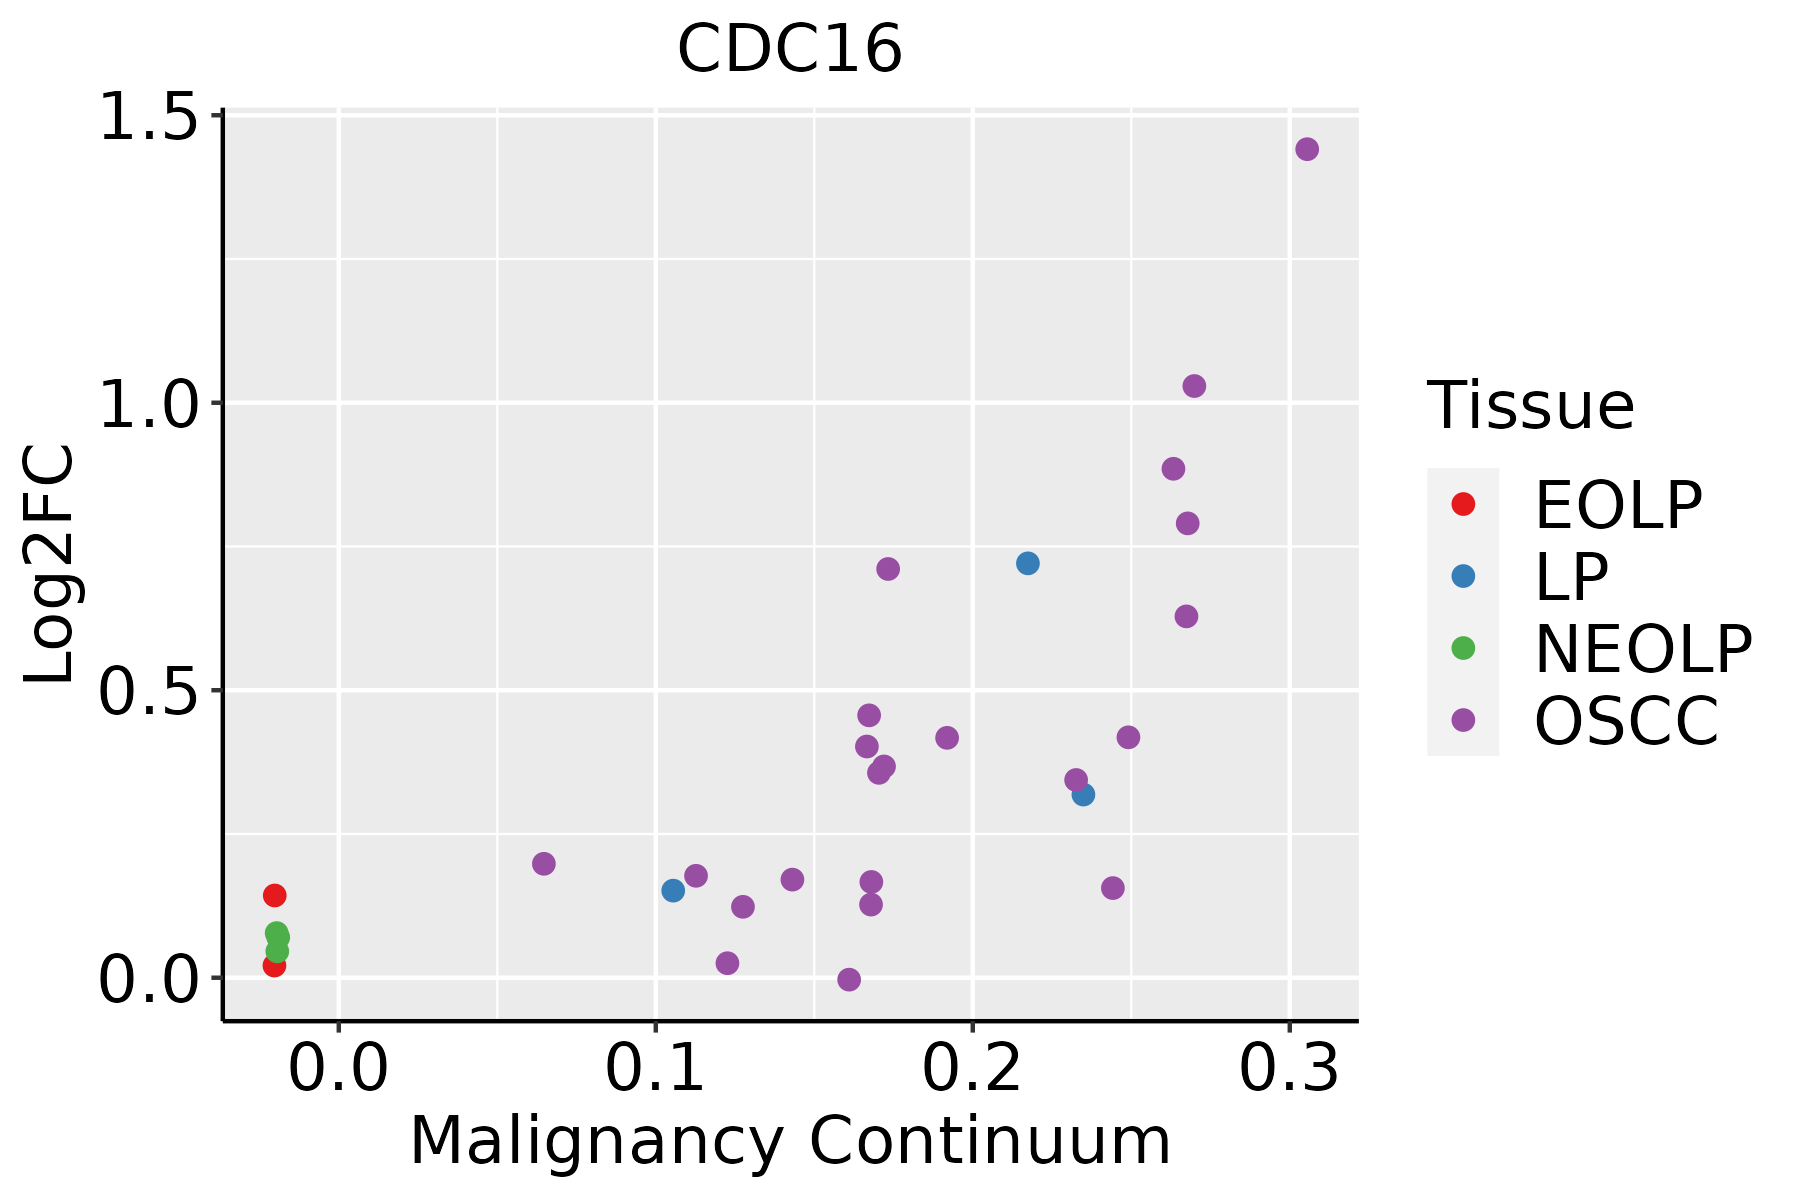 | EOLP: Erosive Oral lichen planus |
| LP: leukoplakia |
| NEOLP: Non-erosive oral lichen planus |
| OSCC: Oral squamous cell carcinoma |
| Skin |  | AK: Actinic keratosis |
| cSCC: Cutaneous squamous cell carcinoma |
| SCCIS:squamous cell carcinoma in situ |
| Thyroid |  | ATC: Anaplastic thyroid cancer |
| HT: Hashimoto's thyroiditis |
| PTC: Papillary thyroid cancer |
| GO ID | Tissue | Disease Stage | Description | Gene Ratio | Bg Ratio | pvalue | p.adjust | Count |
| GO:00988135 | Thyroid | PTC | nuclear chromosome segregation | 114/5968 | 281/18723 | 1.21e-03 | 6.94e-03 | 114 |
| GO:19019927 | Thyroid | PTC | positive regulation of mitotic cell cycle phase transition | 44/5968 | 93/18723 | 1.32e-03 | 7.48e-03 | 44 |
| GO:00519835 | Thyroid | PTC | regulation of chromosome segregation | 43/5968 | 91/18723 | 1.53e-03 | 8.55e-03 | 43 |
| GO:19019898 | Thyroid | PTC | positive regulation of cell cycle phase transition | 52/5968 | 115/18723 | 1.82e-03 | 9.84e-03 | 52 |
| GO:19058184 | Thyroid | PTC | regulation of chromosome separation | 35/5968 | 72/18723 | 2.23e-03 | 1.18e-02 | 35 |
| GO:00300714 | Thyroid | PTC | regulation of mitotic metaphase/anaphase transition | 30/5968 | 60/18723 | 2.60e-03 | 1.33e-02 | 30 |
| GO:00002804 | Thyroid | PTC | nuclear division | 167/5968 | 439/18723 | 3.27e-03 | 1.60e-02 | 167 |
| GO:00513064 | Thyroid | PTC | mitotic sister chromatid separation | 32/5968 | 67/18723 | 4.75e-03 | 2.22e-02 | 32 |
| GO:00070914 | Thyroid | PTC | metaphase/anaphase transition of mitotic cell cycle | 30/5968 | 62/18723 | 4.85e-03 | 2.27e-02 | 30 |
| GO:00517833 | Thyroid | PTC | regulation of nuclear division | 59/5968 | 139/18723 | 5.50e-03 | 2.50e-02 | 59 |
| GO:00109654 | Thyroid | PTC | regulation of mitotic sister chromatid separation | 31/5968 | 65/18723 | 5.54e-03 | 2.52e-02 | 31 |
| GO:19020994 | Thyroid | PTC | regulation of metaphase/anaphase transition of cell cycle | 30/5968 | 63/18723 | 6.48e-03 | 2.83e-02 | 30 |
| GO:00330454 | Thyroid | PTC | regulation of sister chromatid segregation | 33/5968 | 72/18723 | 9.04e-03 | 3.75e-02 | 33 |
| GO:00447844 | Thyroid | PTC | metaphase/anaphase transition of cell cycle | 30/5968 | 65/18723 | 1.11e-02 | 4.42e-02 | 30 |
| GO:001049832 | Thyroid | ATC | proteasomal protein catabolic process | 309/6293 | 490/18723 | 1.78e-41 | 1.13e-37 | 309 |
| GO:0043161210 | Thyroid | ATC | proteasome-mediated ubiquitin-dependent protein catabolic process | 265/6293 | 412/18723 | 7.09e-38 | 1.49e-34 | 265 |
| GO:014001416 | Thyroid | ATC | mitotic nuclear division | 171/6293 | 287/18723 | 1.13e-19 | 1.66e-17 | 171 |
| GO:003304423 | Thyroid | ATC | regulation of chromosome organization | 119/6293 | 187/18723 | 3.55e-17 | 3.40e-15 | 119 |
| GO:004477219 | Thyroid | ATC | mitotic cell cycle phase transition | 223/6293 | 424/18723 | 3.46e-16 | 2.88e-14 | 223 |
| GO:000007013 | Thyroid | ATC | mitotic sister chromatid segregation | 108/6293 | 168/18723 | 3.53e-16 | 2.90e-14 | 108 |
| Pathway ID | Tissue | Disease Stage | Description | Gene Ratio | Bg Ratio | pvalue | p.adjust | qvalue | Count |
| hsa04120 | Colorectum | AD | Ubiquitin mediated proteolysis | 58/2092 | 142/8465 | 1.46e-05 | 1.53e-04 | 9.76e-05 | 58 |
| hsa05166 | Colorectum | AD | Human T-cell leukemia virus 1 infection | 72/2092 | 222/8465 | 5.24e-03 | 2.44e-02 | 1.55e-02 | 72 |
| hsa041201 | Colorectum | AD | Ubiquitin mediated proteolysis | 58/2092 | 142/8465 | 1.46e-05 | 1.53e-04 | 9.76e-05 | 58 |
| hsa051661 | Colorectum | AD | Human T-cell leukemia virus 1 infection | 72/2092 | 222/8465 | 5.24e-03 | 2.44e-02 | 1.55e-02 | 72 |
| hsa041204 | Colorectum | MSS | Ubiquitin mediated proteolysis | 55/1875 | 142/8465 | 5.02e-06 | 6.00e-05 | 3.68e-05 | 55 |
| hsa051662 | Colorectum | MSS | Human T-cell leukemia virus 1 infection | 68/1875 | 222/8465 | 1.84e-03 | 9.61e-03 | 5.89e-03 | 68 |
| hsa041205 | Colorectum | MSS | Ubiquitin mediated proteolysis | 55/1875 | 142/8465 | 5.02e-06 | 6.00e-05 | 3.68e-05 | 55 |
| hsa051663 | Colorectum | MSS | Human T-cell leukemia virus 1 infection | 68/1875 | 222/8465 | 1.84e-03 | 9.61e-03 | 5.89e-03 | 68 |
| hsa041206 | Colorectum | FAP | Ubiquitin mediated proteolysis | 51/1404 | 142/8465 | 1.55e-08 | 5.84e-07 | 3.55e-07 | 51 |
| hsa04110 | Colorectum | FAP | Cell cycle | 37/1404 | 157/8465 | 1.44e-02 | 4.77e-02 | 2.90e-02 | 37 |
| hsa041207 | Colorectum | FAP | Ubiquitin mediated proteolysis | 51/1404 | 142/8465 | 1.55e-08 | 5.84e-07 | 3.55e-07 | 51 |
| hsa041101 | Colorectum | FAP | Cell cycle | 37/1404 | 157/8465 | 1.44e-02 | 4.77e-02 | 2.90e-02 | 37 |
| hsa041208 | Colorectum | CRC | Ubiquitin mediated proteolysis | 42/1091 | 142/8465 | 9.98e-08 | 6.67e-06 | 4.52e-06 | 42 |
| hsa041209 | Colorectum | CRC | Ubiquitin mediated proteolysis | 42/1091 | 142/8465 | 9.98e-08 | 6.67e-06 | 4.52e-06 | 42 |
| hsa0412027 | Esophagus | ESCC | Ubiquitin mediated proteolysis | 122/4205 | 142/8465 | 6.53e-20 | 7.29e-18 | 3.74e-18 | 122 |
| hsa0411023 | Esophagus | ESCC | Cell cycle | 126/4205 | 157/8465 | 1.34e-15 | 5.60e-14 | 2.87e-14 | 126 |
| hsa05166211 | Esophagus | ESCC | Human T-cell leukemia virus 1 infection | 164/4205 | 222/8465 | 8.13e-14 | 2.09e-12 | 1.07e-12 | 164 |
| hsa041146 | Esophagus | ESCC | Oocyte meiosis | 77/4205 | 131/8465 | 2.19e-02 | 4.80e-02 | 2.46e-02 | 77 |
| hsa0412036 | Esophagus | ESCC | Ubiquitin mediated proteolysis | 122/4205 | 142/8465 | 6.53e-20 | 7.29e-18 | 3.74e-18 | 122 |
| hsa0411033 | Esophagus | ESCC | Cell cycle | 126/4205 | 157/8465 | 1.34e-15 | 5.60e-14 | 2.87e-14 | 126 |
| Hugo Symbol | Variant Class | Variant Classification | dbSNP RS | HGVSc | HGVSp | HGVSp Short | SWISSPROT | BIOTYPE | SIFT | PolyPhen | Tumor Sample Barcode | Tissue | Histology | Sex | Age | Stage | Therapy Types | Drugs | Outcome |
| CDC16 | SNV | Missense_Mutation | novel | c.1410G>C | p.Gln470His | p.Q470H | Q13042 | protein_coding | tolerated(0.06) | probably_damaging(0.967) | TCGA-A8-A06X-01 | Breast | breast invasive carcinoma | Female | >=65 | I/II | Unknown | Unknown | SD |
| CDC16 | SNV | Missense_Mutation | novel | c.1828N>C | p.Met610Leu | p.M610L | Q13042 | protein_coding | deleterious_low_confidence(0) | benign(0.354) | TCGA-AN-A046-01 | Breast | breast invasive carcinoma | Female | >=65 | I/II | Unknown | Unknown | SD |
| CDC16 | SNV | Missense_Mutation | novel | c.79N>C | p.Asp27His | p.D27H | Q13042 | protein_coding | deleterious(0) | probably_damaging(0.999) | TCGA-BH-A2L8-01 | Breast | breast invasive carcinoma | Female | <65 | I/II | Chemotherapy | cytoxan | CR |
| CDC16 | insertion | In_Frame_Ins | novel | c.1050_1051insTTTGGGAGGCCGAGACAGGCAGATTACCTTAGGTCA | p.His350_Asp351insPheGlyArgProArgGlnAlaAspTyrLeuArgSer | p.H350_D351insFGRPRQADYLRS | Q13042 | protein_coding | | | TCGA-A2-A0EO-01 | Breast | breast invasive carcinoma | Female | <65 | I/II | Hormone Therapy | tamoxiphen | SD |
| CDC16 | insertion | Frame_Shift_Ins | novel | c.1737_1738insGTTTATGT | p.Leu580ValfsTer28 | p.L580Vfs*28 | Q13042 | protein_coding | | | TCGA-AR-A0TY-01 | Breast | breast invasive carcinoma | Female | <65 | I/II | Unspecific | Paclitaxel | PD |
| CDC16 | insertion | Frame_Shift_Ins | novel | c.1738_1739insGAATGATTGTACCTAATACATCTGTTCAGATCTG | p.Leu580ArgfsTer33 | p.L580Rfs*33 | Q13042 | protein_coding | | | TCGA-AR-A0TY-01 | Breast | breast invasive carcinoma | Female | <65 | I/II | Unspecific | Paclitaxel | PD |
| CDC16 | SNV | Missense_Mutation | | c.1685C>T | p.Pro562Leu | p.P562L | Q13042 | protein_coding | deleterious_low_confidence(0.02) | benign(0.015) | TCGA-2W-A8YY-01 | Cervix | cervical & endocervical cancer | Female | <65 | I/II | Chemotherapy | cisplatin | CR |
| CDC16 | insertion | Frame_Shift_Ins | novel | c.1363dupT | p.Cys455LeufsTer5 | p.C455Lfs*5 | Q13042 | protein_coding | | | TCGA-VS-A9V4-01 | Cervix | cervical & endocervical cancer | Female | <65 | I/II | Chemotherapy | cisplatin | PD |
| CDC16 | SNV | Missense_Mutation | | c.1739T>G | p.Leu580Arg | p.L580R | Q13042 | protein_coding | deleterious_low_confidence(0.01) | benign(0.085) | TCGA-A6-6780-01 | Colorectum | colon adenocarcinoma | Male | >=65 | I/II | Unknown | Unknown | SD |
| CDC16 | SNV | Missense_Mutation | rs373980044 | c.1859C>T | p.Thr620Met | p.T620M | Q13042 | protein_coding | deleterious_low_confidence(0) | benign(0.416) | TCGA-A6-6781-01 | Colorectum | colon adenocarcinoma | Male | <65 | III/IV | Chemotherapy | oxaliplatin | SD |


