| Tissue | Expression Dynamics | Abbreviation |
| Esophagus | 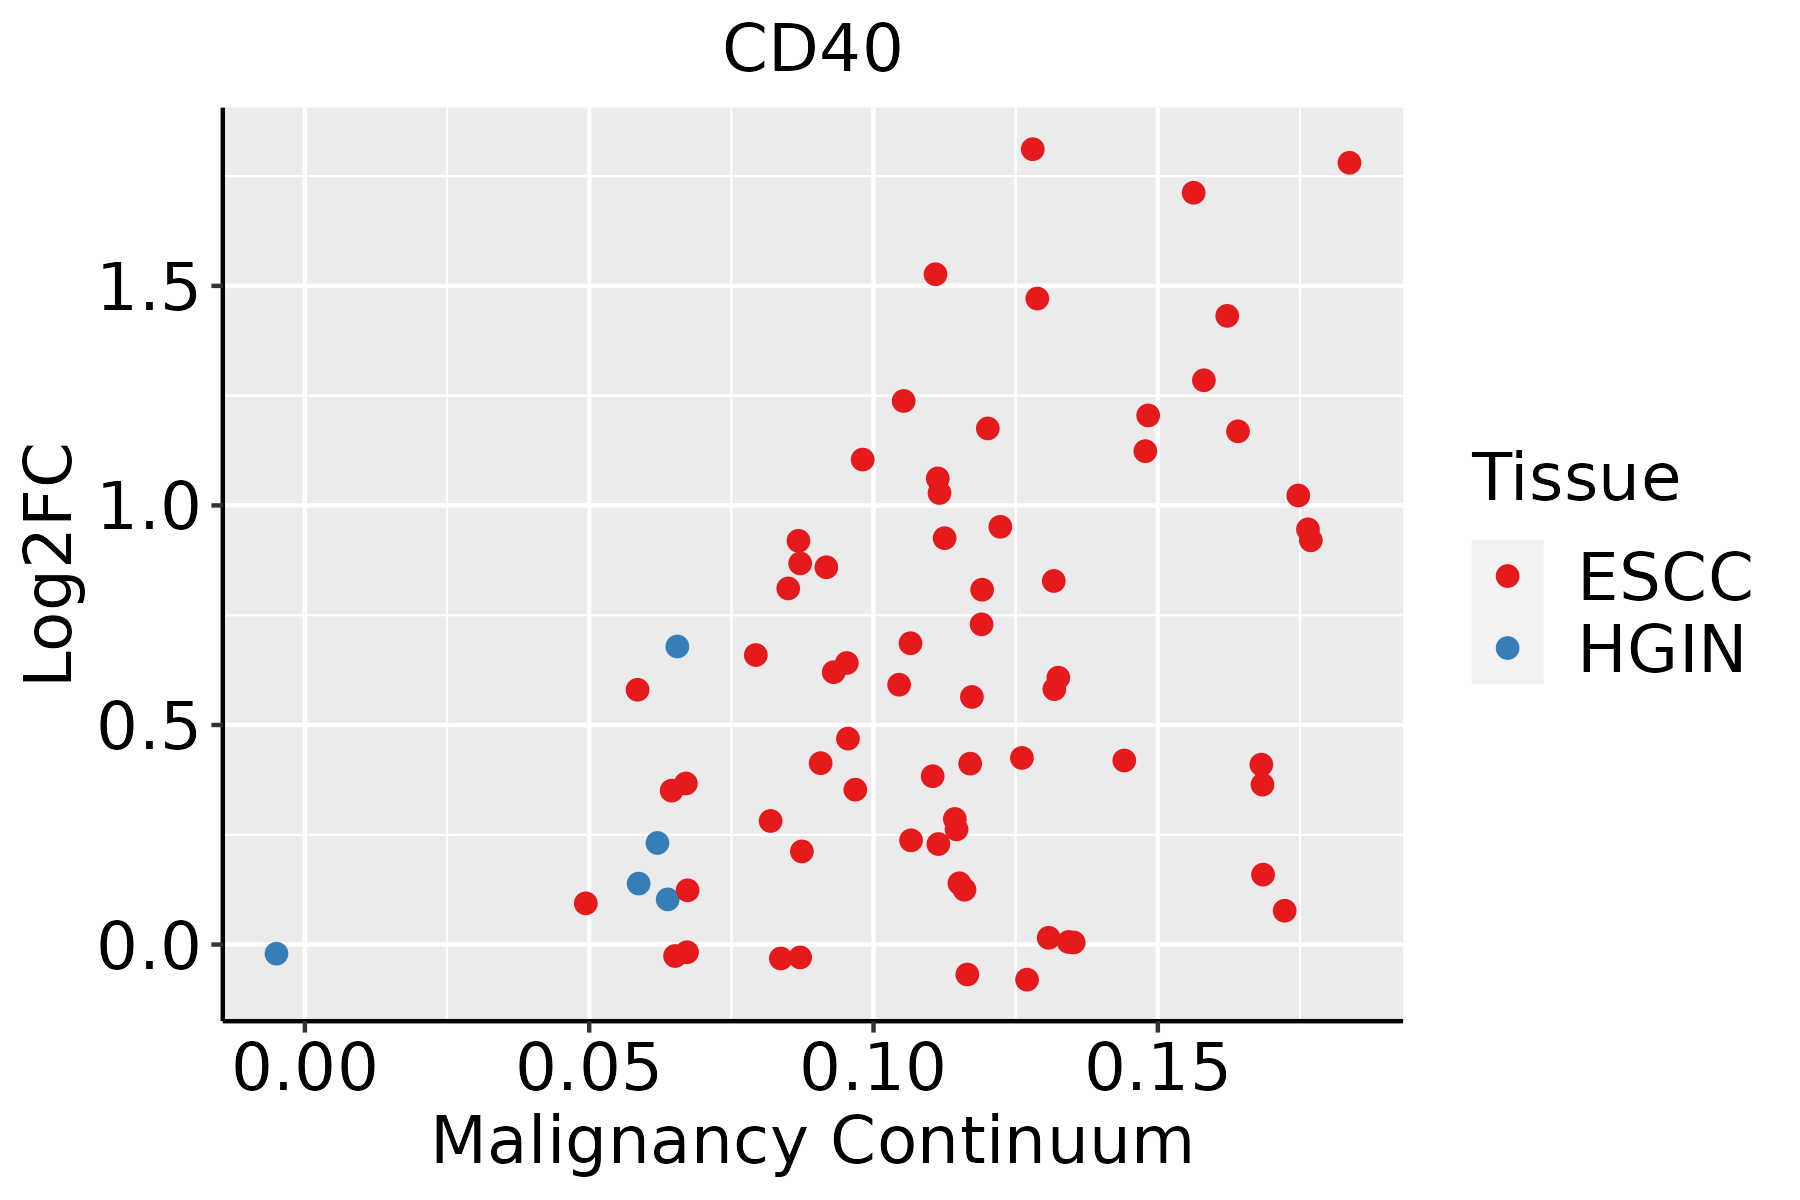 | ESCC: Esophageal squamous cell carcinoma |
| HGIN: High-grade intraepithelial neoplasias |
| LGIN: Low-grade intraepithelial neoplasias |
| Oral Cavity | 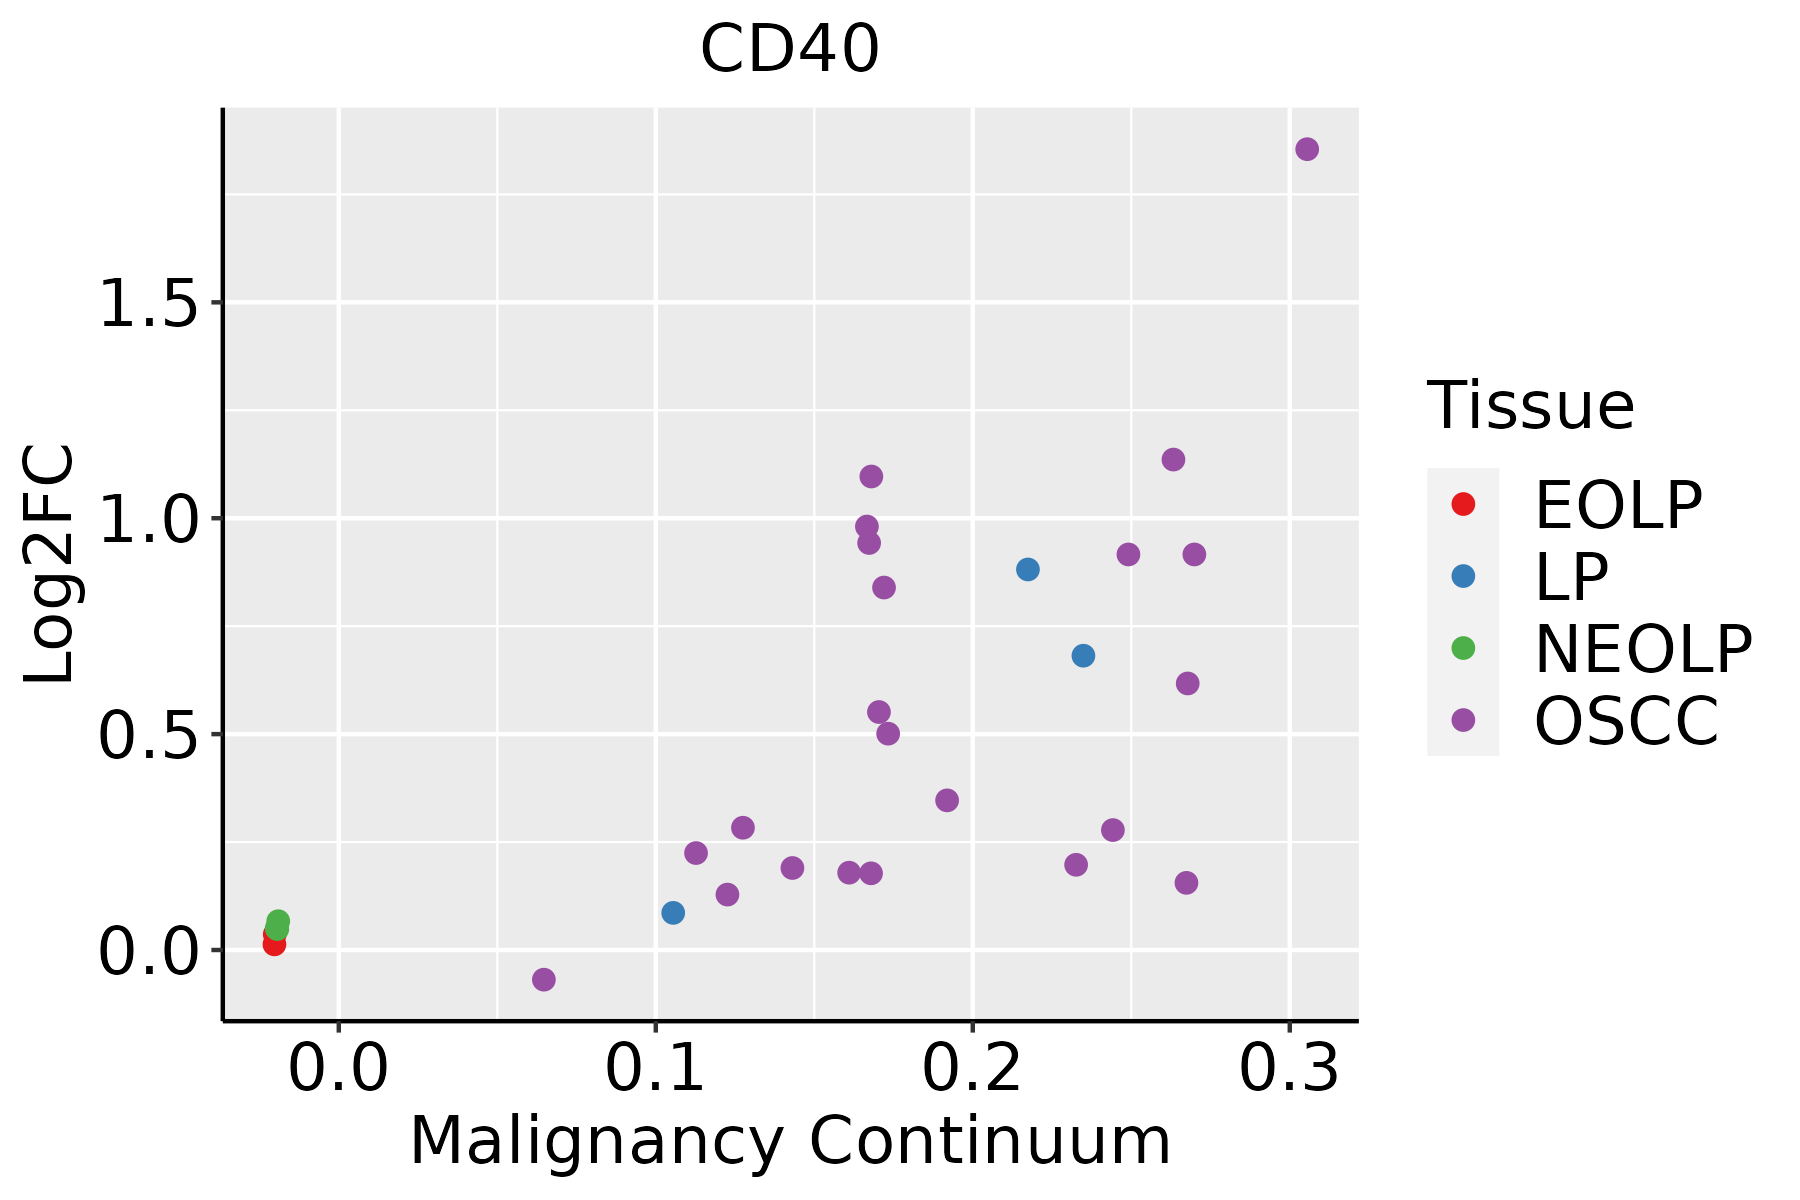 | EOLP: Erosive Oral lichen planus |
| LP: leukoplakia |
| NEOLP: Non-erosive oral lichen planus |
| OSCC: Oral squamous cell carcinoma |
| Thyroid |  | ATC: Anaplastic thyroid cancer |
| HT: Hashimoto's thyroiditis |
| PTC: Papillary thyroid cancer |
| GO ID | Tissue | Disease Stage | Description | Gene Ratio | Bg Ratio | pvalue | p.adjust | Count |
| GO:19013427 | Thyroid | ATC | regulation of vasculature development | 143/6293 | 348/18723 | 1.95e-03 | 9.44e-03 | 143 |
| GO:00181086 | Thyroid | ATC | peptidyl-tyrosine phosphorylation | 153/6293 | 375/18723 | 1.96e-03 | 9.48e-03 | 153 |
| GO:000759618 | Thyroid | ATC | blood coagulation | 93/6293 | 217/18723 | 2.69e-03 | 1.23e-02 | 93 |
| GO:000759918 | Thyroid | ATC | hemostasis | 94/6293 | 222/18723 | 3.92e-03 | 1.70e-02 | 94 |
| GO:005081718 | Thyroid | ATC | coagulation | 94/6293 | 222/18723 | 3.92e-03 | 1.70e-02 | 94 |
| GO:004354715 | Thyroid | ATC | positive regulation of GTPase activity | 106/6293 | 255/18723 | 4.58e-03 | 1.89e-02 | 106 |
| GO:004340611 | Thyroid | ATC | positive regulation of MAP kinase activity | 51/6293 | 112/18723 | 5.68e-03 | 2.30e-02 | 51 |
| GO:007055513 | Thyroid | ATC | response to interleukin-1 | 63/6293 | 143/18723 | 5.82e-03 | 2.35e-02 | 63 |
| GO:00507305 | Thyroid | ATC | regulation of peptidyl-tyrosine phosphorylation | 108/6293 | 264/18723 | 7.50e-03 | 2.93e-02 | 108 |
| GO:003434116 | Thyroid | ATC | response to interferon-gamma | 61/6293 | 141/18723 | 1.04e-02 | 3.79e-02 | 61 |
| GO:0050878112 | Thyroid | ATC | regulation of body fluid levels | 149/6293 | 379/18723 | 1.08e-02 | 3.90e-02 | 149 |
| GO:003016813 | Thyroid | ATC | platelet activation | 54/6293 | 123/18723 | 1.10e-02 | 3.95e-02 | 54 |
| GO:004349116 | Thyroid | ATC | protein kinase B signaling | 87/6293 | 211/18723 | 1.20e-02 | 4.27e-02 | 87 |
| Pathway ID | Tissue | Disease Stage | Description | Gene Ratio | Bg Ratio | pvalue | p.adjust | qvalue | Count |
| hsa05166211 | Esophagus | ESCC | Human T-cell leukemia virus 1 infection | 164/4205 | 222/8465 | 8.13e-14 | 2.09e-12 | 1.07e-12 | 164 |
| hsa05169210 | Esophagus | ESCC | Epstein-Barr virus infection | 151/4205 | 202/8465 | 1.55e-13 | 3.45e-12 | 1.77e-12 | 151 |
| hsa05417211 | Esophagus | ESCC | Lipid and atherosclerosis | 143/4205 | 215/8465 | 3.30e-07 | 2.45e-06 | 1.26e-06 | 143 |
| hsa0514525 | Esophagus | ESCC | Toxoplasmosis | 76/4205 | 112/8465 | 6.83e-05 | 2.90e-04 | 1.48e-04 | 76 |
| hsa040645 | Esophagus | ESCC | NF-kappa B signaling pathway | 67/4205 | 104/8465 | 1.62e-03 | 4.89e-03 | 2.50e-03 | 67 |
| hsa052028 | Esophagus | ESCC | Transcriptional misregulation in cancer | 116/4205 | 193/8465 | 2.08e-03 | 5.95e-03 | 3.05e-03 | 116 |
| hsa0541630 | Esophagus | ESCC | Viral myocarditis | 41/4205 | 60/8465 | 2.59e-03 | 7.05e-03 | 3.61e-03 | 41 |
| hsa05166310 | Esophagus | ESCC | Human T-cell leukemia virus 1 infection | 164/4205 | 222/8465 | 8.13e-14 | 2.09e-12 | 1.07e-12 | 164 |
| hsa0516937 | Esophagus | ESCC | Epstein-Barr virus infection | 151/4205 | 202/8465 | 1.55e-13 | 3.45e-12 | 1.77e-12 | 151 |
| hsa05417310 | Esophagus | ESCC | Lipid and atherosclerosis | 143/4205 | 215/8465 | 3.30e-07 | 2.45e-06 | 1.26e-06 | 143 |
| hsa05145111 | Esophagus | ESCC | Toxoplasmosis | 76/4205 | 112/8465 | 6.83e-05 | 2.90e-04 | 1.48e-04 | 76 |
| hsa0406412 | Esophagus | ESCC | NF-kappa B signaling pathway | 67/4205 | 104/8465 | 1.62e-03 | 4.89e-03 | 2.50e-03 | 67 |
| hsa0520213 | Esophagus | ESCC | Transcriptional misregulation in cancer | 116/4205 | 193/8465 | 2.08e-03 | 5.95e-03 | 3.05e-03 | 116 |
| hsa05416114 | Esophagus | ESCC | Viral myocarditis | 41/4205 | 60/8465 | 2.59e-03 | 7.05e-03 | 3.61e-03 | 41 |
| hsa0516928 | Oral cavity | OSCC | Epstein-Barr virus infection | 144/3704 | 202/8465 | 1.08e-15 | 3.60e-14 | 1.83e-14 | 144 |
| hsa0516630 | Oral cavity | OSCC | Human T-cell leukemia virus 1 infection | 150/3704 | 222/8465 | 3.68e-13 | 7.26e-12 | 3.70e-12 | 150 |
| hsa0541730 | Oral cavity | OSCC | Lipid and atherosclerosis | 131/3704 | 215/8465 | 2.20e-07 | 1.45e-06 | 7.37e-07 | 131 |
| hsa0514520 | Oral cavity | OSCC | Toxoplasmosis | 75/3704 | 112/8465 | 5.28e-07 | 3.16e-06 | 1.61e-06 | 75 |
| hsa040644 | Oral cavity | OSCC | NF-kappa B signaling pathway | 67/3704 | 104/8465 | 1.57e-05 | 6.75e-05 | 3.44e-05 | 67 |
| hsa0541629 | Oral cavity | OSCC | Viral myocarditis | 39/3704 | 60/8465 | 7.13e-04 | 2.09e-03 | 1.07e-03 | 39 |
| Hugo Symbol | Variant Class | Variant Classification | dbSNP RS | HGVSc | HGVSp | HGVSp Short | SWISSPROT | BIOTYPE | SIFT | PolyPhen | Tumor Sample Barcode | Tissue | Histology | Sex | Age | Stage | Therapy Types | Drugs | Outcome |
| CD40 | SNV | Missense_Mutation | | c.316G>A | p.Glu106Lys | p.E106K | P25942 | protein_coding | tolerated(1) | benign(0) | TCGA-D8-A1JA-01 | Breast | breast invasive carcinoma | Female | <65 | III/IV | Chemotherapy | adriamycin | PD |
| CD40 | SNV | Missense_Mutation | novel | c.808N>T | p.Arg270Cys | p.R270C | P25942 | protein_coding | deleterious(0) | probably_damaging(0.999) | TCGA-LL-A8F5-01 | Breast | breast invasive carcinoma | Female | <65 | I/II | Chemotherapy | cyclophosphamide | SD |
| CD40 | insertion | In_Frame_Ins | novel | c.241_242insGTGTGGGAGCTCCACGTTCACAGGATGGTGTCTTGC | p.Lys81delinsSerValGlyAlaProArgSerGlnAspGlyValLeuGln | p.K81delinsSVGAPRSQDGVLQ | P25942 | protein_coding | | | TCGA-A2-A0CP-01 | Breast | breast invasive carcinoma | Female | <65 | I/II | Chemotherapy | cytoxan | SD |
| CD40 | insertion | In_Frame_Ins | novel | c.643_644insAAGGGGAGGGGAGGCAGTTTGGGGGTGTGGTATCACAGC | p.Ile215delinsLysGlyGluGlyArgGlnPheGlyGlyValValSerGlnLeu | p.I215delinsKGEGRQFGGVVSQL | P25942 | protein_coding | | | TCGA-A2-A0CT-01 | Breast | breast invasive carcinoma | Female | >=65 | I/II | Chemotherapy | cytoxan | SD |
| CD40 | SNV | Missense_Mutation | | c.570N>A | p.Asp190Glu | p.D190E | P25942 | protein_coding | tolerated(0.26) | benign(0.01) | TCGA-AY-6197-01 | Colorectum | colon adenocarcinoma | Male | <65 | I/II | Unknown | Unknown | SD |
| CD40 | SNV | Missense_Mutation | | c.131N>T | p.Gly44Val | p.G44V | P25942 | protein_coding | deleterious(0) | probably_damaging(1) | TCGA-CM-5348-01 | Colorectum | colon adenocarcinoma | Male | >=65 | III/IV | Unknown | Unknown | SD |
| CD40 | SNV | Missense_Mutation | | c.8G>A | p.Arg3His | p.R3H | P25942 | protein_coding | tolerated(0.06) | possibly_damaging(0.642) | TCGA-G4-6303-01 | Colorectum | colon adenocarcinoma | Female | <65 | III/IV | Chemotherapy | 5-fu | PD |
| CD40 | SNV | Missense_Mutation | | c.475G>A | p.Glu159Lys | p.E159K | P25942 | protein_coding | deleterious(0.02) | possibly_damaging(0.866) | TCGA-AG-A002-01 | Colorectum | rectum adenocarcinoma | Male | <65 | I/II | Unknown | Unknown | SD |
| CD40 | SNV | Missense_Mutation | novel | c.505A>C | p.Thr169Pro | p.T169P | P25942 | protein_coding | tolerated(0.15) | benign(0.184) | TCGA-EI-6917-01 | Colorectum | rectum adenocarcinoma | Male | <65 | III/IV | Chemotherapy | 5fluorouracil+oxaciplatina+l-folinian | SD |
| CD40 | SNV | Missense_Mutation | novel | c.662A>C | p.Lys221Thr | p.K221T | P25942 | protein_coding | tolerated(0.07) | benign(0.15) | TCGA-F5-6814-01 | Colorectum | rectum adenocarcinoma | Male | <65 | I/II | Unknown | Unknown | SD |
| Entrez ID | Symbol | Category | Interaction Types | Drug Claim Name | Drug Name | PMIDs |
| 958 | CD40 | CLINICALLY ACTIONABLE, CELL SURFACE, EXTERNAL SIDE OF PLASMA MEMBRANE, DRUGGABLE GENOME, TRANSCRIPTION FACTOR | | LUCATUMUMAB | LUCATUMUMAB | |
| 958 | CD40 | CLINICALLY ACTIONABLE, CELL SURFACE, EXTERNAL SIDE OF PLASMA MEMBRANE, DRUGGABLE GENOME, TRANSCRIPTION FACTOR | | APX005M | APX-005M | |
| 958 | CD40 | CLINICALLY ACTIONABLE, CELL SURFACE, EXTERNAL SIDE OF PLASMA MEMBRANE, DRUGGABLE GENOME, TRANSCRIPTION FACTOR | | BI 655064 | | |
| 958 | CD40 | CLINICALLY ACTIONABLE, CELL SURFACE, EXTERNAL SIDE OF PLASMA MEMBRANE, DRUGGABLE GENOME, TRANSCRIPTION FACTOR | | ABBV-323 | RAVAGALIMAB | |
| 958 | CD40 | CLINICALLY ACTIONABLE, CELL SURFACE, EXTERNAL SIDE OF PLASMA MEMBRANE, DRUGGABLE GENOME, TRANSCRIPTION FACTOR | | RECOMBINANT HUMAN IL-2 | | 10383947 |
| 958 | CD40 | CLINICALLY ACTIONABLE, CELL SURFACE, EXTERNAL SIDE OF PLASMA MEMBRANE, DRUGGABLE GENOME, TRANSCRIPTION FACTOR | | KINASE INHIBITOR | | 17307797 |
| 958 | CD40 | CLINICALLY ACTIONABLE, CELL SURFACE, EXTERNAL SIDE OF PLASMA MEMBRANE, DRUGGABLE GENOME, TRANSCRIPTION FACTOR | partial agonist | CHEMBL2108144 | TENELIXIMAB | |
| 958 | CD40 | CLINICALLY ACTIONABLE, CELL SURFACE, EXTERNAL SIDE OF PLASMA MEMBRANE, DRUGGABLE GENOME, TRANSCRIPTION FACTOR | | CFZ533 | ISCALIMAB | |
| 958 | CD40 | CLINICALLY ACTIONABLE, CELL SURFACE, EXTERNAL SIDE OF PLASMA MEMBRANE, DRUGGABLE GENOME, TRANSCRIPTION FACTOR | | SGN-14 | | 10866315 |
| 958 | CD40 | CLINICALLY ACTIONABLE, CELL SURFACE, EXTERNAL SIDE OF PLASMA MEMBRANE, DRUGGABLE GENOME, TRANSCRIPTION FACTOR | | HYDROQUINONE | HYDROQUINONE | 17118622 |


