
|
|||||
|
 | |
| |
| |
| |
| |
| |
|
Gene: CAB39 |
Gene summary for CAB39 |
| Gene information | Species | Human | Gene symbol | CAB39 | Gene ID | 51719 |
| Gene name | calcium binding protein 39 | |
| Gene Alias | CGI-66 | |
| Cytomap | 2q37.1 | |
| Gene Type | protein-coding | GO ID | GO:0001932 | UniProtAcc | A0A024R496 |
Top |
Malignant transformation analysis |
| Identification of the aberrant gene expression in precancerous and cancerous lesions by comparing the gene expression of stem-like cells in diseased tissues with normal stem cells |
| Entrez ID | Symbol | Replicates | Species | Organ | Tissue | Adj P-value | Log2FC | Malignancy |
| 51719 | CAB39 | HTA11_347_2000001011 | Human | Colorectum | AD | 1.43e-08 | 5.41e-01 | -0.1954 |
| 51719 | CAB39 | HTA11_411_2000001011 | Human | Colorectum | SER | 2.51e-02 | 7.51e-01 | -0.2602 |
| 51719 | CAB39 | HTA11_99999965062_69753 | Human | Colorectum | MSI-H | 1.56e-02 | 8.31e-01 | 0.3487 |
| 51719 | CAB39 | HTA11_99999965104_69814 | Human | Colorectum | MSS | 3.05e-09 | 6.92e-01 | 0.281 |
| 51719 | CAB39 | A015-C-203 | Human | Colorectum | FAP | 1.51e-27 | -3.78e-01 | -0.1294 |
| 51719 | CAB39 | A015-C-204 | Human | Colorectum | FAP | 3.37e-06 | -3.58e-01 | -0.0228 |
| 51719 | CAB39 | A002-C-201 | Human | Colorectum | FAP | 7.33e-09 | -3.29e-01 | 0.0324 |
| 51719 | CAB39 | A002-C-203 | Human | Colorectum | FAP | 1.79e-03 | -1.48e-01 | 0.2786 |
| 51719 | CAB39 | A001-C-119 | Human | Colorectum | FAP | 2.42e-07 | -3.62e-01 | -0.1557 |
| 51719 | CAB39 | A001-C-108 | Human | Colorectum | FAP | 6.25e-16 | -3.51e-01 | -0.0272 |
| 51719 | CAB39 | A002-C-205 | Human | Colorectum | FAP | 3.89e-18 | -4.28e-01 | -0.1236 |
| 51719 | CAB39 | A001-C-104 | Human | Colorectum | FAP | 1.44e-02 | -2.36e-01 | 0.0184 |
| 51719 | CAB39 | A015-C-006 | Human | Colorectum | FAP | 6.20e-14 | -5.35e-01 | -0.0994 |
| 51719 | CAB39 | A015-C-106 | Human | Colorectum | FAP | 2.25e-09 | -2.44e-01 | -0.0511 |
| 51719 | CAB39 | A002-C-114 | Human | Colorectum | FAP | 1.91e-16 | -4.81e-01 | -0.1561 |
| 51719 | CAB39 | A015-C-104 | Human | Colorectum | FAP | 6.65e-31 | -4.26e-01 | -0.1899 |
| 51719 | CAB39 | A001-C-014 | Human | Colorectum | FAP | 6.75e-18 | -3.01e-01 | 0.0135 |
| 51719 | CAB39 | A002-C-016 | Human | Colorectum | FAP | 3.59e-17 | -2.83e-01 | 0.0521 |
| 51719 | CAB39 | A015-C-002 | Human | Colorectum | FAP | 3.78e-07 | -3.17e-01 | -0.0763 |
| 51719 | CAB39 | A001-C-203 | Human | Colorectum | FAP | 1.01e-08 | -1.67e-01 | -0.0481 |
| Page: 1 2 3 4 5 6 7 8 |
| Tissue | Expression Dynamics | Abbreviation |
| Colorectum (GSE201348) |  | FAP: Familial adenomatous polyposis |
| CRC: Colorectal cancer | ||
| Colorectum (HTA11) |  | AD: Adenomas |
| SER: Sessile serrated lesions | ||
| MSI-H: Microsatellite-high colorectal cancer | ||
| MSS: Microsatellite stable colorectal cancer | ||
| Esophagus | 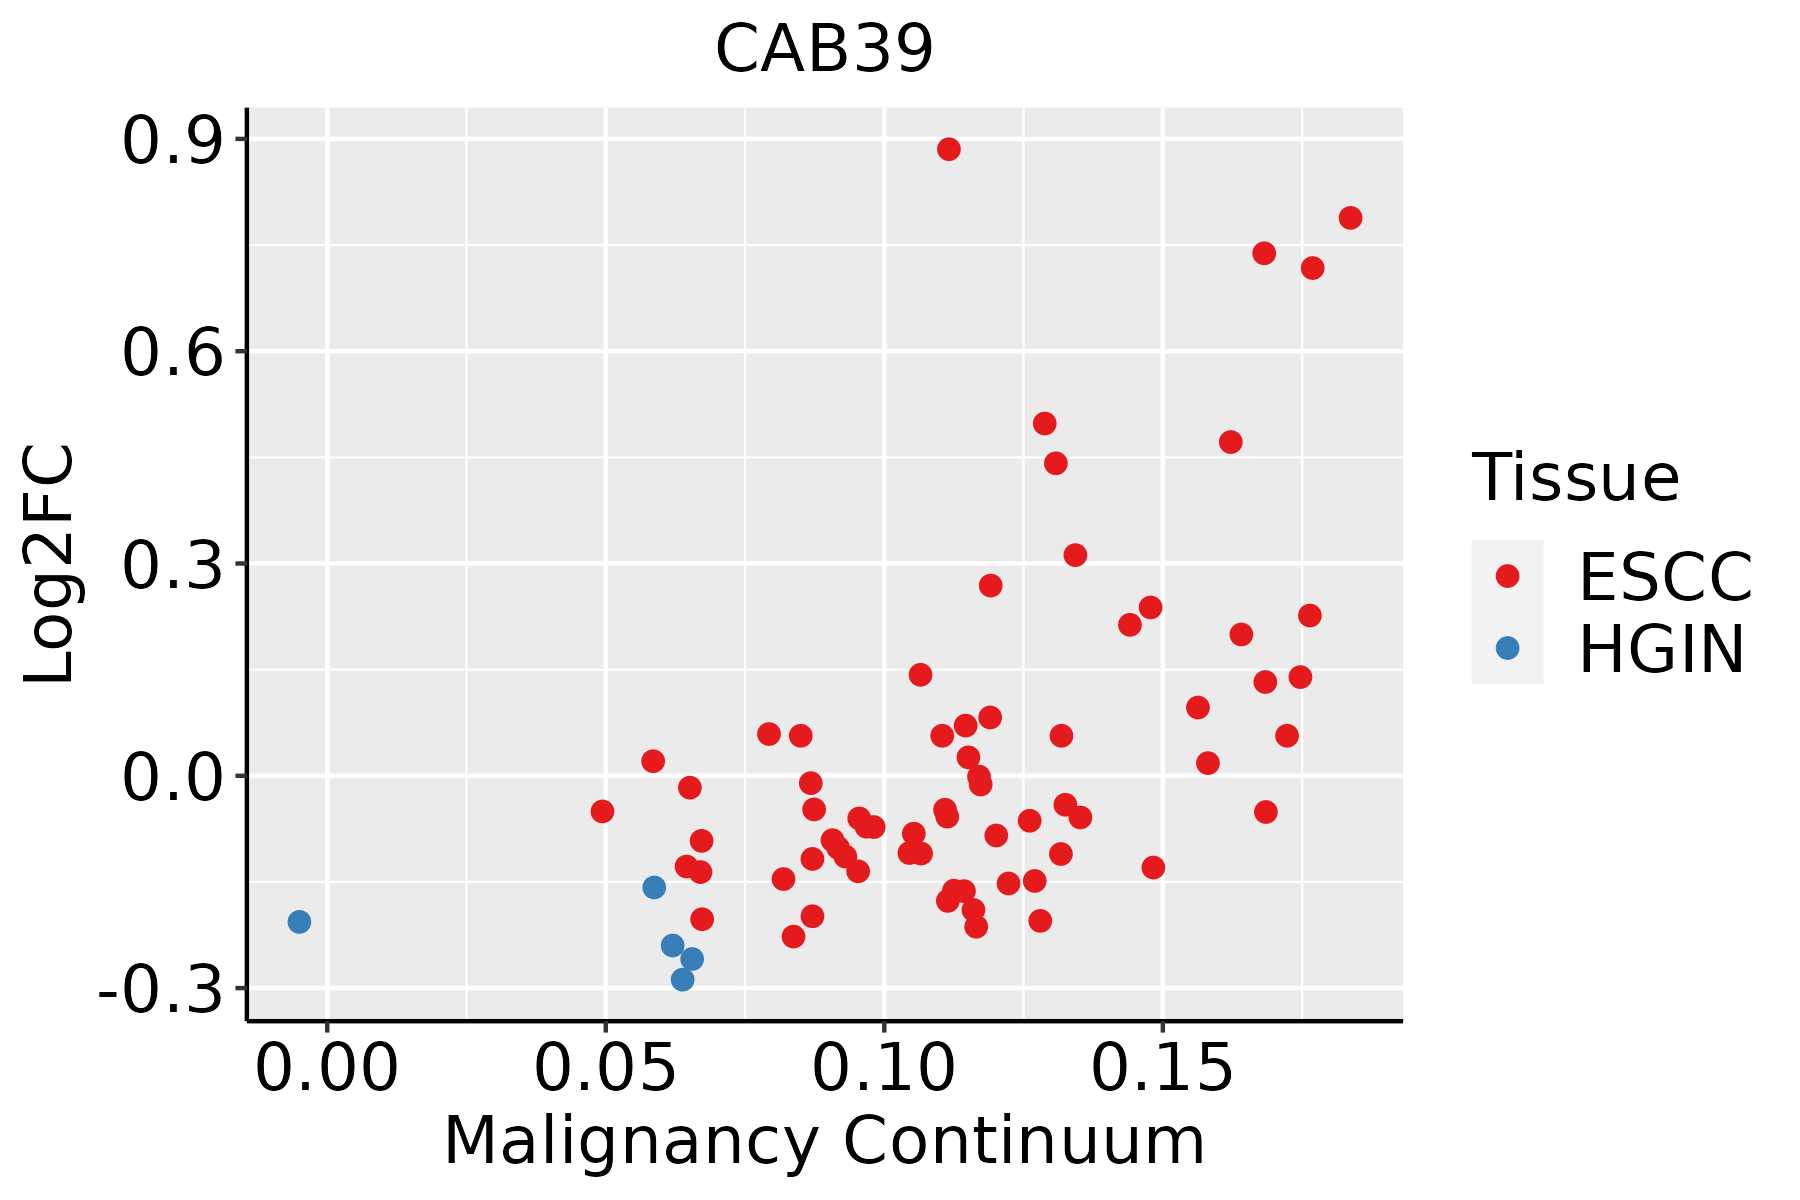 | ESCC: Esophageal squamous cell carcinoma |
| HGIN: High-grade intraepithelial neoplasias | ||
| LGIN: Low-grade intraepithelial neoplasias | ||
| Liver | 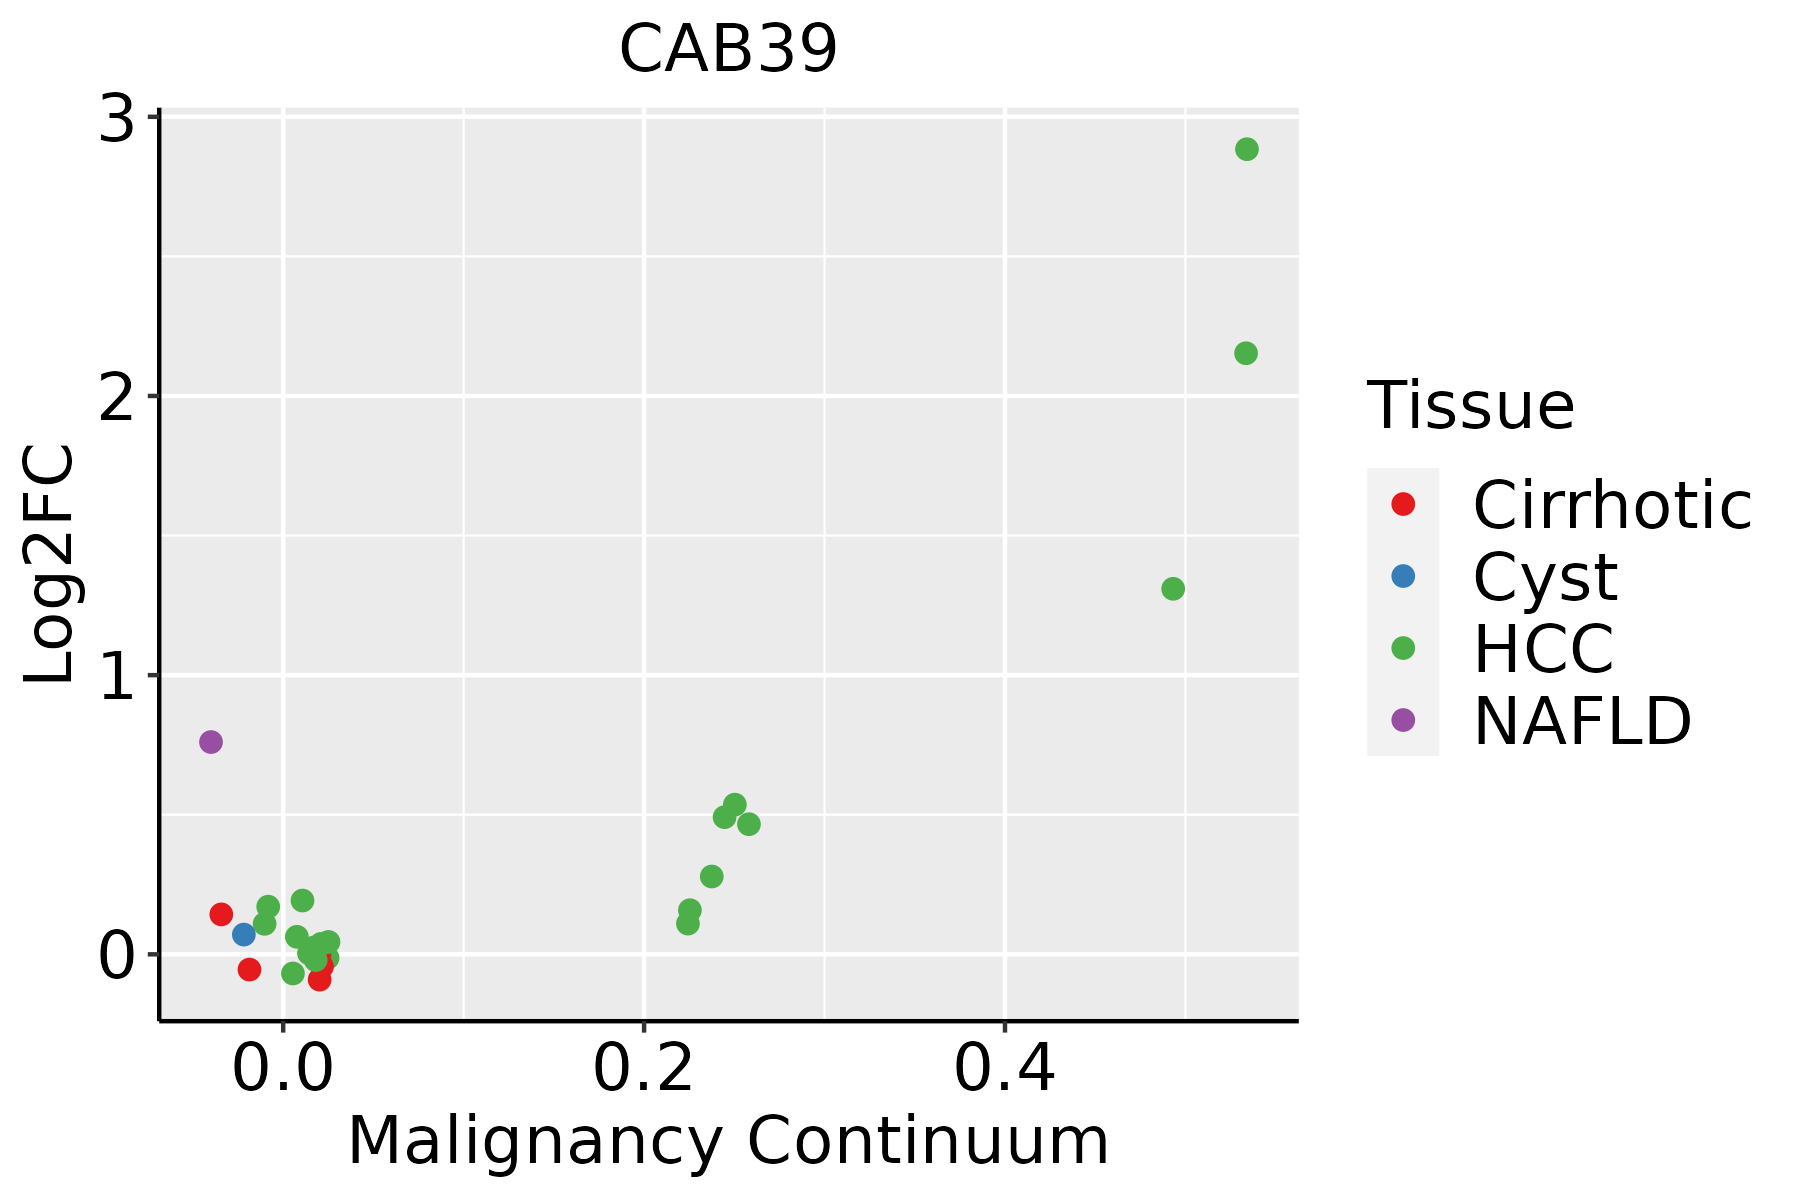 | HCC: Hepatocellular carcinoma |
| NAFLD: Non-alcoholic fatty liver disease | ||
| Oral Cavity | 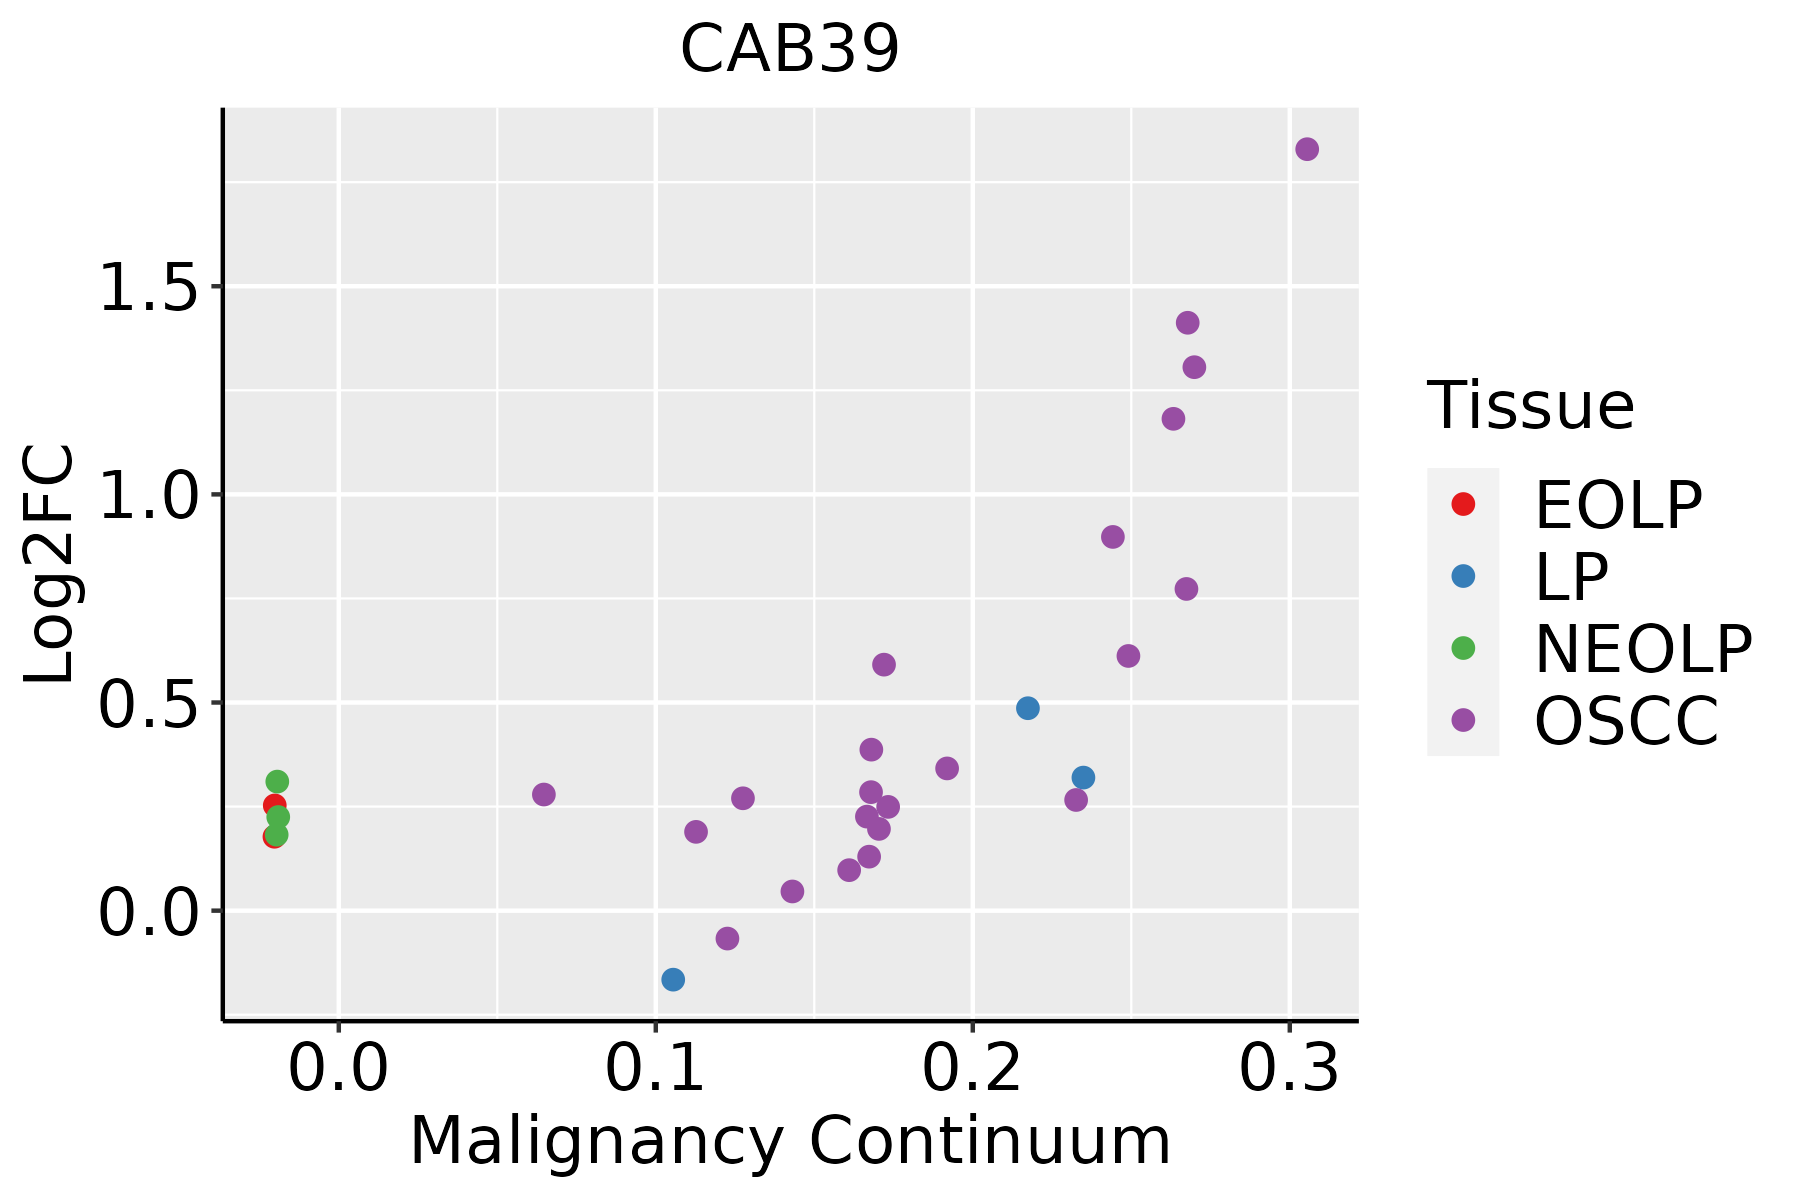 | EOLP: Erosive Oral lichen planus |
| LP: leukoplakia | ||
| NEOLP: Non-erosive oral lichen planus | ||
| OSCC: Oral squamous cell carcinoma | ||
| Prostate | 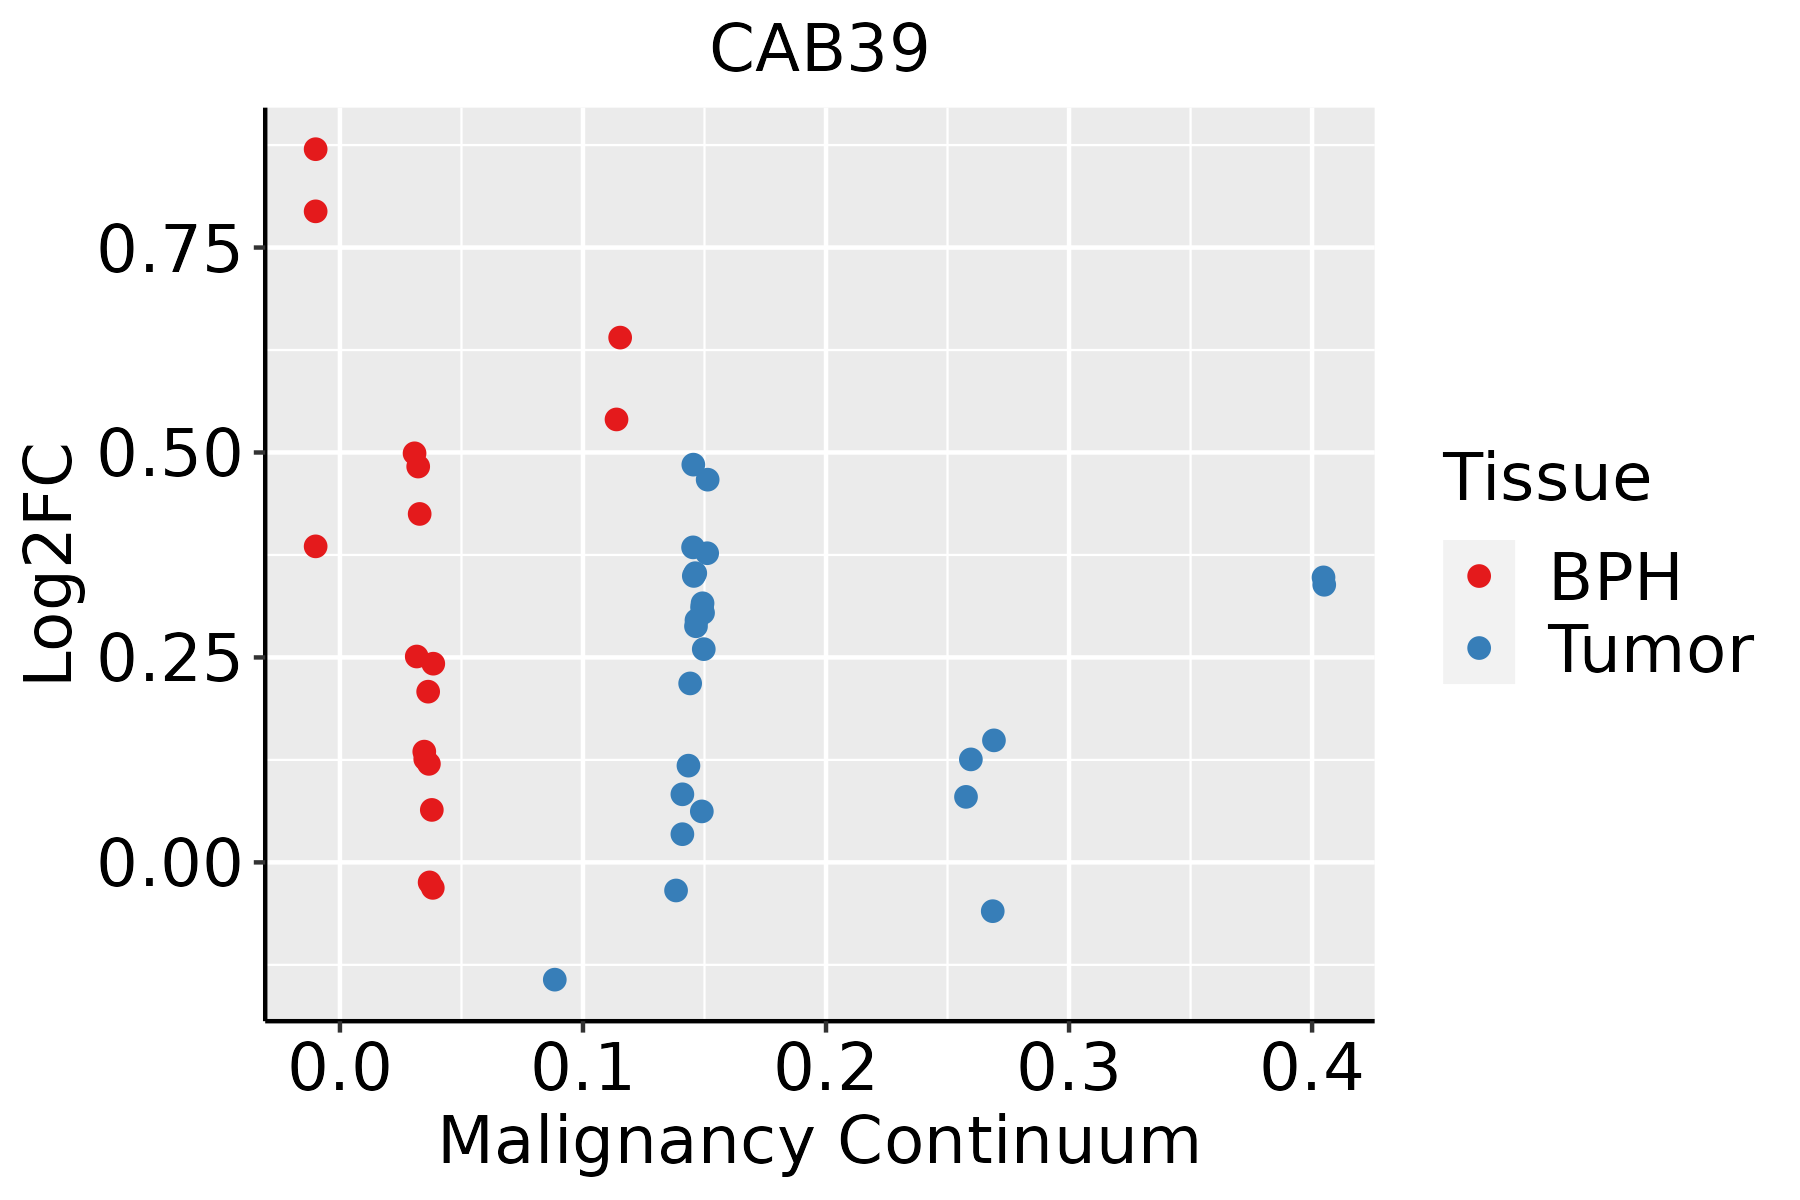 | BPH: Benign Prostatic Hyperplasia |
| Skin |  | AK: Actinic keratosis |
| cSCC: Cutaneous squamous cell carcinoma | ||
| SCCIS:squamous cell carcinoma in situ | ||
| Thyroid | 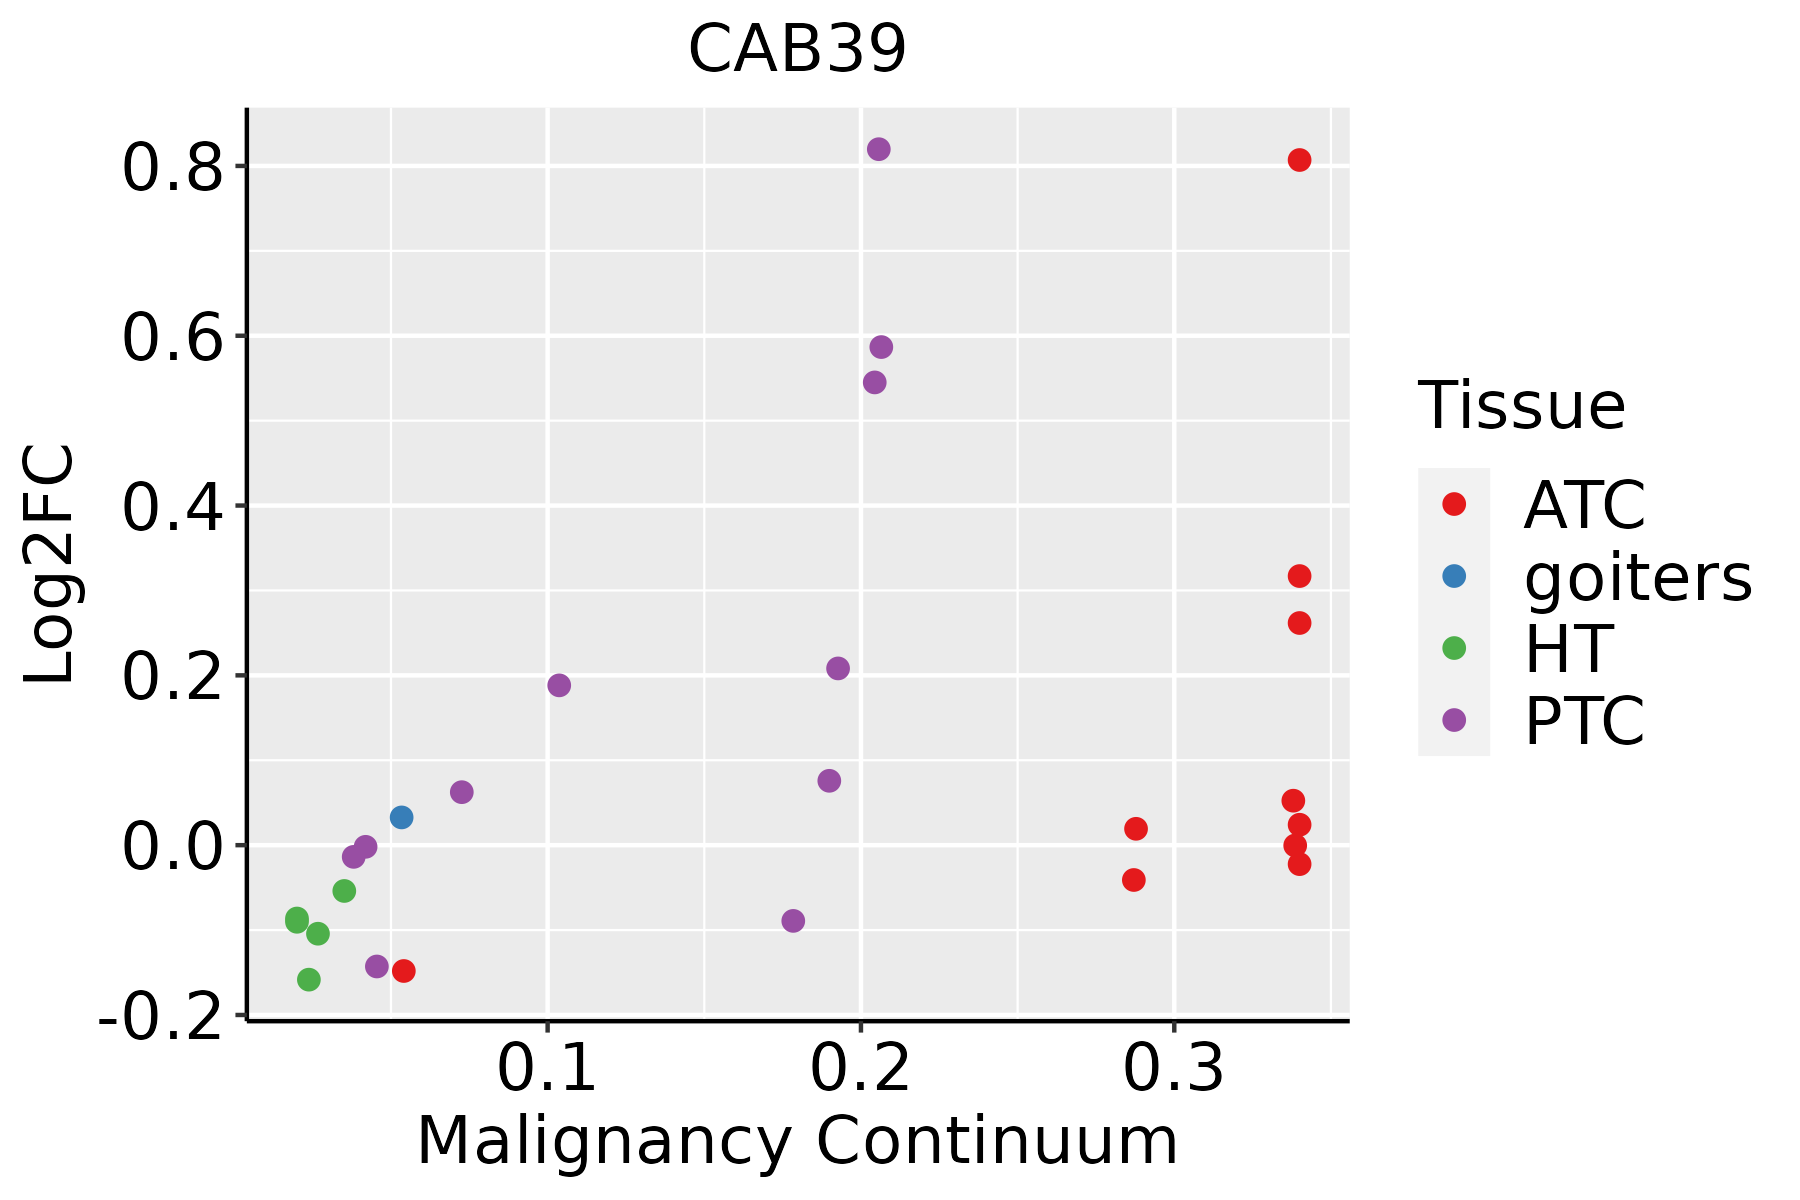 | ATC: Anaplastic thyroid cancer |
| HT: Hashimoto's thyroiditis | ||
| PTC: Papillary thyroid cancer |
| ∗log2FC in expression of this searched gene in stem-like cells from each diseased tissue sample relative to stem-like cells in normal samples in each tissue plotted against the malignancy continuum. Samples are colored based on if they are from different disease stage. |
Top |
Malignant transformation related pathway analysis |
| Find out the enriched GO biological processes and KEGG pathways involved in transition from healthy to precancer to cancer |
| Tissue | Disease Stage | Enriched GO biological Processes |
| Colorectum | AD |  |
| Colorectum | SER |  |
| Colorectum | MSS |  |
| Colorectum | MSI-H |  |
| Colorectum | FAP |  |
| ∗Top 15 enriched GO BP terms are showed in the bar plot of each disease state in each tissue. Each row represents a significant GO biological process which is colored according to the -log10(p.adjust). |
| Page: 1 2 3 4 5 6 7 8 9 |
| GO ID | Tissue | Disease Stage | Description | Gene Ratio | Bg Ratio | pvalue | p.adjust | Count |
| GO:001810519 | Thyroid | ATC | peptidyl-serine phosphorylation | 153/6293 | 315/18723 | 2.28e-08 | 4.42e-07 | 153 |
| GO:001820917 | Thyroid | ATC | peptidyl-serine modification | 161/6293 | 338/18723 | 5.23e-08 | 9.44e-07 | 161 |
| GO:003367427 | Thyroid | ATC | positive regulation of kinase activity | 212/6293 | 467/18723 | 5.89e-08 | 1.05e-06 | 212 |
| GO:001810718 | Thyroid | ATC | peptidyl-threonine phosphorylation | 63/6293 | 116/18723 | 3.47e-06 | 3.89e-05 | 63 |
| GO:001821018 | Thyroid | ATC | peptidyl-threonine modification | 66/6293 | 125/18723 | 7.36e-06 | 7.56e-05 | 66 |
| GO:007190215 | Thyroid | ATC | positive regulation of protein serine/threonine kinase activity | 96/6293 | 200/18723 | 1.63e-05 | 1.51e-04 | 96 |
| GO:000697016 | Thyroid | ATC | response to osmotic stress | 45/6293 | 84/18723 | 1.27e-04 | 9.03e-04 | 45 |
| GO:003214711 | Thyroid | ATC | activation of protein kinase activity | 65/6293 | 134/18723 | 2.44e-04 | 1.57e-03 | 65 |
| GO:007147015 | Thyroid | ATC | cellular response to osmotic stress | 23/6293 | 41/18723 | 2.53e-03 | 1.16e-02 | 23 |
| GO:001482313 | Thyroid | ATC | response to activity | 37/6293 | 76/18723 | 4.57e-03 | 1.89e-02 | 37 |
| GO:00108001 | Thyroid | ATC | positive regulation of peptidyl-threonine phosphorylation | 17/6293 | 30/18723 | 7.88e-03 | 3.06e-02 | 17 |
| GO:005105114 | Thyroid | ATC | negative regulation of transport | 183/6293 | 470/18723 | 8.12e-03 | 3.13e-02 | 183 |
| GO:009706621 | Thyroid | ATC | response to thyroid hormone | 15/6293 | 26/18723 | 9.95e-03 | 3.63e-02 | 15 |
| Page: 1 2 3 4 5 6 7 8 9 10 11 12 13 |
| Pathway ID | Tissue | Disease Stage | Description | Gene Ratio | Bg Ratio | pvalue | p.adjust | qvalue | Count |
| hsa04152 | Colorectum | AD | AMPK signaling pathway | 47/2092 | 121/8465 | 3.74e-04 | 2.82e-03 | 1.80e-03 | 47 |
| hsa041521 | Colorectum | AD | AMPK signaling pathway | 47/2092 | 121/8465 | 3.74e-04 | 2.82e-03 | 1.80e-03 | 47 |
| hsa041522 | Colorectum | MSS | AMPK signaling pathway | 41/1875 | 121/8465 | 1.91e-03 | 9.83e-03 | 6.03e-03 | 41 |
| hsa04150 | Colorectum | MSS | mTOR signaling pathway | 47/1875 | 156/8465 | 1.19e-02 | 3.99e-02 | 2.44e-02 | 47 |
| hsa041523 | Colorectum | MSS | AMPK signaling pathway | 41/1875 | 121/8465 | 1.91e-03 | 9.83e-03 | 6.03e-03 | 41 |
| hsa041501 | Colorectum | MSS | mTOR signaling pathway | 47/1875 | 156/8465 | 1.19e-02 | 3.99e-02 | 2.44e-02 | 47 |
| hsa041524 | Colorectum | FAP | AMPK signaling pathway | 37/1404 | 121/8465 | 8.97e-05 | 8.56e-04 | 5.21e-04 | 37 |
| hsa041525 | Colorectum | FAP | AMPK signaling pathway | 37/1404 | 121/8465 | 8.97e-05 | 8.56e-04 | 5.21e-04 | 37 |
| hsa041526 | Colorectum | CRC | AMPK signaling pathway | 31/1091 | 121/8465 | 1.04e-04 | 1.57e-03 | 1.07e-03 | 31 |
| hsa041527 | Colorectum | CRC | AMPK signaling pathway | 31/1091 | 121/8465 | 1.04e-04 | 1.57e-03 | 1.07e-03 | 31 |
| hsa0415210 | Esophagus | ESCC | AMPK signaling pathway | 80/4205 | 121/8465 | 1.73e-04 | 6.67e-04 | 3.42e-04 | 80 |
| hsa041505 | Esophagus | ESCC | mTOR signaling pathway | 98/4205 | 156/8465 | 5.81e-04 | 1.95e-03 | 9.97e-04 | 98 |
| hsa0415213 | Esophagus | ESCC | AMPK signaling pathway | 80/4205 | 121/8465 | 1.73e-04 | 6.67e-04 | 3.42e-04 | 80 |
| hsa0415013 | Esophagus | ESCC | mTOR signaling pathway | 98/4205 | 156/8465 | 5.81e-04 | 1.95e-03 | 9.97e-04 | 98 |
| hsa041528 | Liver | NAFLD | AMPK signaling pathway | 28/1043 | 121/8465 | 6.26e-04 | 9.78e-03 | 7.88e-03 | 28 |
| hsa0415211 | Liver | NAFLD | AMPK signaling pathway | 28/1043 | 121/8465 | 6.26e-04 | 9.78e-03 | 7.88e-03 | 28 |
| hsa0415221 | Liver | Cirrhotic | AMPK signaling pathway | 49/2530 | 121/8465 | 7.90e-03 | 2.74e-02 | 1.69e-02 | 49 |
| hsa0415231 | Liver | Cirrhotic | AMPK signaling pathway | 49/2530 | 121/8465 | 7.90e-03 | 2.74e-02 | 1.69e-02 | 49 |
| hsa0415241 | Liver | HCC | AMPK signaling pathway | 77/4020 | 121/8465 | 2.32e-04 | 1.11e-03 | 6.18e-04 | 77 |
| hsa041502 | Liver | HCC | mTOR signaling pathway | 95/4020 | 156/8465 | 4.70e-04 | 1.99e-03 | 1.11e-03 | 95 |
| Page: 1 2 |
Top |
Cell-cell communication analysis |
| Identification of potential cell-cell interactions between two cell types and their ligand-receptor pairs for different disease states |
| Ligand | Receptor | LRpair | Pathway | Tissue | Disease Stage |
| Page: 1 |
Top |
Single-cell gene regulatory network inference analysis |
| Find out the significant the regulons (TFs) and the target genes of each regulon across cell types for different disease states |
| TF | Cell Type | Tissue | Disease Stage | Target Gene | RSS | Regulon Activity |
| ∗The dot plots of a searched regulon are shown for all cell subpopulations in each disease state of each tissue based on the regulon specific score inferred using pySCENIC and by calculating the average expression. |
| Page: 1 |
Top |
Somatic mutation of malignant transformation related genes |
| Annotation of somatic variants for genes involved in malignant transformation |
| Hugo Symbol | Variant Class | Variant Classification | dbSNP RS | HGVSc | HGVSp | HGVSp Short | SWISSPROT | BIOTYPE | SIFT | PolyPhen | Tumor Sample Barcode | Tissue | Histology | Sex | Age | Stage | Therapy Types | Drugs | Outcome |
| CAB39 | insertion | Frame_Shift_Ins | novel | c.507_508insAGGCCAAAGACAG | p.Phe170ArgfsTer14 | p.F170Rfs*14 | Q9Y376 | protein_coding | TCGA-DS-A1OD-01 | Cervix | cervical & endocervical cancer | Female | <65 | I/II | Chemotherapy | cisplatin | SD | ||
| CAB39 | SNV | Missense_Mutation | novel | c.158N>G | p.Ile53Ser | p.I53S | Q9Y376 | protein_coding | tolerated(0.09) | benign(0.349) | TCGA-CA-6717-01 | Colorectum | colon adenocarcinoma | Male | <65 | I/II | Chemotherapy | oxaliplatin | CR |
| CAB39 | SNV | Missense_Mutation | rs372860193 | c.520N>A | p.Glu174Lys | p.E174K | Q9Y376 | protein_coding | deleterious(0) | possibly_damaging(0.779) | TCGA-CA-6717-01 | Colorectum | colon adenocarcinoma | Male | <65 | I/II | Chemotherapy | oxaliplatin | CR |
| CAB39 | SNV | Missense_Mutation | c.160N>A | p.Leu54Met | p.L54M | Q9Y376 | protein_coding | deleterious(0.03) | possibly_damaging(0.892) | TCGA-F5-6814-01 | Colorectum | rectum adenocarcinoma | Male | <65 | I/II | Unknown | Unknown | SD | |
| CAB39 | SNV | Missense_Mutation | c.70G>A | p.Ala24Thr | p.A24T | Q9Y376 | protein_coding | tolerated(0.57) | benign(0) | TCGA-A5-A0VQ-01 | Endometrium | uterine corpus endometrioid carcinoma | Female | <65 | I/II | Chemotherapy | carboplatin | SD | |
| CAB39 | SNV | Missense_Mutation | novel | c.829N>A | p.Val277Ile | p.V277I | Q9Y376 | protein_coding | deleterious(0.03) | possibly_damaging(0.906) | TCGA-A5-A2K5-01 | Endometrium | uterine corpus endometrioid carcinoma | Female | >=65 | I/II | Unknown | Unknown | SD |
| CAB39 | SNV | Missense_Mutation | rs757388040 | c.335C>T | p.Thr112Met | p.T112M | Q9Y376 | protein_coding | deleterious(0.04) | possibly_damaging(0.807) | TCGA-AP-A059-01 | Endometrium | uterine corpus endometrioid carcinoma | Female | >=65 | I/II | Unknown | Unknown | SD |
| CAB39 | SNV | Missense_Mutation | c.160N>A | p.Leu54Met | p.L54M | Q9Y376 | protein_coding | deleterious(0.03) | possibly_damaging(0.892) | TCGA-AP-A0LM-01 | Endometrium | uterine corpus endometrioid carcinoma | Female | <65 | III/IV | Chemotherapy | cisplatin | SD | |
| CAB39 | SNV | Missense_Mutation | c.38N>T | p.Ala13Val | p.A13V | Q9Y376 | protein_coding | tolerated(0.32) | benign(0.05) | TCGA-AP-A0LT-01 | Endometrium | uterine corpus endometrioid carcinoma | Female | <65 | I/II | Unknown | Unknown | SD | |
| CAB39 | SNV | Missense_Mutation | c.70N>A | p.Ala24Thr | p.A24T | Q9Y376 | protein_coding | tolerated(0.57) | benign(0) | TCGA-AP-A1DK-01 | Endometrium | uterine corpus endometrioid carcinoma | Female | <65 | I/II | Unknown | Unknown | SD |
| Page: 1 2 3 |
Top |
Related drugs of malignant transformation related genes |
| Identification of chemicals and drugs interact with genes involved in malignant transfromation |
| (DGIdb 4.0) |
| Entrez ID | Symbol | Category | Interaction Types | Drug Claim Name | Drug Name | PMIDs |
| Page: 1 |

Copyright 2023-Present -The University of Texas Health Science Center at Houston |