| Tissue | Expression Dynamics | Abbreviation |
| Endometrium | 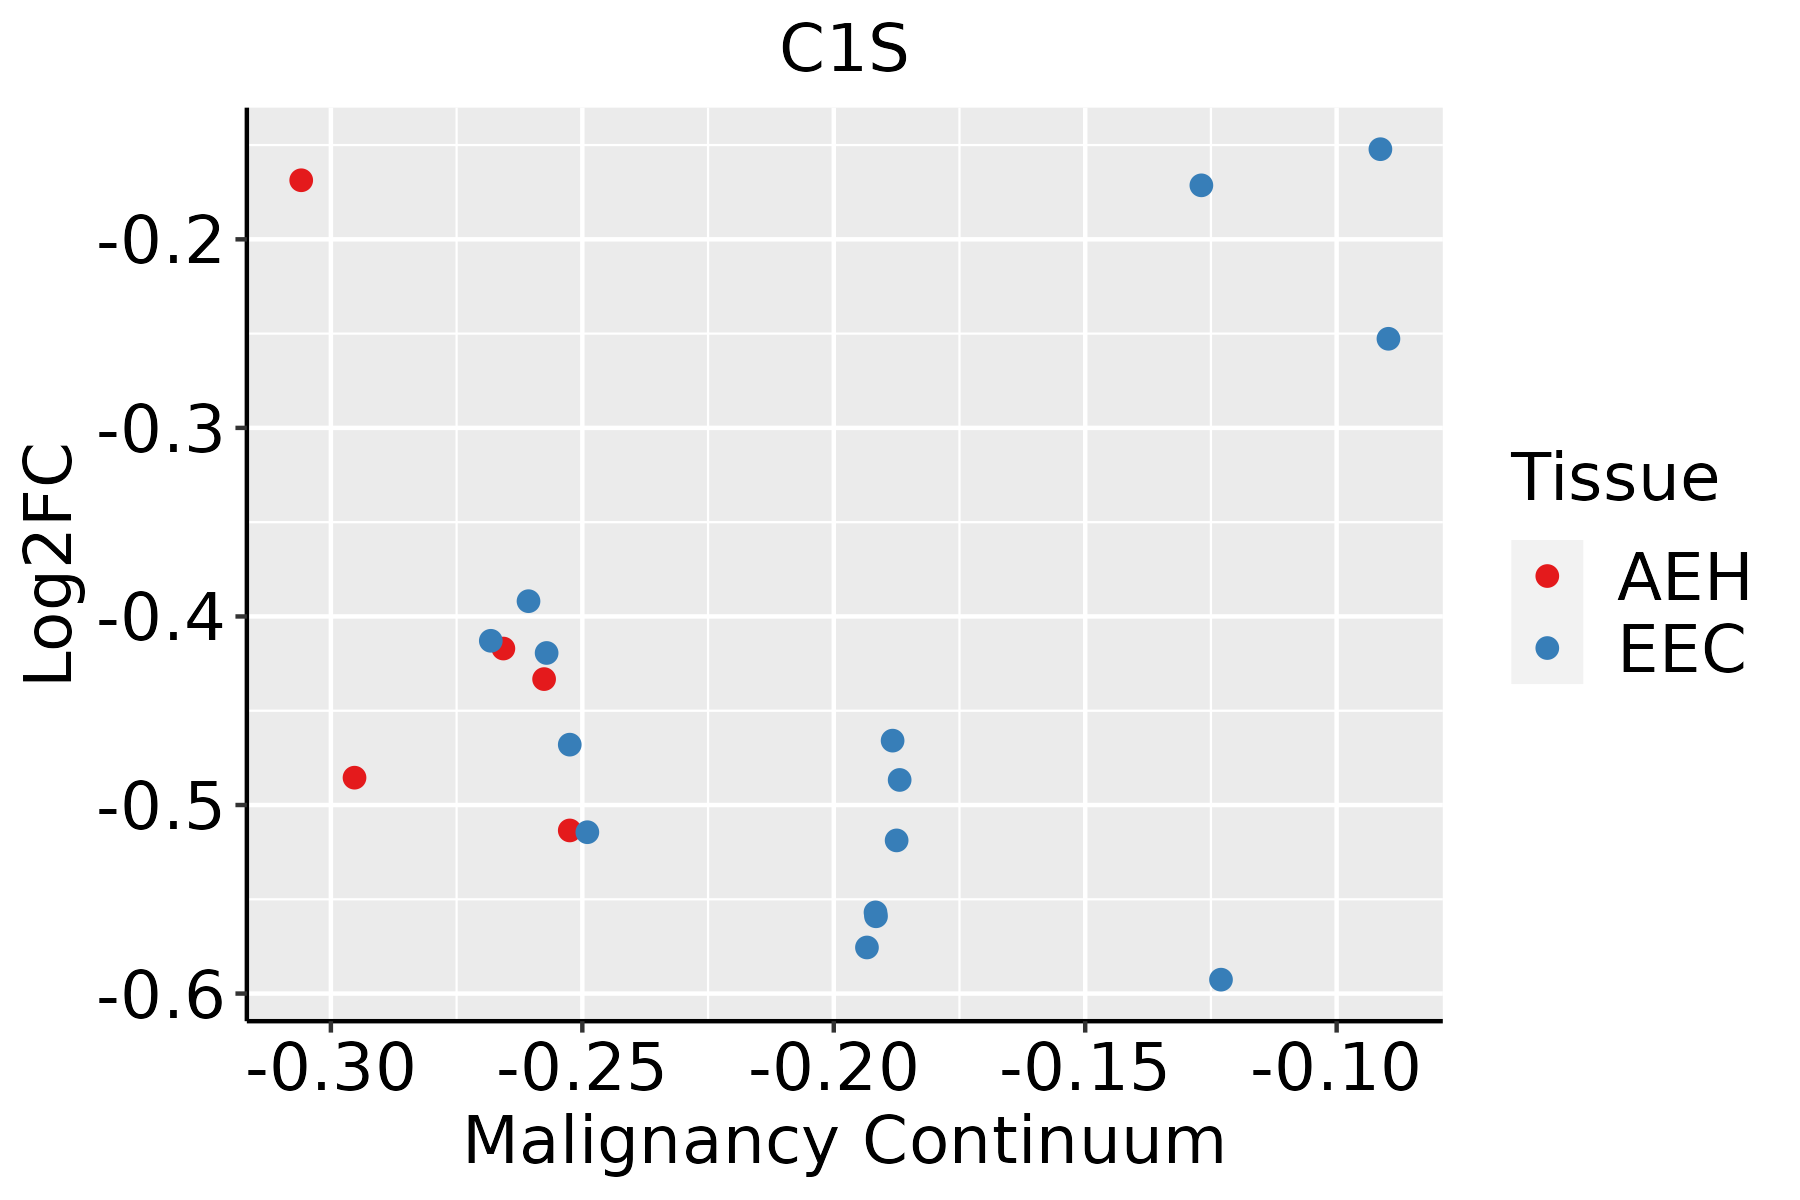 | AEH: Atypical endometrial hyperplasia |
| EEC: Endometrioid Cancer |
| Esophagus | 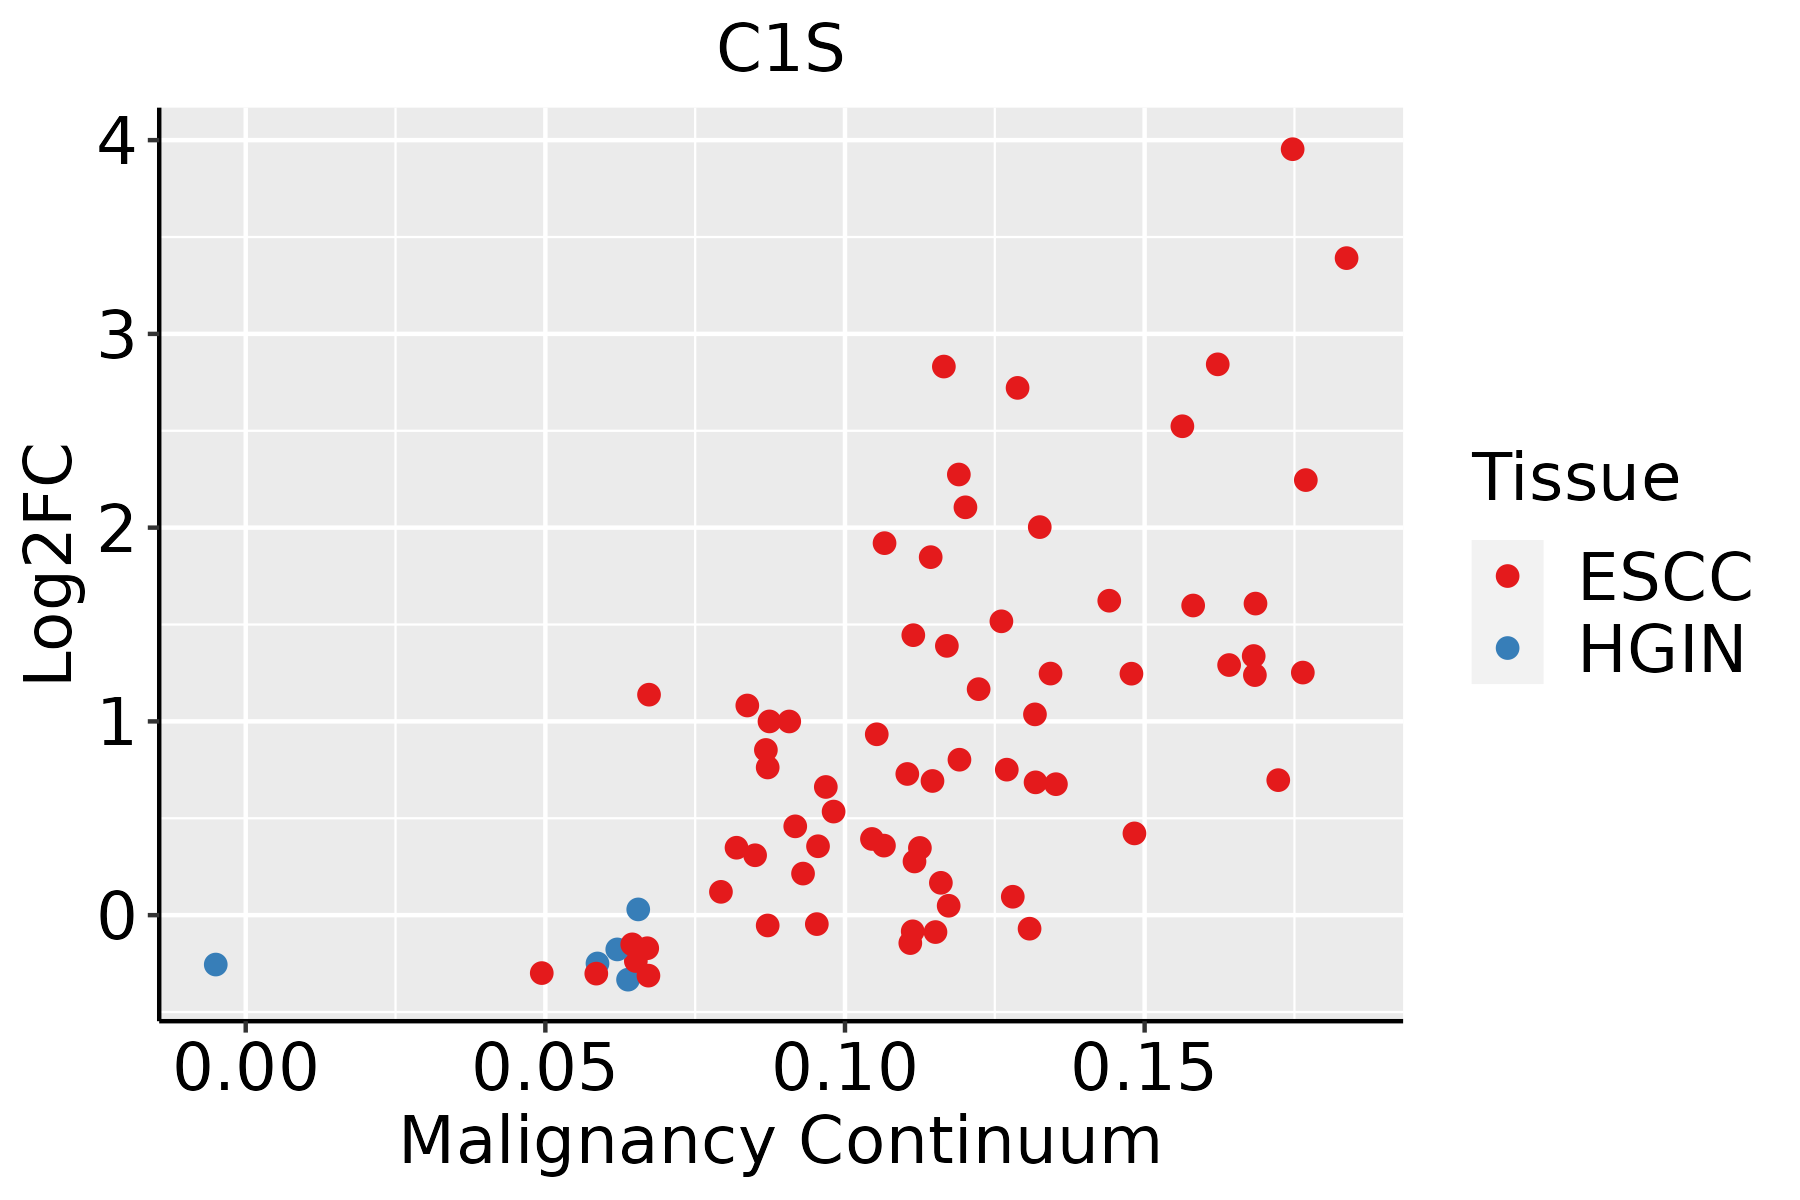 | ESCC: Esophageal squamous cell carcinoma |
| HGIN: High-grade intraepithelial neoplasias |
| LGIN: Low-grade intraepithelial neoplasias |
| Liver | 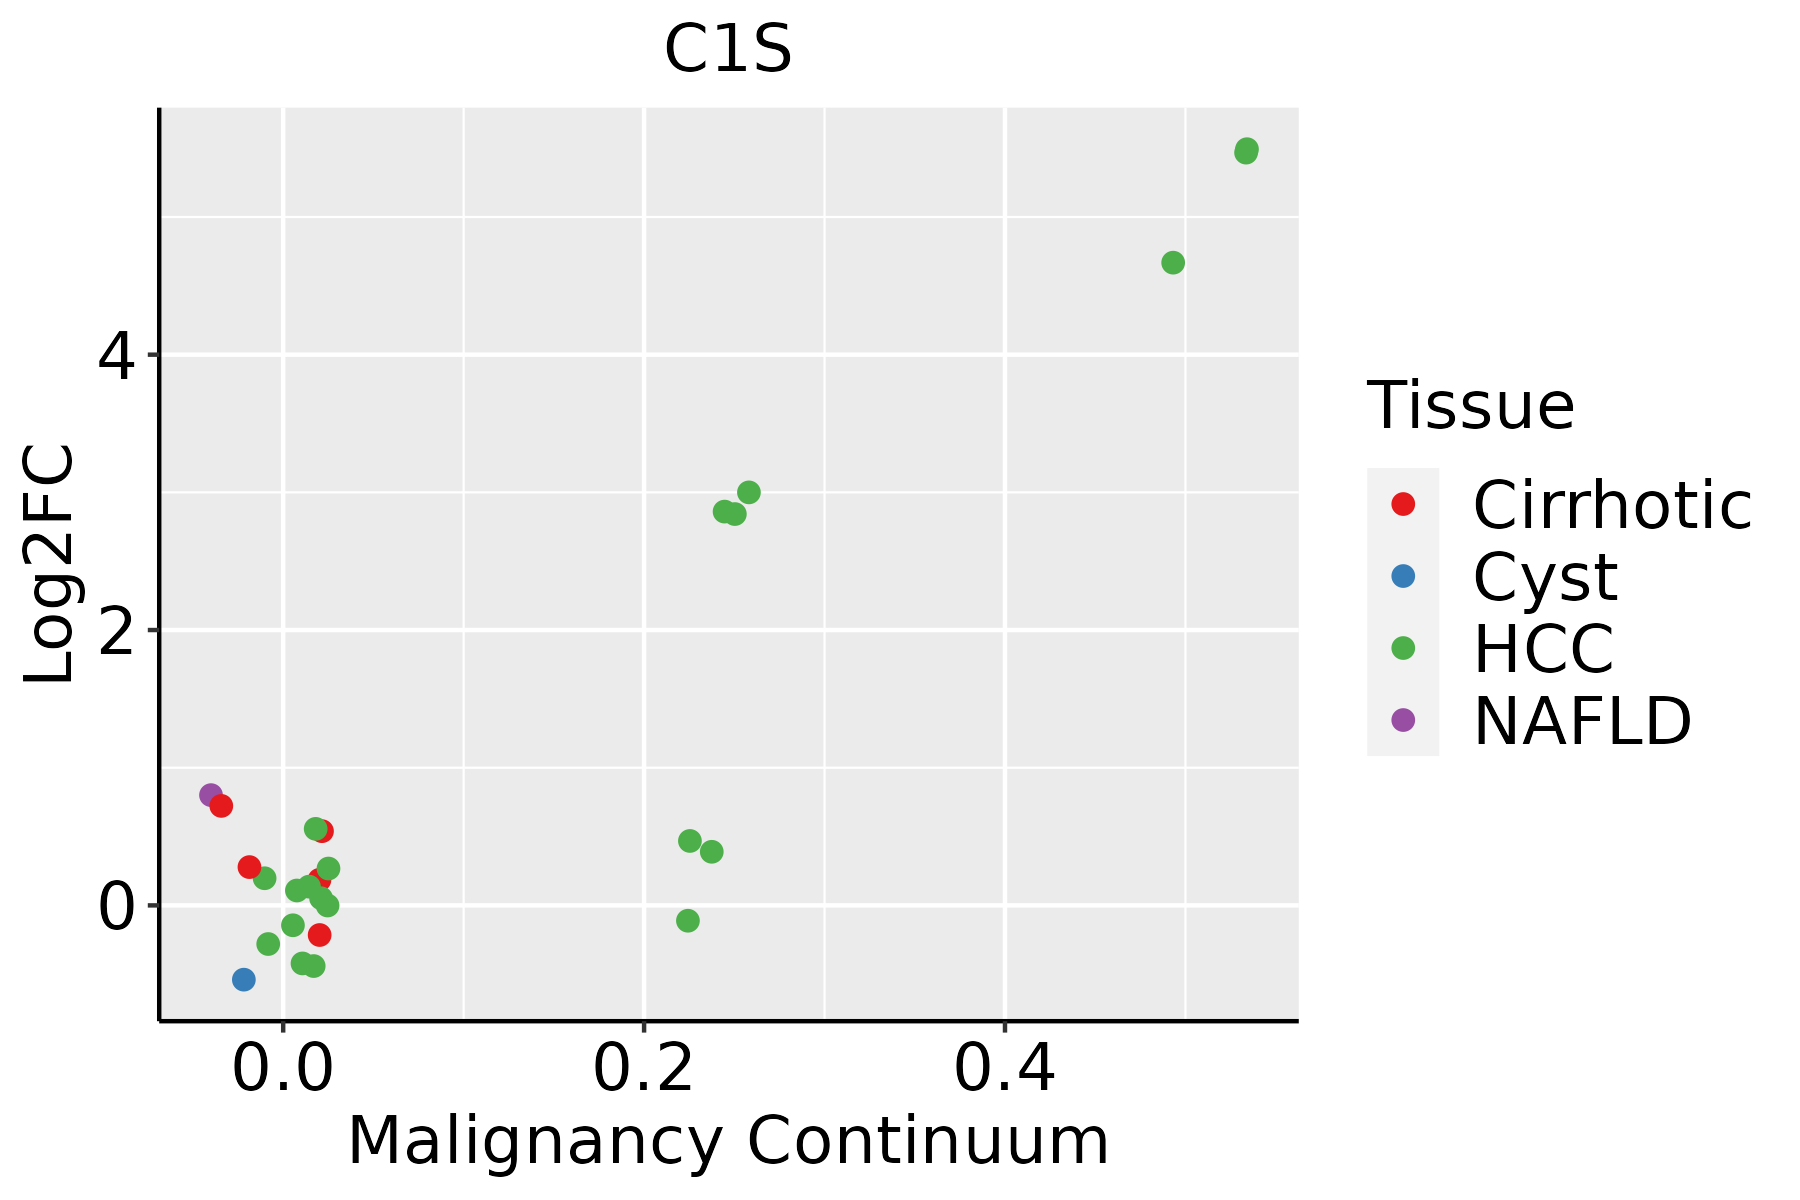 | HCC: Hepatocellular carcinoma |
| NAFLD: Non-alcoholic fatty liver disease |
| Oral Cavity |  | EOLP: Erosive Oral lichen planus |
| LP: leukoplakia |
| NEOLP: Non-erosive oral lichen planus |
| OSCC: Oral squamous cell carcinoma |
| Prostate | 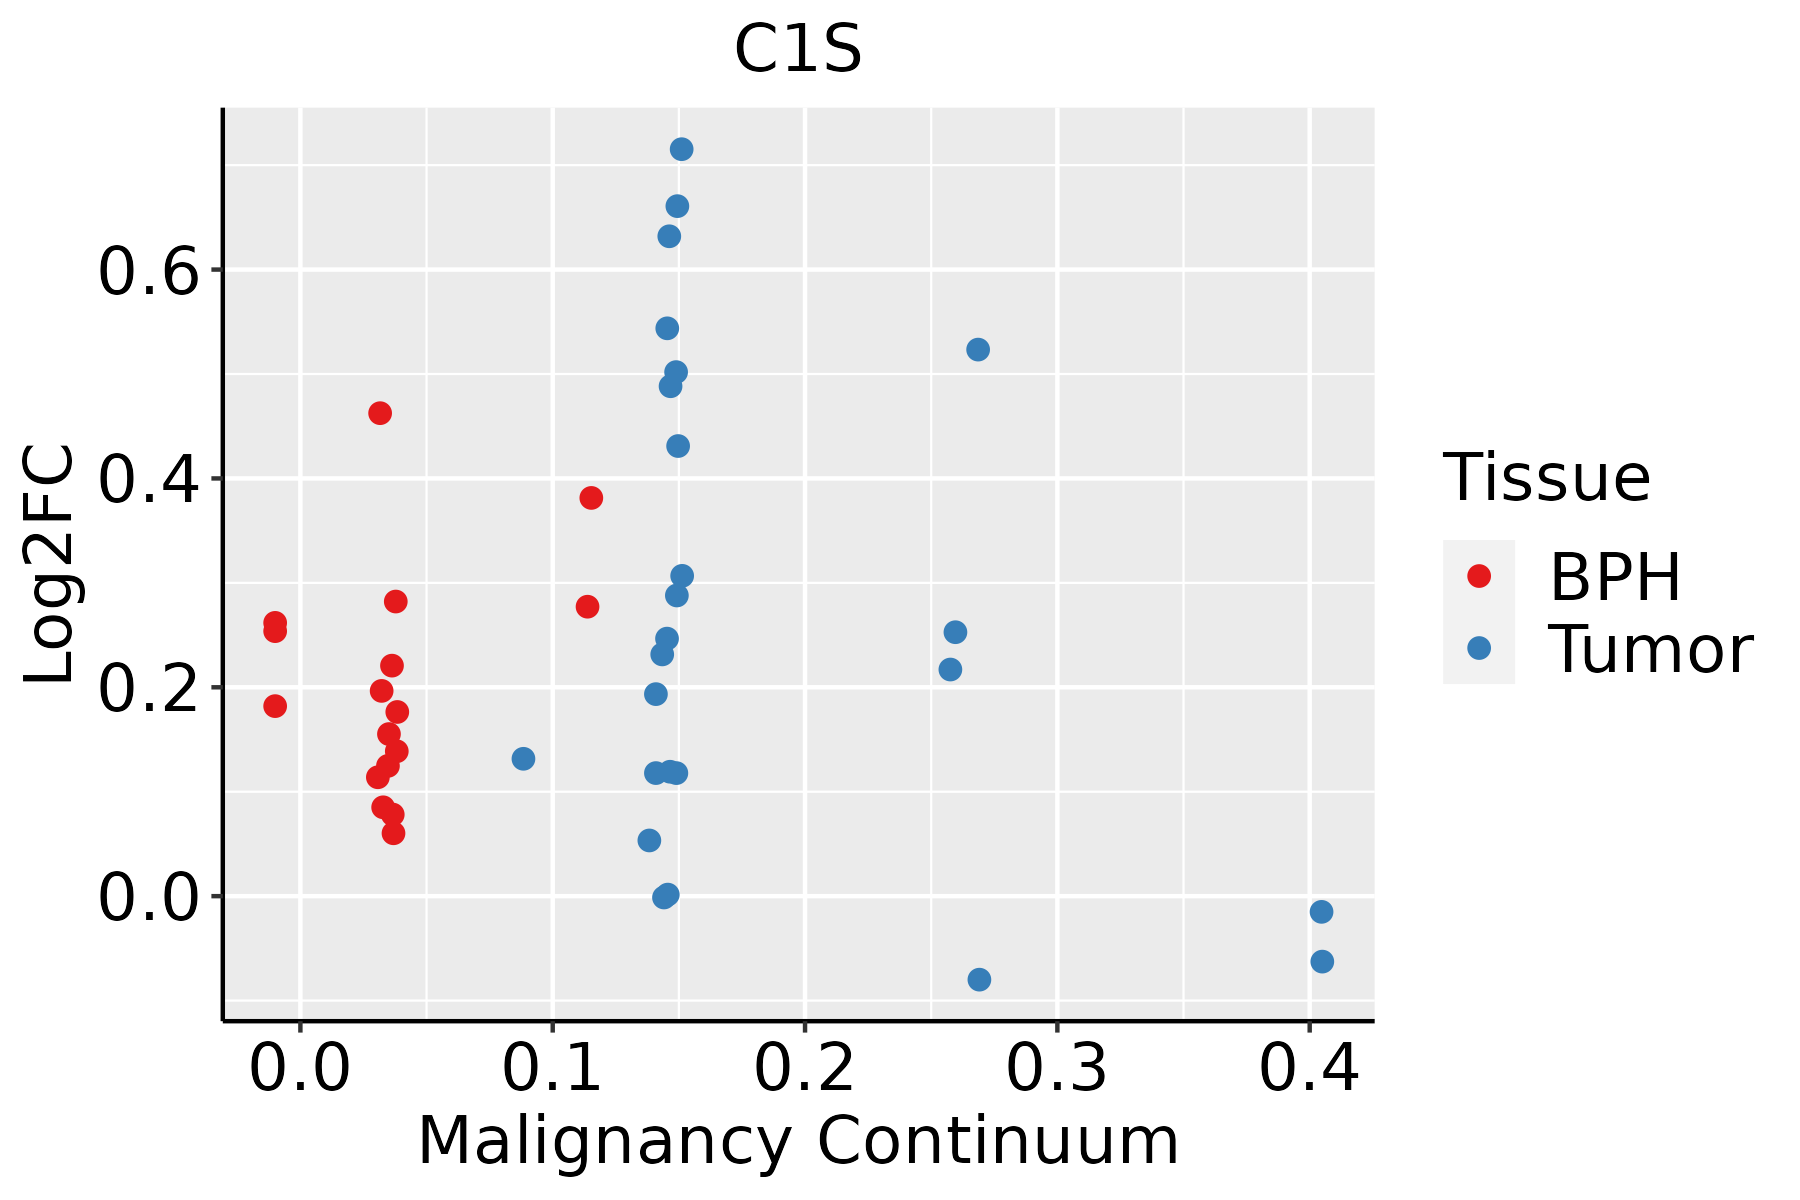 | BPH: Benign Prostatic Hyperplasia |
| Skin |  | AK: Actinic keratosis |
| cSCC: Cutaneous squamous cell carcinoma |
| SCCIS:squamous cell carcinoma in situ |
| Thyroid | 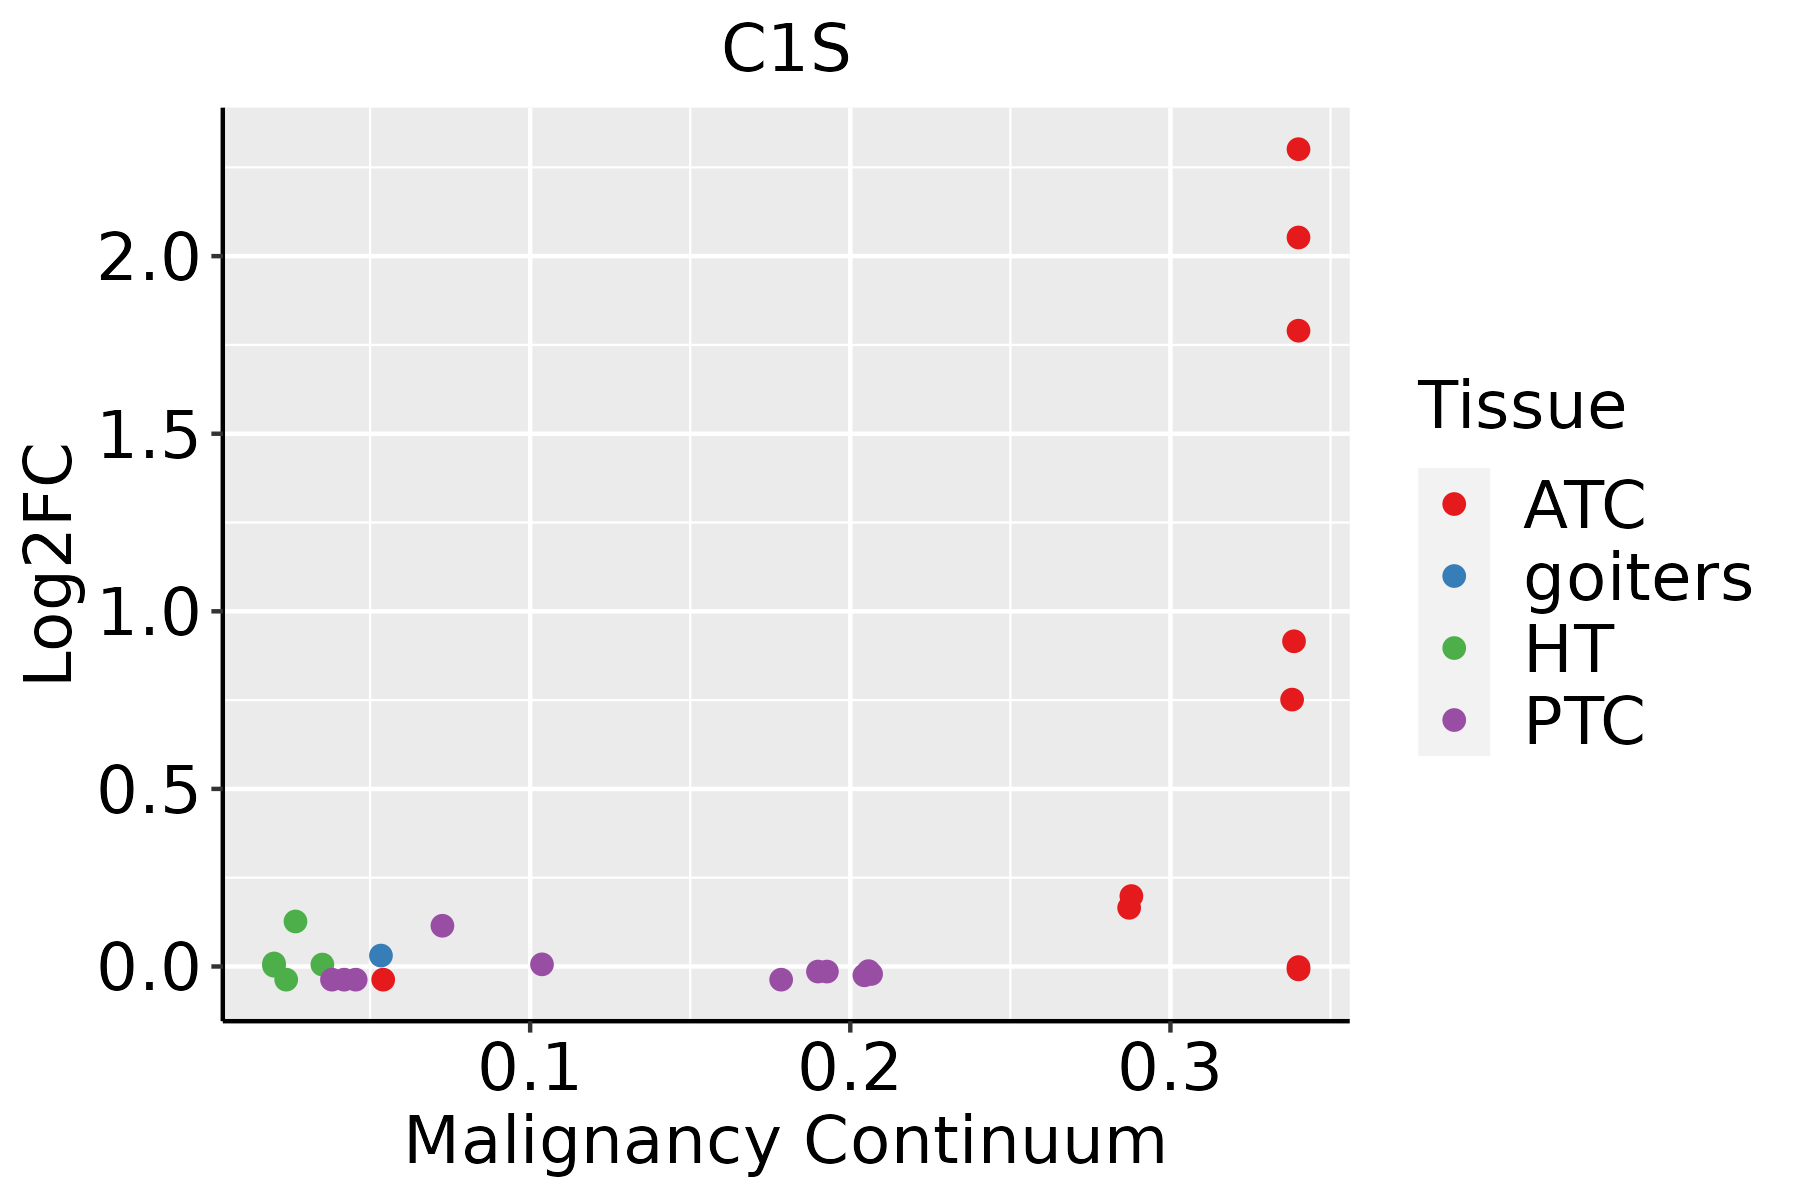 | ATC: Anaplastic thyroid cancer |
| HT: Hashimoto's thyroiditis |
| PTC: Papillary thyroid cancer |
| GO ID | Tissue | Disease Stage | Description | Gene Ratio | Bg Ratio | pvalue | p.adjust | Count |
| GO:00161979 | Oral cavity | OSCC | endosomal transport | 141/7305 | 230/18723 | 5.40e-12 | 2.06e-10 | 141 |
| GO:00183944 | Oral cavity | OSCC | peptidyl-lysine acetylation | 108/7305 | 169/18723 | 4.55e-11 | 1.45e-09 | 108 |
| GO:00064734 | Oral cavity | OSCC | protein acetylation | 124/7305 | 201/18723 | 5.59e-11 | 1.74e-09 | 124 |
| GO:00516509 | Oral cavity | OSCC | establishment of vesicle localization | 101/7305 | 161/18723 | 8.79e-10 | 2.17e-08 | 101 |
| GO:00516489 | Oral cavity | OSCC | vesicle localization | 105/7305 | 177/18723 | 3.30e-08 | 6.30e-07 | 105 |
| GO:003070510 | Oral cavity | OSCC | cytoskeleton-dependent intracellular transport | 113/7305 | 195/18723 | 6.03e-08 | 1.09e-06 | 113 |
| GO:00905598 | Oral cavity | OSCC | regulation of membrane permeability | 54/7305 | 78/18723 | 6.05e-08 | 1.09e-06 | 54 |
| GO:00469028 | Oral cavity | OSCC | regulation of mitochondrial membrane permeability | 45/7305 | 63/18723 | 1.80e-07 | 2.92e-06 | 45 |
| GO:000862516 | Oral cavity | OSCC | extrinsic apoptotic signaling pathway via death domain receptors | 53/7305 | 82/18723 | 2.30e-06 | 2.92e-05 | 53 |
| GO:00109706 | Oral cavity | OSCC | transport along microtubule | 88/7305 | 155/18723 | 5.35e-06 | 6.02e-05 | 88 |
| GO:00357947 | Oral cavity | OSCC | positive regulation of mitochondrial membrane permeability | 31/7305 | 43/18723 | 1.10e-05 | 1.14e-04 | 31 |
| GO:00723845 | Oral cavity | OSCC | organelle transport along microtubule | 53/7305 | 85/18723 | 1.10e-05 | 1.14e-04 | 53 |
| GO:003410919 | Oral cavity | OSCC | homotypic cell-cell adhesion | 55/7305 | 90/18723 | 1.78e-05 | 1.73e-04 | 55 |
| GO:00973459 | Oral cavity | OSCC | mitochondrial outer membrane permeabilization | 24/7305 | 32/18723 | 3.83e-05 | 3.37e-04 | 24 |
| GO:00224068 | Oral cavity | OSCC | membrane docking | 52/7305 | 86/18723 | 4.50e-05 | 3.84e-04 | 52 |
| GO:19026868 | Oral cavity | OSCC | mitochondrial outer membrane permeabilization involved in programmed cell death | 28/7305 | 40/18723 | 7.00e-05 | 5.60e-04 | 28 |
| GO:00080889 | Oral cavity | OSCC | axo-dendritic transport | 46/7305 | 75/18723 | 7.44e-05 | 5.81e-04 | 46 |
| GO:19057107 | Oral cavity | OSCC | positive regulation of membrane permeability | 32/7305 | 48/18723 | 9.60e-05 | 7.25e-04 | 32 |
| GO:19021107 | Oral cavity | OSCC | positive regulation of mitochondrial membrane permeability involved in apoptotic process | 26/7305 | 38/18723 | 2.29e-04 | 1.49e-03 | 26 |
| GO:00989303 | Oral cavity | OSCC | axonal transport | 39/7305 | 64/18723 | 3.12e-04 | 1.94e-03 | 39 |
| Pathway ID | Tissue | Disease Stage | Description | Gene Ratio | Bg Ratio | pvalue | p.adjust | qvalue | Count |
| hsa0517126 | Endometrium | AEH | Coronavirus disease - COVID-19 | 99/1197 | 232/8465 | 5.19e-27 | 3.37e-25 | 2.47e-25 | 99 |
| hsa05171112 | Endometrium | AEH | Coronavirus disease - COVID-19 | 99/1197 | 232/8465 | 5.19e-27 | 3.37e-25 | 2.47e-25 | 99 |
| hsa0517127 | Endometrium | EEC | Coronavirus disease - COVID-19 | 99/1237 | 232/8465 | 7.43e-26 | 4.89e-24 | 3.65e-24 | 99 |
| hsa0517136 | Endometrium | EEC | Coronavirus disease - COVID-19 | 99/1237 | 232/8465 | 7.43e-26 | 4.89e-24 | 3.65e-24 | 99 |
| hsa05171211 | Esophagus | ESCC | Coronavirus disease - COVID-19 | 156/4205 | 232/8465 | 3.18e-08 | 2.68e-07 | 1.37e-07 | 156 |
| hsa051339 | Esophagus | ESCC | Pertussis | 48/4205 | 76/8465 | 1.21e-02 | 2.77e-02 | 1.42e-02 | 48 |
| hsa05171310 | Esophagus | ESCC | Coronavirus disease - COVID-19 | 156/4205 | 232/8465 | 3.18e-08 | 2.68e-07 | 1.37e-07 | 156 |
| hsa0513314 | Esophagus | ESCC | Pertussis | 48/4205 | 76/8465 | 1.21e-02 | 2.77e-02 | 1.42e-02 | 48 |
| hsa0517114 | Liver | NAFLD | Coronavirus disease - COVID-19 | 111/1043 | 232/8465 | 1.01e-41 | 3.32e-39 | 2.67e-39 | 111 |
| hsa04610 | Liver | NAFLD | Complement and coagulation cascades | 35/1043 | 86/8465 | 2.48e-11 | 2.04e-09 | 1.64e-09 | 35 |
| hsa0517115 | Liver | NAFLD | Coronavirus disease - COVID-19 | 111/1043 | 232/8465 | 1.01e-41 | 3.32e-39 | 2.67e-39 | 111 |
| hsa046101 | Liver | NAFLD | Complement and coagulation cascades | 35/1043 | 86/8465 | 2.48e-11 | 2.04e-09 | 1.64e-09 | 35 |
| hsa046102 | Liver | Cirrhotic | Complement and coagulation cascades | 48/2530 | 86/8465 | 4.41e-07 | 5.44e-06 | 3.35e-06 | 48 |
| hsa046103 | Liver | Cirrhotic | Complement and coagulation cascades | 48/2530 | 86/8465 | 4.41e-07 | 5.44e-06 | 3.35e-06 | 48 |
| hsa0517142 | Liver | HCC | Coronavirus disease - COVID-19 | 167/4020 | 232/8465 | 1.50e-14 | 4.19e-13 | 2.33e-13 | 167 |
| hsa046104 | Liver | HCC | Complement and coagulation cascades | 57/4020 | 86/8465 | 3.19e-04 | 1.45e-03 | 8.04e-04 | 57 |
| hsa051332 | Liver | HCC | Pertussis | 48/4020 | 76/8465 | 4.17e-03 | 1.27e-02 | 7.06e-03 | 48 |
| hsa0517152 | Liver | HCC | Coronavirus disease - COVID-19 | 167/4020 | 232/8465 | 1.50e-14 | 4.19e-13 | 2.33e-13 | 167 |
| hsa046105 | Liver | HCC | Complement and coagulation cascades | 57/4020 | 86/8465 | 3.19e-04 | 1.45e-03 | 8.04e-04 | 57 |
| hsa051333 | Liver | HCC | Pertussis | 48/4020 | 76/8465 | 4.17e-03 | 1.27e-02 | 7.06e-03 | 48 |
| Hugo Symbol | Variant Class | Variant Classification | dbSNP RS | HGVSc | HGVSp | HGVSp Short | SWISSPROT | BIOTYPE | SIFT | PolyPhen | Tumor Sample Barcode | Tissue | Histology | Sex | Age | Stage | Therapy Types | Drugs | Outcome |
| C1S | SNV | Missense_Mutation | | c.1204C>G | p.His402Asp | p.H402D | P09871 | protein_coding | tolerated(0.09) | benign(0.007) | TCGA-B6-A0RT-01 | Breast | breast invasive carcinoma | Female | <65 | III/IV | Unknown | Unknown | SD |
| C1S | insertion | In_Frame_Ins | novel | c.387_388insCGCCGCACCACCAAAGAAGGTGCTTGTGTTTGTCAGACAAAT | p.Ala129_Thr130insArgArgThrThrLysGluGlyAlaCysValCysGlnThrAsn | p.A129_T130insRRTTKEGACVCQTN | P09871 | protein_coding | | | TCGA-A2-A0CP-01 | Breast | breast invasive carcinoma | Female | <65 | I/II | Chemotherapy | cytoxan | SD |
| C1S | deletion | Frame_Shift_Del | novel | c.153delN | p.Leu52SerfsTer21 | p.L52Sfs*21 | P09871 | protein_coding | | | TCGA-EW-A2FV-01 | Breast | breast invasive carcinoma | Female | <65 | III/IV | Chemotherapy | docetaxel | SD |
| C1S | SNV | Missense_Mutation | novel | c.1810N>G | p.Thr604Ala | p.T604A | P09871 | protein_coding | tolerated(0.61) | benign(0.003) | TCGA-2W-A8YY-01 | Cervix | cervical & endocervical cancer | Female | <65 | I/II | Chemotherapy | cisplatin | CR |
| C1S | SNV | Missense_Mutation | novel | c.1710N>T | p.Trp570Cys | p.W570C | P09871 | protein_coding | deleterious(0) | probably_damaging(1) | TCGA-BI-A0VS-01 | Cervix | cervical & endocervical cancer | Female | <65 | I/II | Unknown | Unknown | SD |
| C1S | SNV | Missense_Mutation | rs782226018 | c.362C>T | p.Thr121Met | p.T121M | P09871 | protein_coding | deleterious(0) | probably_damaging(0.996) | TCGA-C5-A1MJ-01 | Cervix | cervical & endocervical cancer | Female | <65 | I/II | Unknown | Unknown | SD |
| C1S | SNV | Missense_Mutation | | c.527G>T | p.Ser176Ile | p.S176I | P09871 | protein_coding | deleterious(0) | probably_damaging(0.971) | TCGA-A6-2679-01 | Colorectum | colon adenocarcinoma | Female | >=65 | I/II | Unknown | Unknown | SD |
| C1S | SNV | Missense_Mutation | rs781887755 | c.1447C>T | p.Pro483Ser | p.P483S | P09871 | protein_coding | tolerated(0.15) | benign(0.18) | TCGA-AZ-6598-01 | Colorectum | colon adenocarcinoma | Female | >=65 | I/II | Unknown | Unknown | SD |
| C1S | SNV | Missense_Mutation | novel | c.80N>C | p.Asn27Thr | p.N27T | P09871 | protein_coding | deleterious(0.01) | possibly_damaging(0.816) | TCGA-CA-6717-01 | Colorectum | colon adenocarcinoma | Male | <65 | I/II | Chemotherapy | oxaliplatin | CR |
| C1S | SNV | Missense_Mutation | rs781845594 | c.1327N>A | p.Asp443Asn | p.D443N | P09871 | protein_coding | tolerated(0.55) | benign(0.025) | TCGA-DM-A1D0-01 | Colorectum | colon adenocarcinoma | Female | >=65 | I/II | Unknown | Unknown | SD |
| Entrez ID | Symbol | Category | Interaction Types | Drug Claim Name | Drug Name | PMIDs |
| 716 | C1S | ENZYME, PROTEASE, DRUGGABLE GENOME | | TNT009 | | |
| 716 | C1S | ENZYME, PROTEASE, DRUGGABLE GENOME | inhibitor | 252166820 | | |
| 716 | C1S | ENZYME, PROTEASE, DRUGGABLE GENOME | | Cinryze | CINRYZE | |
| 716 | C1S | ENZYME, PROTEASE, DRUGGABLE GENOME | | TS01 | | |
| 716 | C1S | ENZYME, PROTEASE, DRUGGABLE GENOME | | ANX005 | | |
| 716 | C1S | ENZYME, PROTEASE, DRUGGABLE GENOME | antibody | 354702279 | SUTIMLIMAB | |
| 716 | C1S | ENZYME, PROTEASE, DRUGGABLE GENOME | | SHP616 | | |
| 716 | C1S | ENZYME, PROTEASE, DRUGGABLE GENOME | | MBL | | 10878362 |
| 716 | C1S | ENZYME, PROTEASE, DRUGGABLE GENOME | | ANTITHROMBIN | | |


