
|
|||||
|
 | |
| |
| |
| |
| |
| |
|
Gene: AKAP8 |
Gene summary for AKAP8 |
| Gene information | Species | Human | Gene symbol | AKAP8 | Gene ID | 10270 |
| Gene name | A-kinase anchoring protein 8 | |
| Gene Alias | AKAP 95 | |
| Cytomap | 19p13.12 | |
| Gene Type | protein-coding | GO ID | GO:0000070 | UniProtAcc | O43823 |
Top |
Malignant transformation analysis |
| Identification of the aberrant gene expression in precancerous and cancerous lesions by comparing the gene expression of stem-like cells in diseased tissues with normal stem cells |
| Entrez ID | Symbol | Replicates | Species | Organ | Tissue | Adj P-value | Log2FC | Malignancy |
| 10270 | AKAP8 | LZE4T | Human | Esophagus | ESCC | 7.61e-03 | 7.80e-02 | 0.0811 |
| 10270 | AKAP8 | LZE7T | Human | Esophagus | ESCC | 1.43e-05 | 2.56e-01 | 0.0667 |
| 10270 | AKAP8 | LZE22T | Human | Esophagus | ESCC | 3.07e-03 | 2.14e-01 | 0.068 |
| 10270 | AKAP8 | LZE24T | Human | Esophagus | ESCC | 1.21e-08 | 2.23e-01 | 0.0596 |
| 10270 | AKAP8 | LZE21T | Human | Esophagus | ESCC | 1.52e-03 | 1.36e-01 | 0.0655 |
| 10270 | AKAP8 | P1T-E | Human | Esophagus | ESCC | 1.34e-06 | 4.00e-01 | 0.0875 |
| 10270 | AKAP8 | P2T-E | Human | Esophagus | ESCC | 2.17e-11 | 2.47e-01 | 0.1177 |
| 10270 | AKAP8 | P4T-E | Human | Esophagus | ESCC | 2.51e-19 | 3.59e-01 | 0.1323 |
| 10270 | AKAP8 | P5T-E | Human | Esophagus | ESCC | 4.74e-16 | 2.11e-01 | 0.1327 |
| 10270 | AKAP8 | P8T-E | Human | Esophagus | ESCC | 1.70e-15 | 3.06e-01 | 0.0889 |
| 10270 | AKAP8 | P9T-E | Human | Esophagus | ESCC | 7.68e-11 | 2.32e-01 | 0.1131 |
| 10270 | AKAP8 | P10T-E | Human | Esophagus | ESCC | 1.59e-13 | 2.72e-01 | 0.116 |
| 10270 | AKAP8 | P11T-E | Human | Esophagus | ESCC | 3.59e-11 | 3.96e-01 | 0.1426 |
| 10270 | AKAP8 | P12T-E | Human | Esophagus | ESCC | 1.85e-17 | 3.48e-01 | 0.1122 |
| 10270 | AKAP8 | P15T-E | Human | Esophagus | ESCC | 7.15e-13 | 2.96e-01 | 0.1149 |
| 10270 | AKAP8 | P16T-E | Human | Esophagus | ESCC | 1.18e-07 | 1.58e-01 | 0.1153 |
| 10270 | AKAP8 | P19T-E | Human | Esophagus | ESCC | 1.77e-08 | 3.11e-01 | 0.1662 |
| 10270 | AKAP8 | P20T-E | Human | Esophagus | ESCC | 1.13e-16 | 3.53e-01 | 0.1124 |
| 10270 | AKAP8 | P21T-E | Human | Esophagus | ESCC | 3.72e-16 | 3.57e-01 | 0.1617 |
| 10270 | AKAP8 | P22T-E | Human | Esophagus | ESCC | 2.71e-11 | 9.93e-02 | 0.1236 |
| Page: 1 2 3 4 5 |
| Tissue | Expression Dynamics | Abbreviation |
| Esophagus | 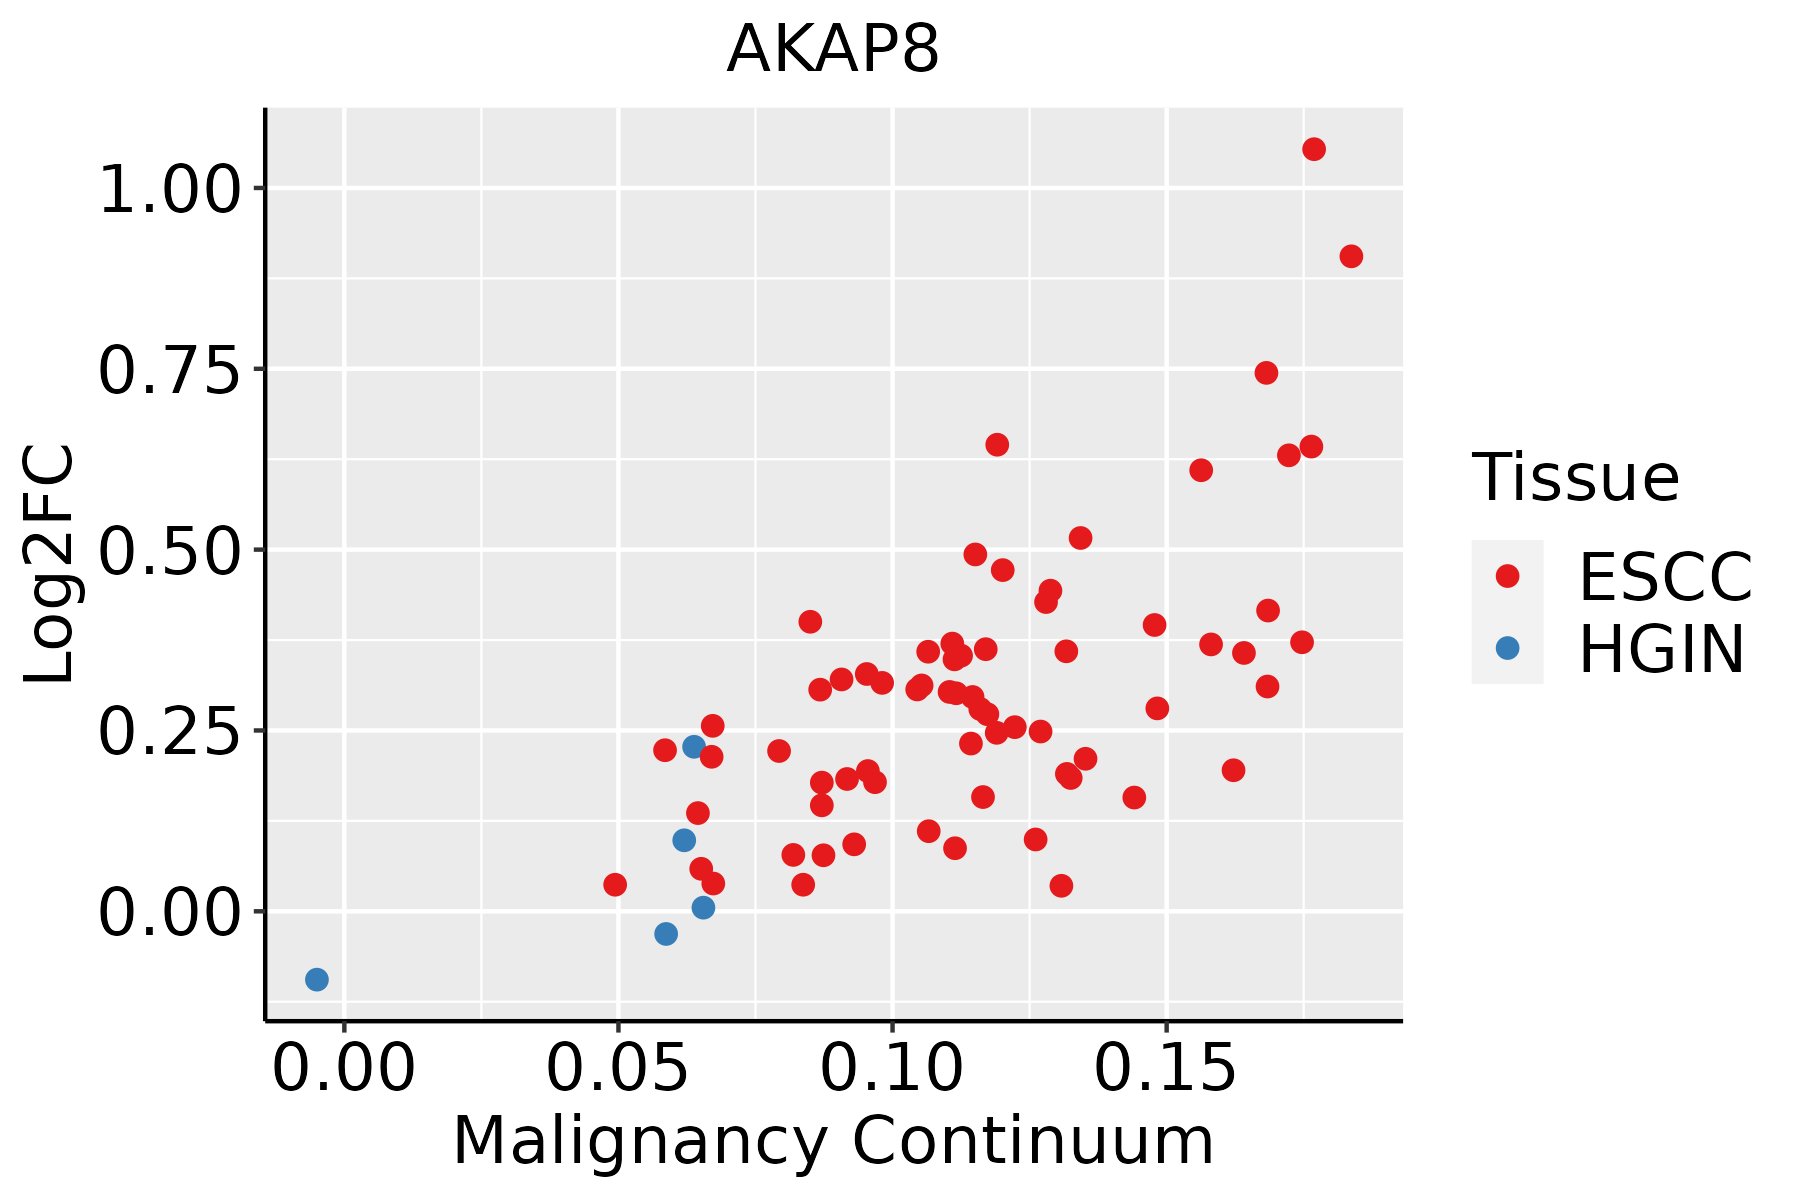 | ESCC: Esophageal squamous cell carcinoma |
| HGIN: High-grade intraepithelial neoplasias | ||
| LGIN: Low-grade intraepithelial neoplasias | ||
| Oral Cavity |  | EOLP: Erosive Oral lichen planus |
| LP: leukoplakia | ||
| NEOLP: Non-erosive oral lichen planus | ||
| OSCC: Oral squamous cell carcinoma | ||
| Skin |  | AK: Actinic keratosis |
| cSCC: Cutaneous squamous cell carcinoma | ||
| SCCIS:squamous cell carcinoma in situ |
| ∗log2FC in expression of this searched gene in stem-like cells from each diseased tissue sample relative to stem-like cells in normal samples in each tissue plotted against the malignancy continuum. Samples are colored based on if they are from different disease stage. |
Top |
Malignant transformation related pathway analysis |
| Find out the enriched GO biological processes and KEGG pathways involved in transition from healthy to precancer to cancer |
| Tissue | Disease Stage | Enriched GO biological Processes |
| Colorectum | AD |  |
| Colorectum | SER |  |
| Colorectum | MSS |  |
| Colorectum | MSI-H |  |
| Colorectum | FAP |  |
| ∗Top 15 enriched GO BP terms are showed in the bar plot of each disease state in each tissue. Each row represents a significant GO biological process which is colored according to the -log10(p.adjust). |
| Page: 1 2 3 4 5 6 7 8 9 |
| GO ID | Tissue | Disease Stage | Description | Gene Ratio | Bg Ratio | pvalue | p.adjust | Count |
| GO:000640323 | Oral cavity | EOLP | RNA localization | 57/2218 | 201/18723 | 1.62e-10 | 1.68e-08 | 57 |
| GO:005116824 | Oral cavity | EOLP | nuclear export | 47/2218 | 154/18723 | 4.45e-10 | 3.76e-08 | 47 |
| GO:004682222 | Oral cavity | EOLP | regulation of nucleocytoplasmic transport | 37/2218 | 106/18723 | 4.85e-10 | 4.04e-08 | 37 |
| GO:001593121 | Oral cavity | EOLP | nucleobase-containing compound transport | 58/2218 | 222/18723 | 3.44e-09 | 2.10e-07 | 58 |
| GO:005065721 | Oral cavity | EOLP | nucleic acid transport | 47/2218 | 163/18723 | 3.53e-09 | 2.12e-07 | 47 |
| GO:005065821 | Oral cavity | EOLP | RNA transport | 47/2218 | 163/18723 | 3.53e-09 | 2.12e-07 | 47 |
| GO:001657023 | Oral cavity | EOLP | histone modification | 98/2218 | 463/18723 | 5.58e-09 | 2.96e-07 | 98 |
| GO:005123622 | Oral cavity | EOLP | establishment of RNA localization | 47/2218 | 166/18723 | 6.73e-09 | 3.48e-07 | 47 |
| GO:002241121 | Oral cavity | EOLP | cellular component disassembly | 94/2218 | 443/18723 | 1.00e-08 | 4.89e-07 | 94 |
| GO:005102821 | Oral cavity | EOLP | mRNA transport | 38/2218 | 130/18723 | 7.28e-08 | 2.61e-06 | 38 |
| GO:00510811 | Oral cavity | EOLP | nuclear envelope disassembly | 8/2218 | 11/18723 | 4.54e-06 | 9.41e-05 | 8 |
| GO:003105622 | Oral cavity | EOLP | regulation of histone modification | 38/2218 | 152/18723 | 5.18e-06 | 1.05e-04 | 38 |
| GO:00303971 | Oral cavity | EOLP | membrane disassembly | 8/2218 | 12/18723 | 1.22e-05 | 2.09e-04 | 8 |
| GO:004683121 | Oral cavity | EOLP | regulation of RNA export from nucleus | 8/2218 | 12/18723 | 1.22e-05 | 2.09e-04 | 8 |
| GO:000640521 | Oral cavity | EOLP | RNA export from nucleus | 24/2218 | 84/18723 | 2.70e-05 | 3.95e-04 | 24 |
| GO:00322391 | Oral cavity | EOLP | regulation of nucleobase-containing compound transport | 8/2218 | 15/18723 | 1.14e-04 | 1.27e-03 | 8 |
| GO:007142621 | Oral cavity | EOLP | ribonucleoprotein complex export from nucleus | 21/2218 | 76/18723 | 1.42e-04 | 1.53e-03 | 21 |
| GO:007116621 | Oral cavity | EOLP | ribonucleoprotein complex localization | 21/2218 | 77/18723 | 1.74e-04 | 1.80e-03 | 21 |
| GO:000640621 | Oral cavity | EOLP | mRNA export from nucleus | 17/2218 | 59/18723 | 3.48e-04 | 3.20e-03 | 17 |
| GO:007142721 | Oral cavity | EOLP | mRNA-containing ribonucleoprotein complex export from nucleus | 17/2218 | 59/18723 | 3.48e-04 | 3.20e-03 | 17 |
| Page: 1 2 3 4 5 6 7 8 9 10 11 12 13 14 15 16 17 18 19 20 |
| Pathway ID | Tissue | Disease Stage | Description | Gene Ratio | Bg Ratio | pvalue | p.adjust | qvalue | Count |
| Page: 1 |
Top |
Cell-cell communication analysis |
| Identification of potential cell-cell interactions between two cell types and their ligand-receptor pairs for different disease states |
| Ligand | Receptor | LRpair | Pathway | Tissue | Disease Stage |
| Page: 1 |
Top |
Single-cell gene regulatory network inference analysis |
| Find out the significant the regulons (TFs) and the target genes of each regulon across cell types for different disease states |
| TF | Cell Type | Tissue | Disease Stage | Target Gene | RSS | Regulon Activity |
| ∗The dot plots of a searched regulon are shown for all cell subpopulations in each disease state of each tissue based on the regulon specific score inferred using pySCENIC and by calculating the average expression. |
| Page: 1 |
Top |
Somatic mutation of malignant transformation related genes |
| Annotation of somatic variants for genes involved in malignant transformation |
| Hugo Symbol | Variant Class | Variant Classification | dbSNP RS | HGVSc | HGVSp | HGVSp Short | SWISSPROT | BIOTYPE | SIFT | PolyPhen | Tumor Sample Barcode | Tissue | Histology | Sex | Age | Stage | Therapy Types | Drugs | Outcome |
| AKAP8 | SNV | Missense_Mutation | rs764482753 | c.1192N>T | p.Arg398Cys | p.R398C | O43823 | protein_coding | deleterious(0) | probably_damaging(0.98) | TCGA-A8-A09Z-01 | Breast | breast invasive carcinoma | Female | >=65 | I/II | Unknown | Unknown | SD |
| AKAP8 | SNV | Missense_Mutation | novel | c.1489C>T | p.Arg497Trp | p.R497W | O43823 | protein_coding | deleterious(0) | probably_damaging(0.995) | TCGA-AC-A2BK-01 | Breast | breast invasive carcinoma | Female | >=65 | III/IV | Chemotherapy | cytoxan | CR |
| AKAP8 | SNV | Missense_Mutation | rs767177827 | c.1268C>G | p.Thr423Ser | p.T423S | O43823 | protein_coding | deleterious(0.01) | probably_damaging(0.998) | TCGA-AN-A04D-01 | Breast | breast invasive carcinoma | Female | <65 | I/II | Unknown | Unknown | SD |
| AKAP8 | SNV | Missense_Mutation | c.1600A>C | p.Lys534Gln | p.K534Q | O43823 | protein_coding | deleterious(0.02) | probably_damaging(0.939) | TCGA-E2-A1L7-01 | Breast | breast invasive carcinoma | Female | <65 | III/IV | Chemotherapy | cyclophosphamide | PD | |
| AKAP8 | SNV | Missense_Mutation | novel | c.1997N>C | p.Arg666Thr | p.R666T | O43823 | protein_coding | tolerated_low_confidence(0.6) | benign(0.005) | TCGA-DR-A0ZM-01 | Cervix | cervical & endocervical cancer | Female | <65 | III/IV | Unspecific | Cisplatin | SD |
| AKAP8 | SNV | Missense_Mutation | c.1581N>C | p.Leu527Phe | p.L527F | O43823 | protein_coding | deleterious(0) | probably_damaging(0.964) | TCGA-EK-A2RA-01 | Cervix | cervical & endocervical cancer | Female | >=65 | I/II | Unknown | Unknown | SD | |
| AKAP8 | SNV | Missense_Mutation | c.374C>T | p.Ser125Phe | p.S125F | O43823 | protein_coding | deleterious(0.05) | benign(0.072) | TCGA-EK-A3GN-01 | Cervix | cervical & endocervical cancer | Female | <65 | III/IV | Unknown | Unknown | SD | |
| AKAP8 | SNV | Missense_Mutation | novel | c.1015T>G | p.Ser339Ala | p.S339A | O43823 | protein_coding | tolerated(0.09) | possibly_damaging(0.565) | TCGA-5M-AAT6-01 | Colorectum | colon adenocarcinoma | Female | <65 | III/IV | Unknown | Unknown | PD |
| AKAP8 | SNV | Missense_Mutation | c.712N>T | p.Pro238Ser | p.P238S | O43823 | protein_coding | tolerated(0.08) | benign(0.062) | TCGA-AA-3492-01 | Colorectum | colon adenocarcinoma | Female | >=65 | I/II | Unknown | Unknown | SD | |
| AKAP8 | SNV | Missense_Mutation | c.2006N>T | p.Pro669Leu | p.P669L | O43823 | protein_coding | tolerated_low_confidence(0.3) | benign(0) | TCGA-AA-3710-01 | Colorectum | colon adenocarcinoma | Female | >=65 | I/II | Unknown | Unknown | SD |
| Page: 1 2 3 4 5 6 |
Top |
Related drugs of malignant transformation related genes |
| Identification of chemicals and drugs interact with genes involved in malignant transfromation |
| (DGIdb 4.0) |
| Entrez ID | Symbol | Category | Interaction Types | Drug Claim Name | Drug Name | PMIDs |
| Page: 1 |

Copyright 2023-Present -The University of Texas Health Science Center at Houston |