
|
|||||
|
 | |
| |
| |
| |
| |
| |
|
Gene: AHI1 |
Gene summary for AHI1 |
| Gene information | Species | Human | Gene symbol | AHI1 | Gene ID | 54806 |
| Gene name | Abelson helper integration site 1 | |
| Gene Alias | AHI-1 | |
| Cytomap | 6q23.3 | |
| Gene Type | protein-coding | GO ID | GO:0001654 | UniProtAcc | Q8N157 |
Top |
Malignant transformation analysis |
| Identification of the aberrant gene expression in precancerous and cancerous lesions by comparing the gene expression of stem-like cells in diseased tissues with normal stem cells |
| Entrez ID | Symbol | Replicates | Species | Organ | Tissue | Adj P-value | Log2FC | Malignancy |
| 54806 | AHI1 | HTA11_3410_2000001011 | Human | Colorectum | AD | 3.65e-23 | -7.48e-01 | 0.0155 |
| 54806 | AHI1 | HTA11_2487_2000001011 | Human | Colorectum | SER | 1.66e-12 | -6.85e-01 | -0.1808 |
| 54806 | AHI1 | HTA11_2951_2000001011 | Human | Colorectum | AD | 1.89e-03 | -8.20e-01 | 0.0216 |
| 54806 | AHI1 | HTA11_1938_2000001011 | Human | Colorectum | AD | 4.35e-02 | -4.44e-01 | -0.0811 |
| 54806 | AHI1 | HTA11_3361_2000001011 | Human | Colorectum | AD | 1.40e-09 | -7.60e-01 | -0.1207 |
| 54806 | AHI1 | HTA11_83_2000001011 | Human | Colorectum | SER | 1.36e-03 | -5.68e-01 | -0.1526 |
| 54806 | AHI1 | HTA11_696_2000001011 | Human | Colorectum | AD | 1.33e-13 | -4.78e-01 | -0.1464 |
| 54806 | AHI1 | HTA11_866_2000001011 | Human | Colorectum | AD | 1.62e-15 | -4.86e-01 | -0.1001 |
| 54806 | AHI1 | HTA11_5212_2000001011 | Human | Colorectum | AD | 1.21e-03 | -6.93e-01 | -0.2061 |
| 54806 | AHI1 | HTA11_7862_2000001011 | Human | Colorectum | AD | 1.96e-03 | -5.80e-01 | -0.0179 |
| 54806 | AHI1 | HTA11_866_3004761011 | Human | Colorectum | AD | 1.58e-13 | -6.06e-01 | 0.096 |
| 54806 | AHI1 | HTA11_8622_2000001021 | Human | Colorectum | SER | 2.87e-02 | -5.86e-01 | 0.0528 |
| 54806 | AHI1 | HTA11_10711_2000001011 | Human | Colorectum | AD | 4.33e-09 | -6.67e-01 | 0.0338 |
| 54806 | AHI1 | HTA11_7696_3000711011 | Human | Colorectum | AD | 3.57e-10 | -3.80e-01 | 0.0674 |
| 54806 | AHI1 | HTA11_6818_2000001011 | Human | Colorectum | AD | 1.21e-02 | -6.08e-01 | 0.0112 |
| 54806 | AHI1 | HTA11_6818_2000001021 | Human | Colorectum | AD | 1.29e-03 | -5.33e-01 | 0.0588 |
| 54806 | AHI1 | HTA11_99999970781_79442 | Human | Colorectum | MSS | 4.10e-14 | -4.14e-01 | 0.294 |
| 54806 | AHI1 | HTA11_99999971662_82457 | Human | Colorectum | MSS | 3.04e-04 | -3.10e-01 | 0.3859 |
| 54806 | AHI1 | HTA11_99999973899_84307 | Human | Colorectum | MSS | 1.57e-04 | -6.30e-01 | 0.2585 |
| 54806 | AHI1 | HTA11_99999974143_84620 | Human | Colorectum | MSS | 3.86e-22 | -6.01e-01 | 0.3005 |
| Page: 1 2 3 4 5 6 7 8 9 10 |
| Tissue | Expression Dynamics | Abbreviation |
| Colorectum (GSE201348) |  | FAP: Familial adenomatous polyposis |
| CRC: Colorectal cancer | ||
| Colorectum (HTA11) | 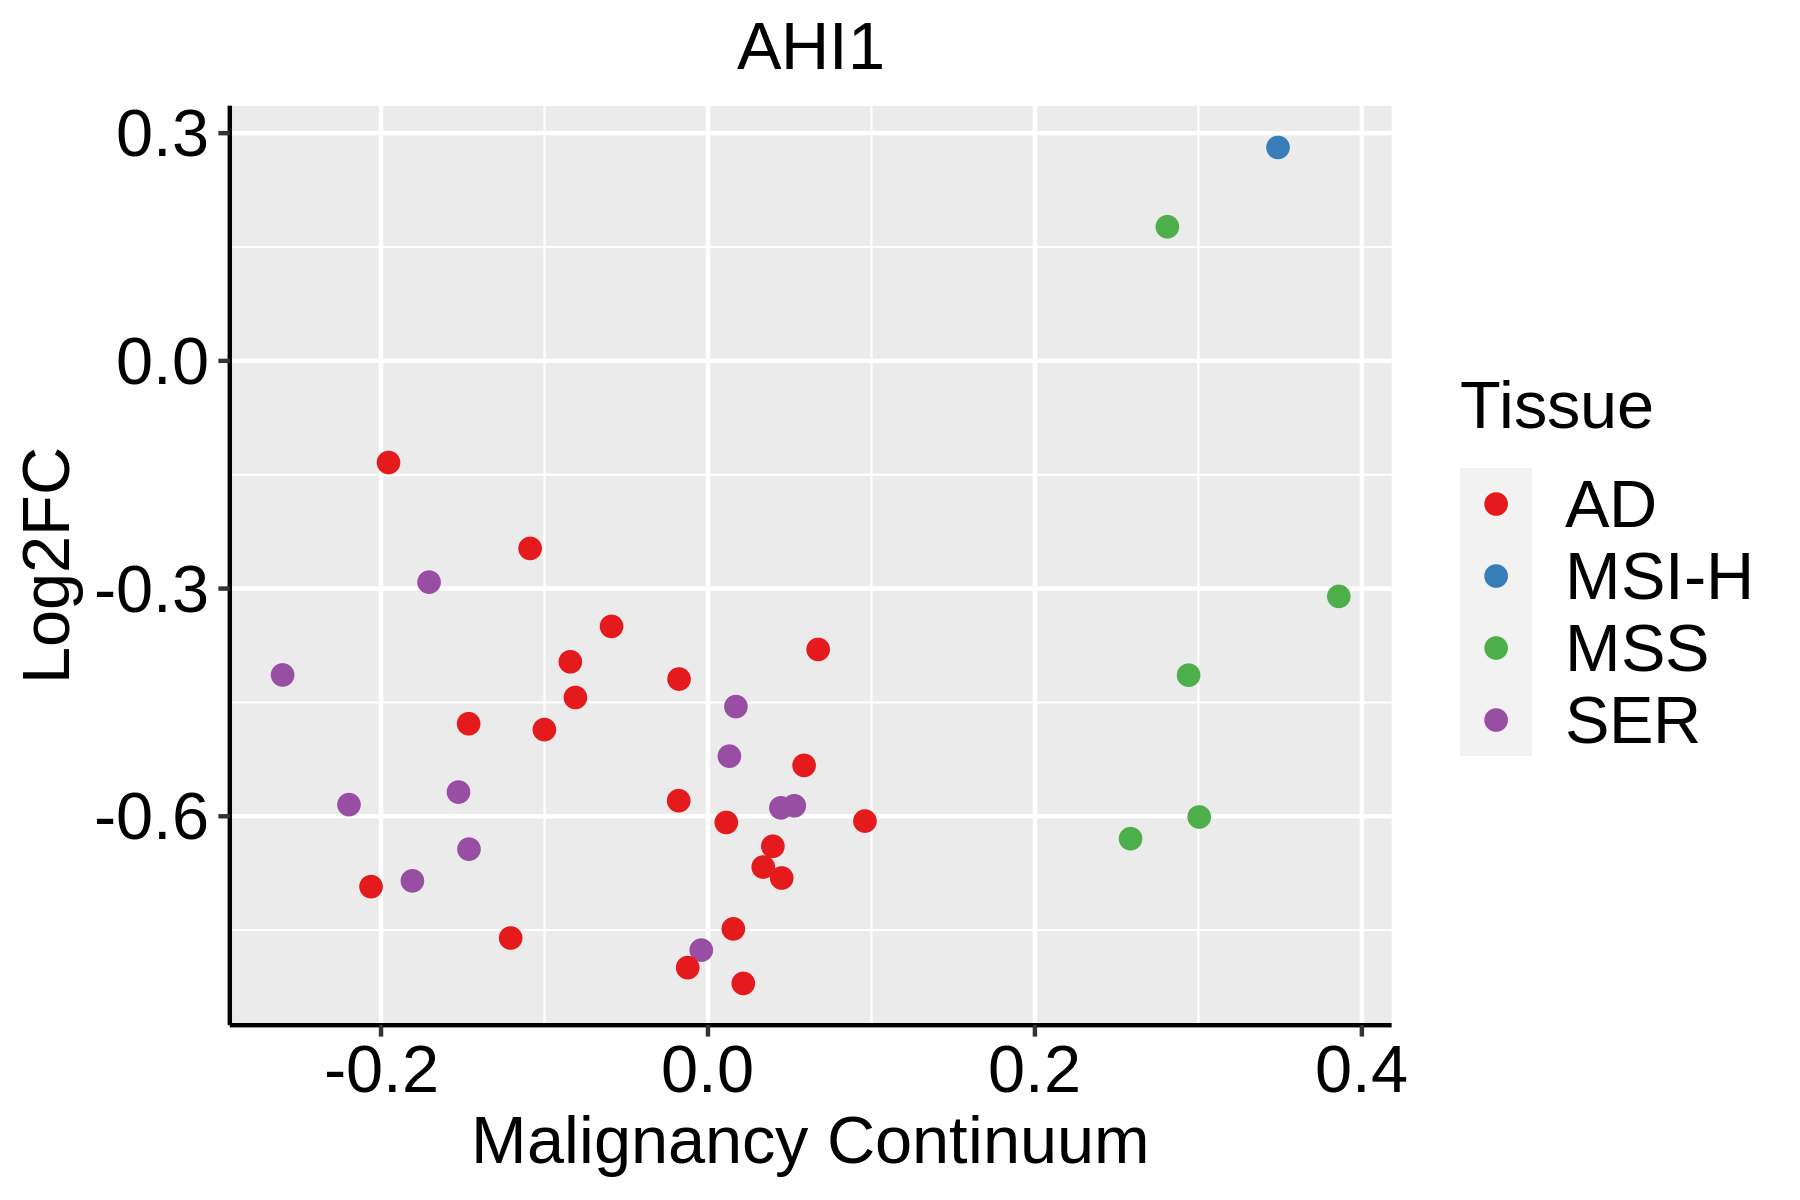 | AD: Adenomas |
| SER: Sessile serrated lesions | ||
| MSI-H: Microsatellite-high colorectal cancer | ||
| MSS: Microsatellite stable colorectal cancer | ||
| Endometrium | 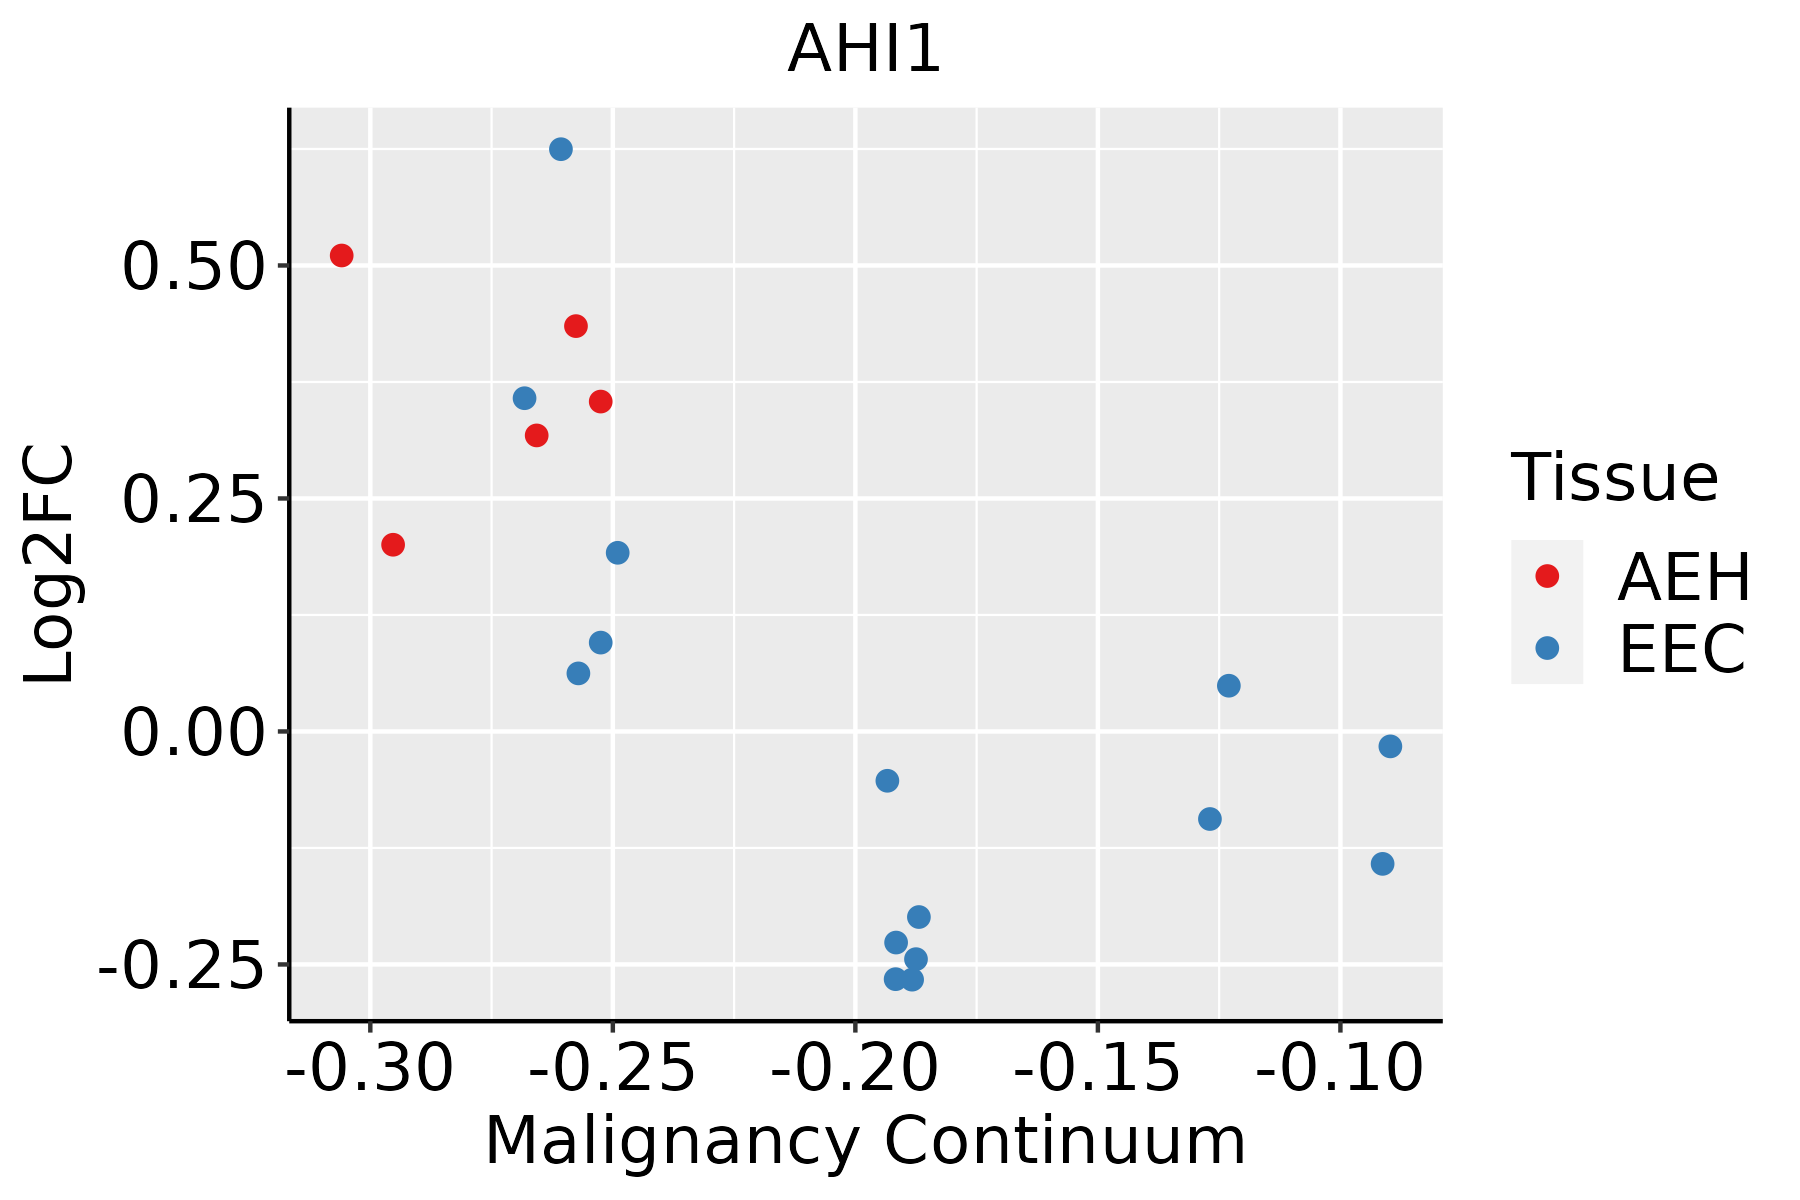 | AEH: Atypical endometrial hyperplasia |
| EEC: Endometrioid Cancer | ||
| Esophagus |  | ESCC: Esophageal squamous cell carcinoma |
| HGIN: High-grade intraepithelial neoplasias | ||
| LGIN: Low-grade intraepithelial neoplasias | ||
| Liver | 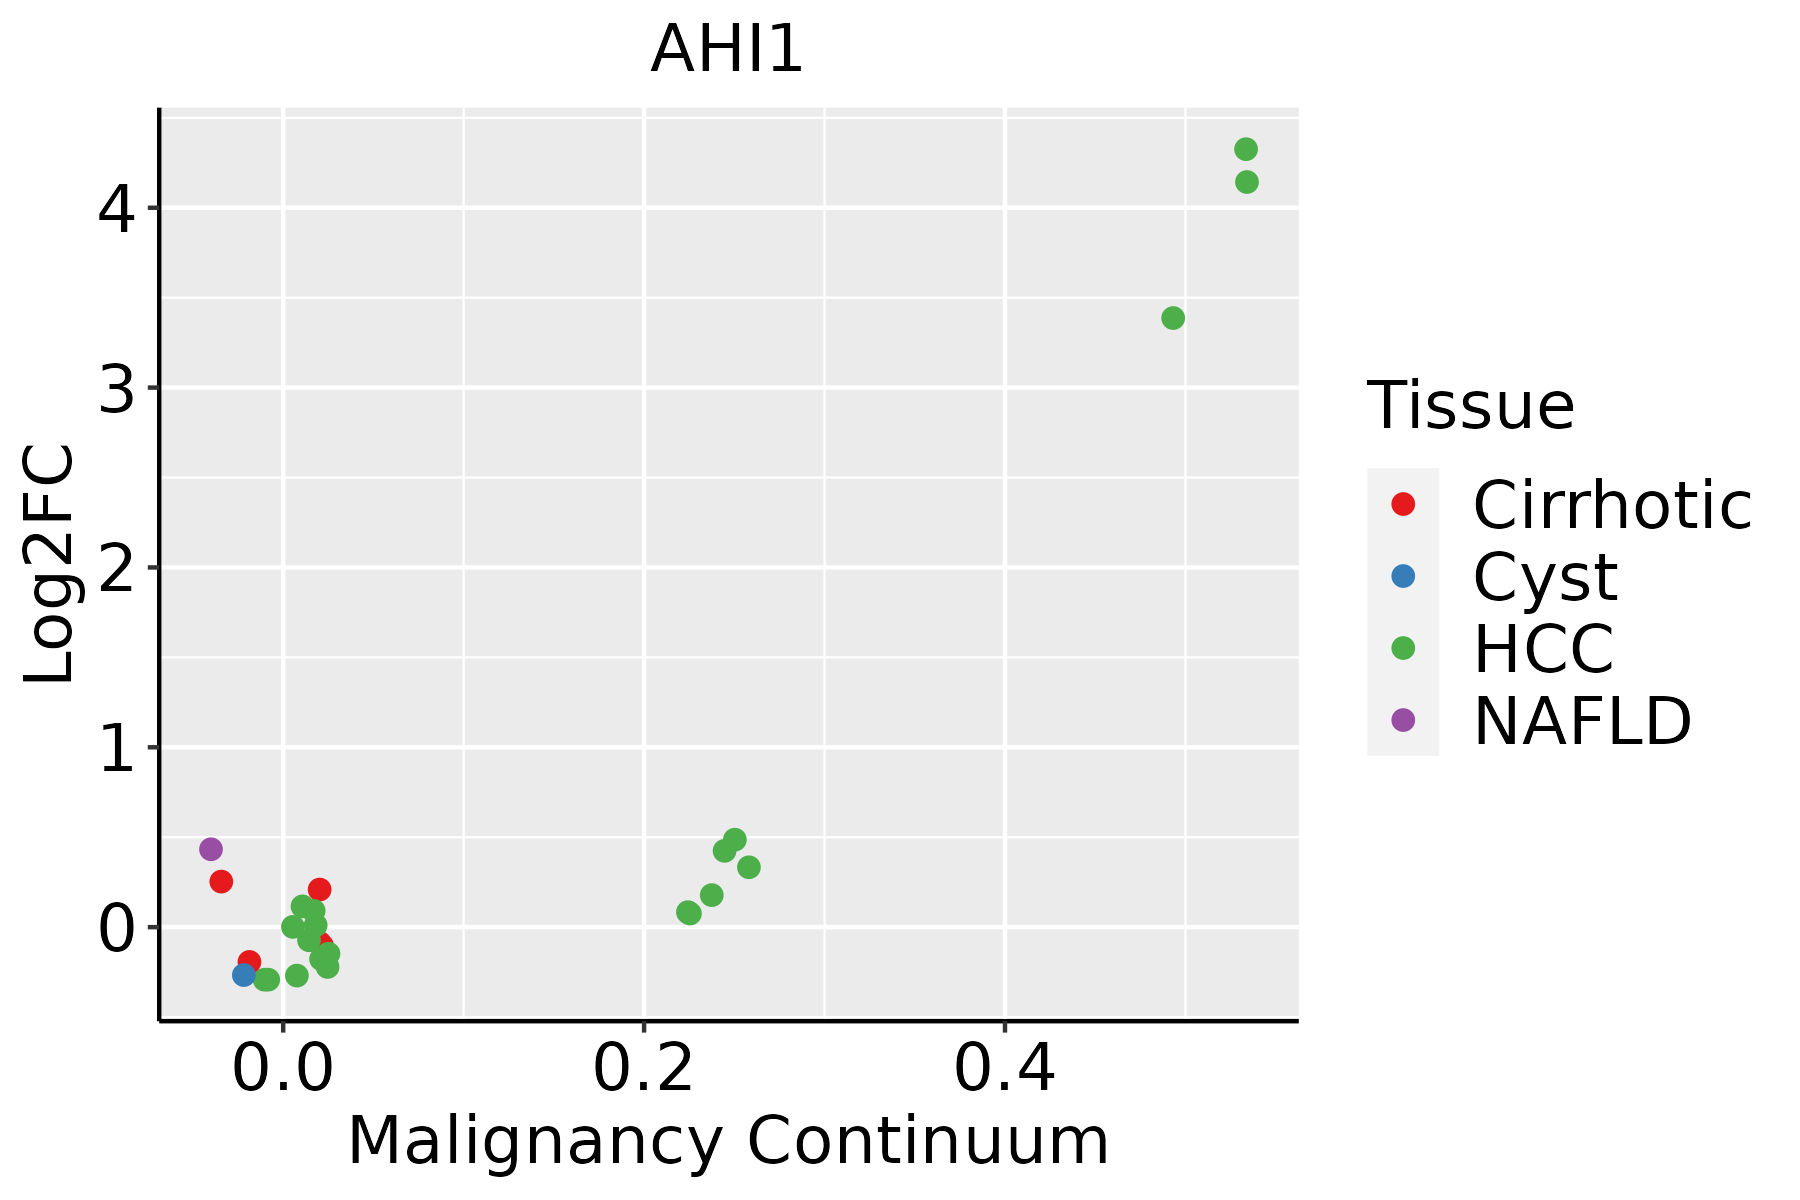 | HCC: Hepatocellular carcinoma |
| NAFLD: Non-alcoholic fatty liver disease | ||
| Lung | 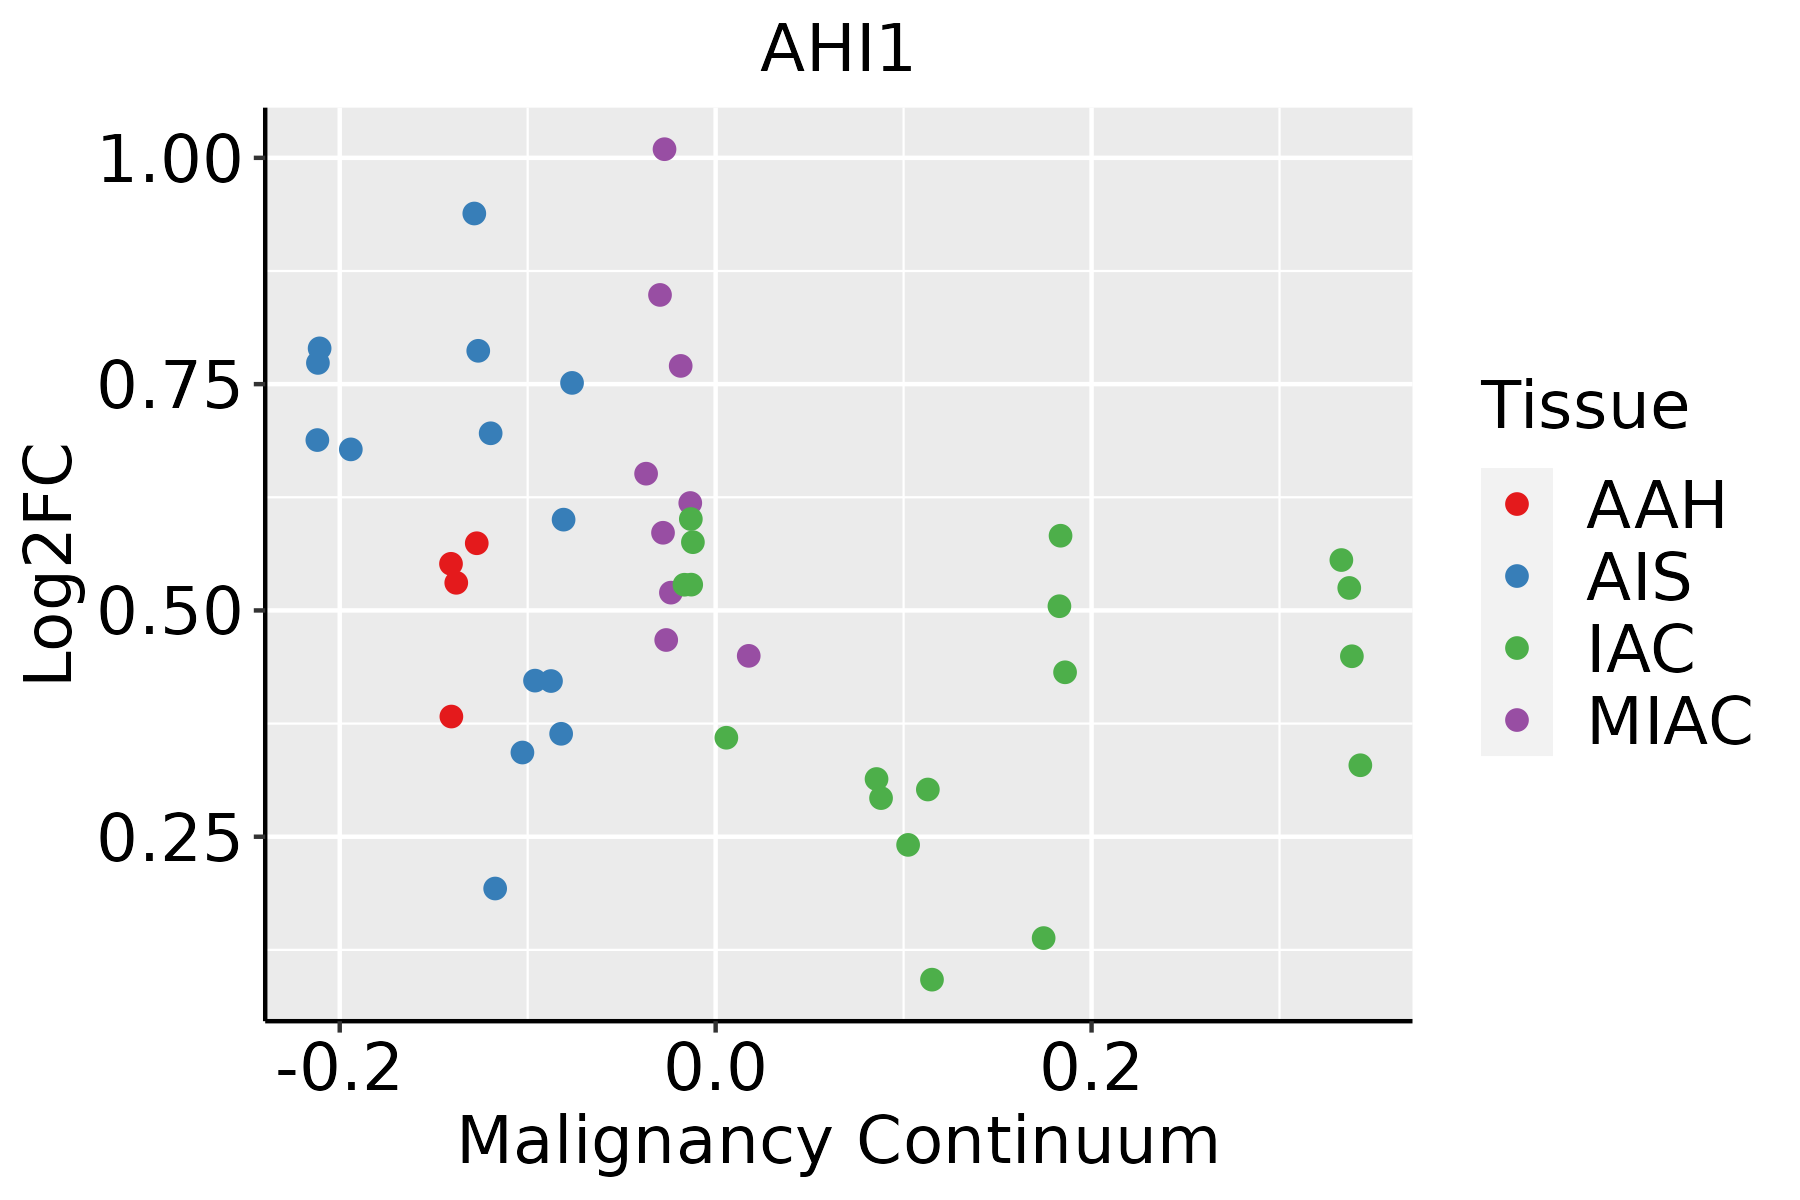 | AAH: Atypical adenomatous hyperplasia |
| AIS: Adenocarcinoma in situ | ||
| IAC: Invasive lung adenocarcinoma | ||
| MIA: Minimally invasive adenocarcinoma | ||
| Oral Cavity | 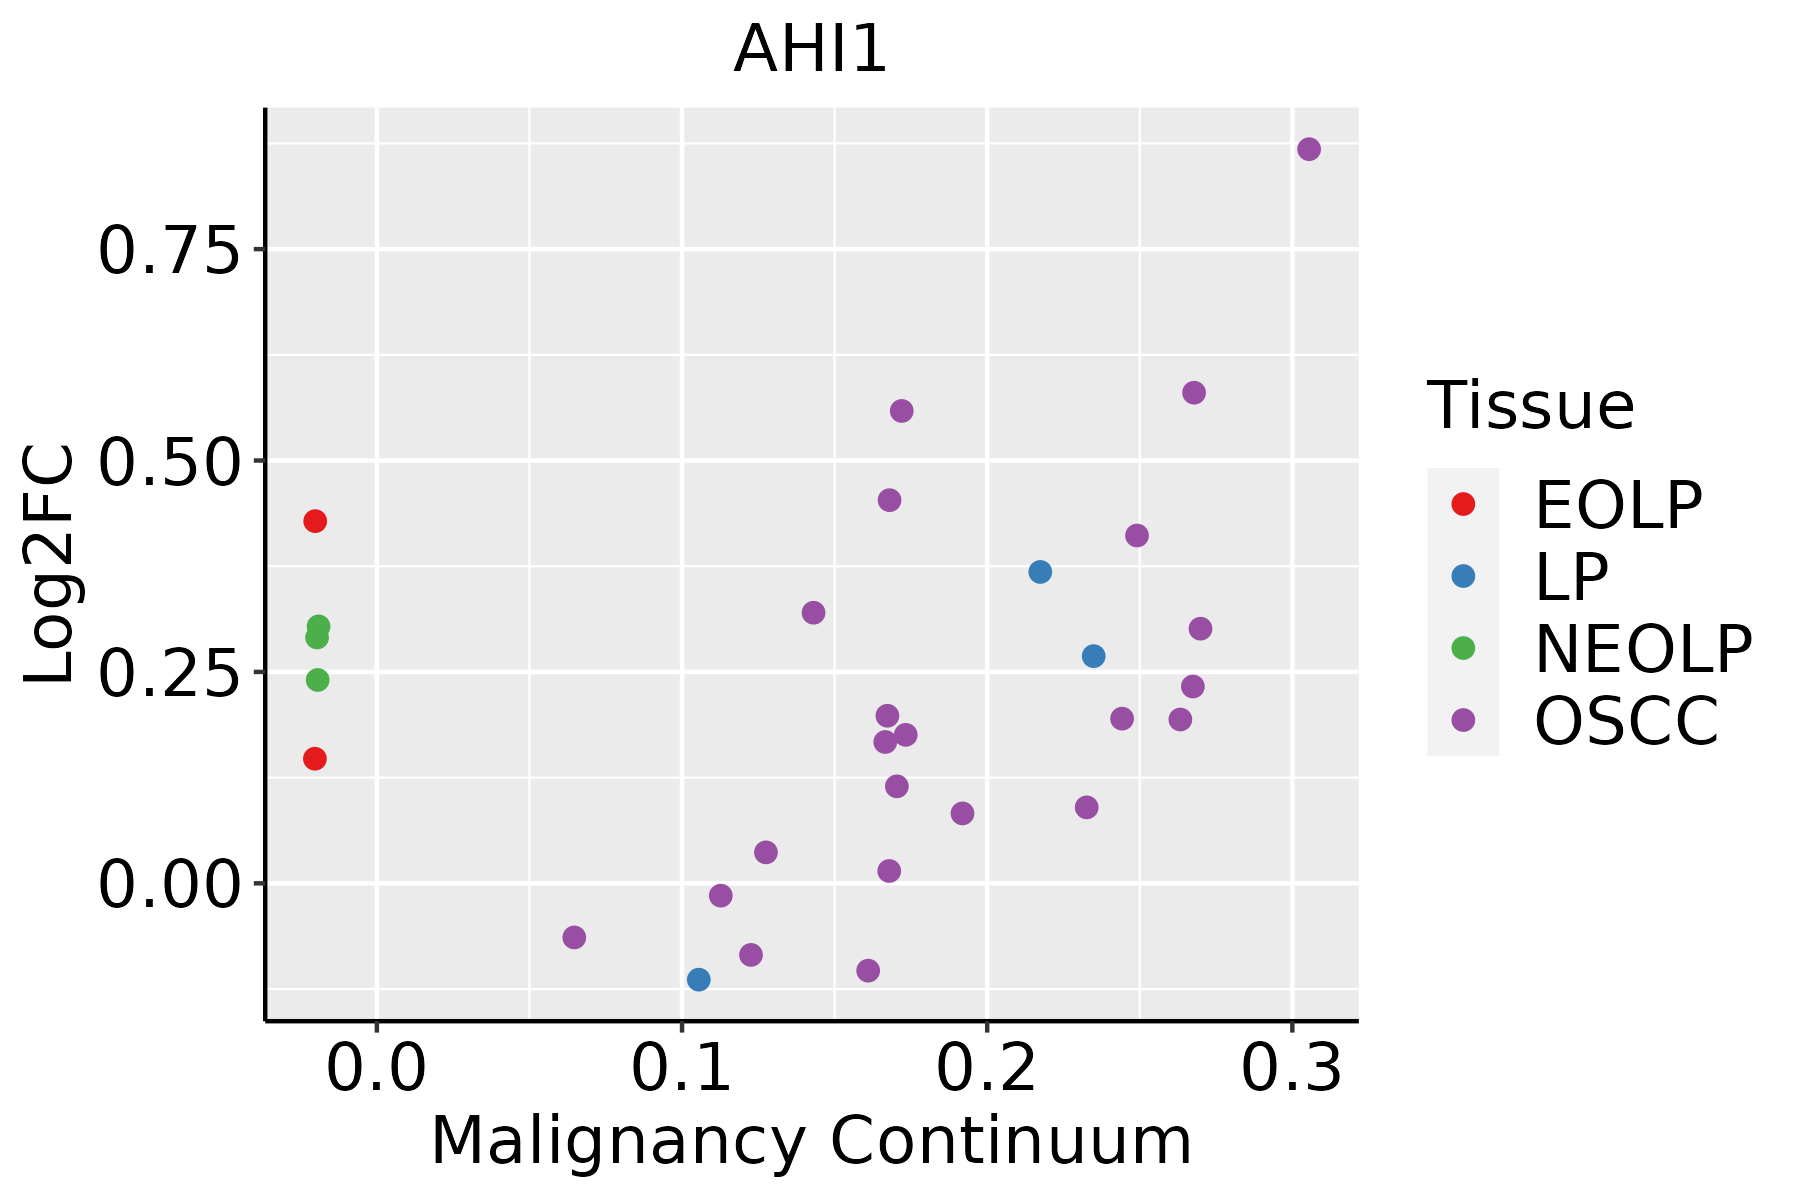 | EOLP: Erosive Oral lichen planus |
| LP: leukoplakia | ||
| NEOLP: Non-erosive oral lichen planus | ||
| OSCC: Oral squamous cell carcinoma | ||
| Prostate | 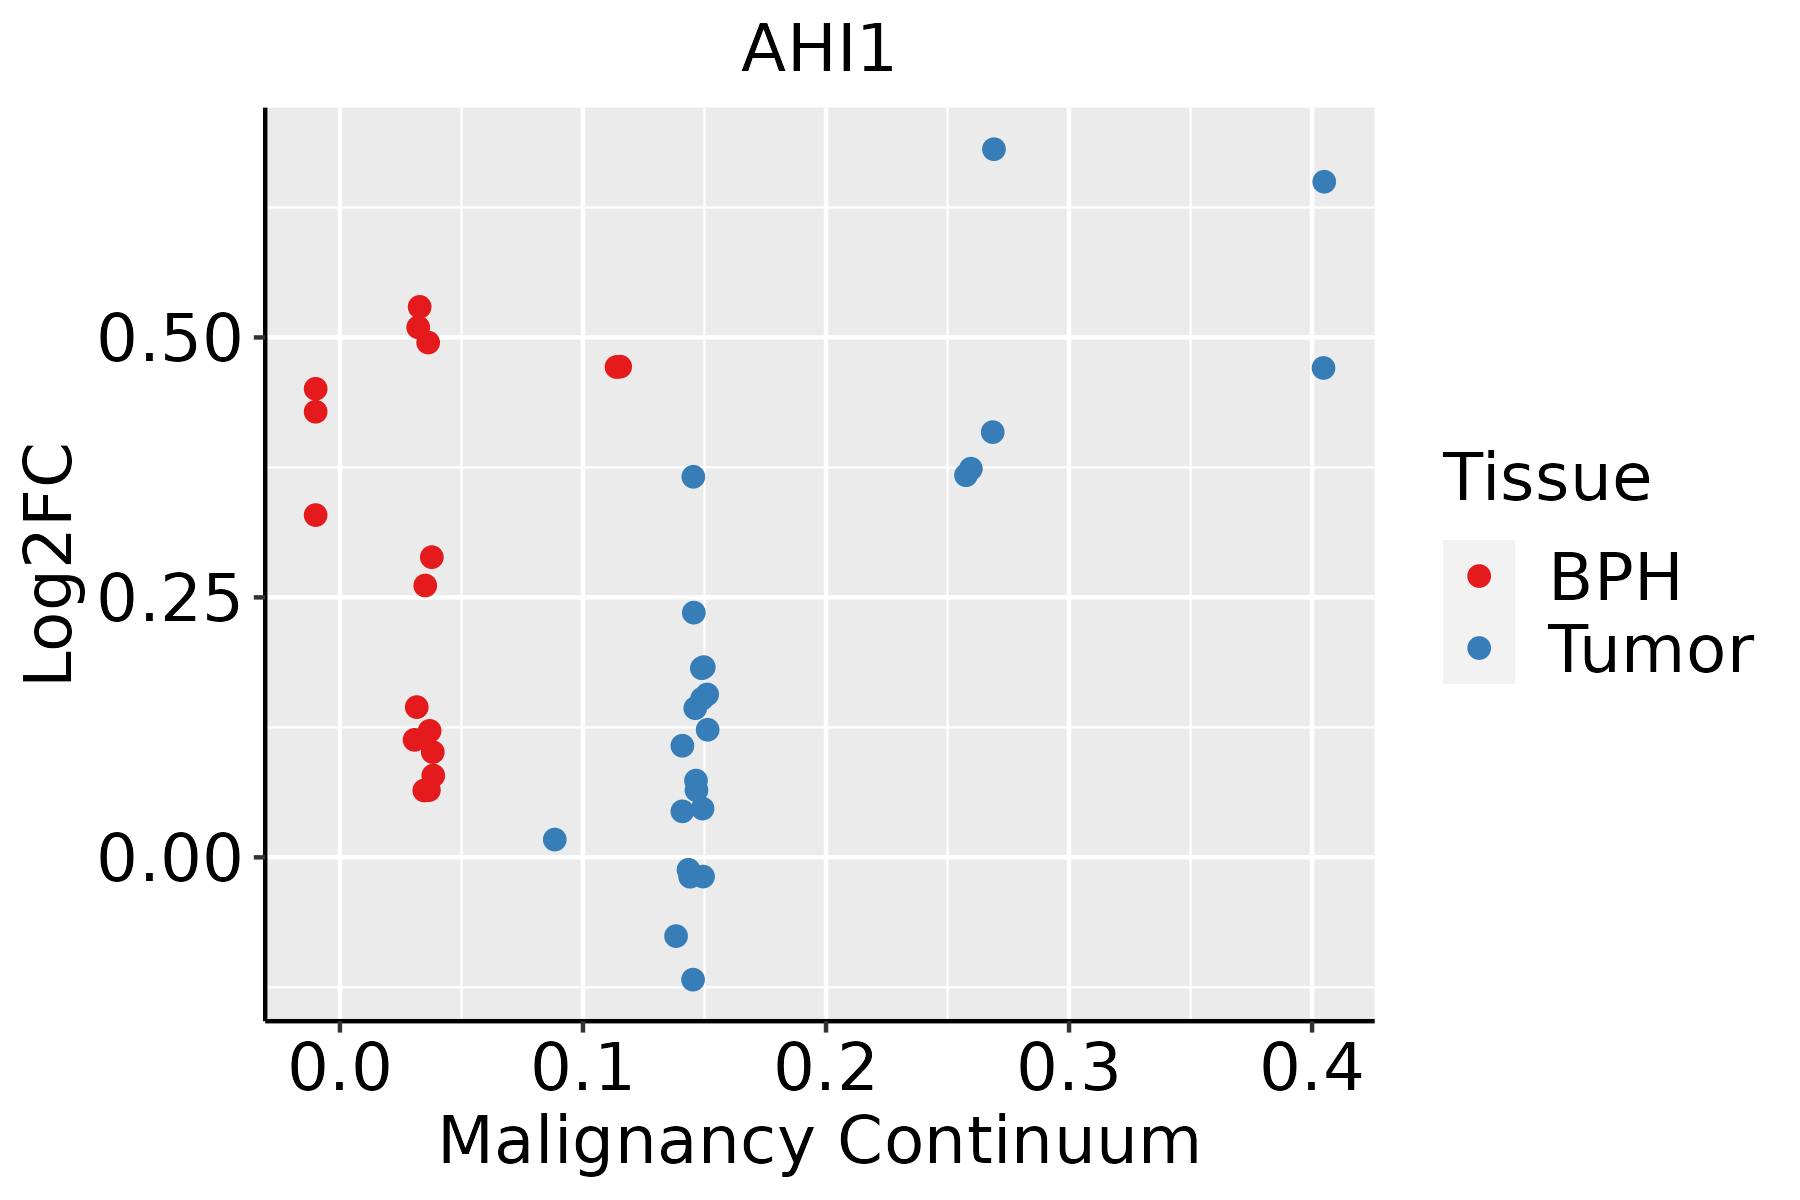 | BPH: Benign Prostatic Hyperplasia |
| Thyroid |  | ATC: Anaplastic thyroid cancer |
| HT: Hashimoto's thyroiditis | ||
| PTC: Papillary thyroid cancer |
| ∗log2FC in expression of this searched gene in stem-like cells from each diseased tissue sample relative to stem-like cells in normal samples in each tissue plotted against the malignancy continuum. Samples are colored based on if they are from different disease stage. |
Top |
Malignant transformation related pathway analysis |
| Find out the enriched GO biological processes and KEGG pathways involved in transition from healthy to precancer to cancer |
| Tissue | Disease Stage | Enriched GO biological Processes |
| Colorectum | AD |  |
| Colorectum | SER |  |
| Colorectum | MSS |  |
| Colorectum | MSI-H |  |
| Colorectum | FAP |  |
| ∗Top 15 enriched GO BP terms are showed in the bar plot of each disease state in each tissue. Each row represents a significant GO biological process which is colored according to the -log10(p.adjust). |
| Page: 1 2 3 4 5 6 7 8 9 |
| GO ID | Tissue | Disease Stage | Description | Gene Ratio | Bg Ratio | pvalue | p.adjust | Count |
| GO:006056215 | Oral cavity | NEOLP | epithelial tube morphogenesis | 49/2005 | 325/18723 | 8.68e-03 | 4.17e-02 | 49 |
| GO:00485921 | Oral cavity | NEOLP | eye morphogenesis | 26/2005 | 151/18723 | 9.93e-03 | 4.65e-02 | 26 |
| GO:00605628 | Prostate | BPH | epithelial tube morphogenesis | 87/3107 | 325/18723 | 2.05e-06 | 3.39e-05 | 87 |
| GO:00308565 | Prostate | BPH | regulation of epithelial cell differentiation | 49/3107 | 154/18723 | 2.28e-06 | 3.74e-05 | 49 |
| GO:00431129 | Prostate | BPH | receptor metabolic process | 51/3107 | 166/18723 | 4.49e-06 | 6.71e-05 | 51 |
| GO:00016557 | Prostate | BPH | urogenital system development | 88/3107 | 338/18723 | 6.05e-06 | 8.83e-05 | 88 |
| GO:003010010 | Prostate | BPH | regulation of endocytosis | 60/3107 | 211/18723 | 1.06e-05 | 1.45e-04 | 60 |
| GO:00068989 | Prostate | BPH | receptor-mediated endocytosis | 66/3107 | 244/18723 | 2.34e-05 | 2.80e-04 | 66 |
| GO:00720737 | Prostate | BPH | kidney epithelium development | 42/3107 | 136/18723 | 2.62e-05 | 3.10e-04 | 42 |
| GO:00720016 | Prostate | BPH | renal system development | 76/3107 | 302/18723 | 8.55e-05 | 8.09e-04 | 76 |
| GO:00018225 | Prostate | BPH | kidney development | 74/3107 | 293/18723 | 9.31e-05 | 8.76e-04 | 74 |
| GO:00458079 | Prostate | BPH | positive regulation of endocytosis | 32/3107 | 100/18723 | 1.09e-04 | 9.95e-04 | 32 |
| GO:00720094 | Prostate | BPH | nephron epithelium development | 33/3107 | 109/18723 | 2.77e-04 | 2.16e-03 | 33 |
| GO:00720065 | Prostate | BPH | nephron development | 39/3107 | 142/18723 | 7.33e-04 | 4.86e-03 | 39 |
| GO:00308593 | Prostate | BPH | polarized epithelial cell differentiation | 11/3107 | 24/18723 | 7.76e-04 | 5.10e-03 | 11 |
| GO:00316238 | Prostate | BPH | receptor internalization | 32/3107 | 113/18723 | 1.21e-03 | 7.41e-03 | 32 |
| GO:00482599 | Prostate | BPH | regulation of receptor-mediated endocytosis | 31/3107 | 110/18723 | 1.56e-03 | 9.16e-03 | 31 |
| GO:00030073 | Prostate | BPH | heart morphogenesis | 58/3107 | 246/18723 | 2.86e-03 | 1.50e-02 | 58 |
| GO:00613264 | Prostate | BPH | renal tubule development | 26/3107 | 94/18723 | 4.70e-03 | 2.25e-02 | 26 |
| GO:00720805 | Prostate | BPH | nephron tubule development | 25/3107 | 91/18723 | 6.04e-03 | 2.78e-02 | 25 |
| Page: 1 2 3 4 5 6 7 8 9 10 11 12 13 14 15 16 17 |
| Pathway ID | Tissue | Disease Stage | Description | Gene Ratio | Bg Ratio | pvalue | p.adjust | qvalue | Count |
| Page: 1 |
Top |
Cell-cell communication analysis |
| Identification of potential cell-cell interactions between two cell types and their ligand-receptor pairs for different disease states |
| Ligand | Receptor | LRpair | Pathway | Tissue | Disease Stage |
| Page: 1 |
Top |
Single-cell gene regulatory network inference analysis |
| Find out the significant the regulons (TFs) and the target genes of each regulon across cell types for different disease states |
| TF | Cell Type | Tissue | Disease Stage | Target Gene | RSS | Regulon Activity |
| ∗The dot plots of a searched regulon are shown for all cell subpopulations in each disease state of each tissue based on the regulon specific score inferred using pySCENIC and by calculating the average expression. |
| Page: 1 |
Top |
Somatic mutation of malignant transformation related genes |
| Annotation of somatic variants for genes involved in malignant transformation |
| Hugo Symbol | Variant Class | Variant Classification | dbSNP RS | HGVSc | HGVSp | HGVSp Short | SWISSPROT | BIOTYPE | SIFT | PolyPhen | Tumor Sample Barcode | Tissue | Histology | Sex | Age | Stage | Therapy Types | Drugs | Outcome |
| AHI1 | SNV | Missense_Mutation | c.3220N>A | p.Arg1074Ser | p.R1074S | Q8N157 | protein_coding | deleterious(0) | probably_damaging(0.989) | TCGA-A2-A0CL-01 | Breast | breast invasive carcinoma | Female | <65 | III/IV | Chemotherapy | cytoxan | SD | |
| AHI1 | SNV | Missense_Mutation | rs774732509 | c.3565N>C | p.Gly1189Arg | p.G1189R | Q8N157 | protein_coding | tolerated_low_confidence(0.25) | possibly_damaging(0.448) | TCGA-A2-A3Y0-01 | Breast | breast invasive carcinoma | Female | <65 | I/II | Chemotherapy | adriamycin | CR |
| AHI1 | SNV | Missense_Mutation | c.1723G>A | p.Glu575Lys | p.E575K | Q8N157 | protein_coding | tolerated(0.18) | possibly_damaging(0.628) | TCGA-AC-A23H-01 | Breast | breast invasive carcinoma | Female | >=65 | I/II | Unknown | Unknown | PD | |
| AHI1 | SNV | Missense_Mutation | c.1231A>G | p.Lys411Glu | p.K411E | Q8N157 | protein_coding | deleterious(0) | possibly_damaging(0.907) | TCGA-AN-A0XN-01 | Breast | breast invasive carcinoma | Female | >=65 | III/IV | Unknown | Unknown | SD | |
| AHI1 | SNV | Missense_Mutation | novel | c.1467N>A | p.Asn489Lys | p.N489K | Q8N157 | protein_coding | deleterious(0) | probably_damaging(0.996) | TCGA-AR-A0U0-01 | Breast | breast invasive carcinoma | Female | >=65 | I/II | Unknown | Unknown | SD |
| AHI1 | SNV | Missense_Mutation | c.974N>G | p.Glu325Gly | p.E325G | Q8N157 | protein_coding | deleterious(0) | benign(0.255) | TCGA-D8-A1J8-01 | Breast | breast invasive carcinoma | Female | >=65 | I/II | Hormone Therapy | nolvadex | SD | |
| AHI1 | SNV | Missense_Mutation | c.303G>C | p.Leu101Phe | p.L101F | Q8N157 | protein_coding | tolerated(0.14) | benign(0.172) | TCGA-D8-A1JA-01 | Breast | breast invasive carcinoma | Female | <65 | III/IV | Chemotherapy | adriamycin | PD | |
| AHI1 | SNV | Missense_Mutation | c.2440C>T | p.Arg814Cys | p.R814C | Q8N157 | protein_coding | tolerated(0.1) | benign(0.173) | TCGA-D8-A1JB-01 | Breast | breast invasive carcinoma | Female | <65 | I/II | Chemotherapy | adriamycin | SD | |
| AHI1 | insertion | Frame_Shift_Ins | novel | c.1465_1466insCTCCTGCTTT | p.Asn489ThrfsTer19 | p.N489Tfs*19 | Q8N157 | protein_coding | TCGA-AR-A0U0-01 | Breast | breast invasive carcinoma | Female | >=65 | I/II | Unknown | Unknown | SD | ||
| AHI1 | SNV | Missense_Mutation | rs199612496 | c.82C>T | p.Arg28Cys | p.R28C | Q8N157 | protein_coding | tolerated(0.07) | benign(0) | TCGA-2W-A8YY-01 | Cervix | cervical & endocervical cancer | Female | <65 | I/II | Chemotherapy | cisplatin | CR |
| Page: 1 2 3 4 5 6 7 8 9 10 11 12 |
Top |
Related drugs of malignant transformation related genes |
| Identification of chemicals and drugs interact with genes involved in malignant transfromation |
| (DGIdb 4.0) |
| Entrez ID | Symbol | Category | Interaction Types | Drug Claim Name | Drug Name | PMIDs |
| Page: 1 |

Copyright 2023-Present -The University of Texas Health Science Center at Houston |