
|
|||||
|
 | |
| |
| |
| |
| |
| |
|
Gene: YTHDF2 |
Gene summary for YTHDF2 |
| Gene information | Species | Human | Gene symbol | YTHDF2 | Gene ID | 51441 |
| Gene name | YTH N6-methyladenosine RNA binding protein 2 | |
| Gene Alias | CAHL | |
| Cytomap | 1p35.3 | |
| Gene Type | protein-coding | GO ID | GO:0000003 | UniProtAcc | Q9Y5A9 |
Top |
Malignant transformation analysis |
| Identification of the aberrant gene expression in precancerous and cancerous lesions by comparing the gene expression of stem-like cells in diseased tissues with normal stem cells |
| Entrez ID | Symbol | Replicates | Species | Organ | Tissue | Adj P-value | Log2FC | Malignancy |
| 51441 | YTHDF2 | LZE4T | Human | Esophagus | ESCC | 3.85e-15 | 2.06e-01 | 0.0811 |
| 51441 | YTHDF2 | LZE5T | Human | Esophagus | ESCC | 2.03e-03 | -1.11e-01 | 0.0514 |
| 51441 | YTHDF2 | LZE7T | Human | Esophagus | ESCC | 1.19e-12 | 1.04e+00 | 0.0667 |
| 51441 | YTHDF2 | LZE8T | Human | Esophagus | ESCC | 6.20e-06 | 2.75e-01 | 0.067 |
| 51441 | YTHDF2 | LZE20T | Human | Esophagus | ESCC | 6.14e-03 | 1.79e-01 | 0.0662 |
| 51441 | YTHDF2 | LZE22T | Human | Esophagus | ESCC | 1.40e-03 | 5.54e-01 | 0.068 |
| 51441 | YTHDF2 | LZE24T | Human | Esophagus | ESCC | 2.35e-16 | 6.82e-01 | 0.0596 |
| 51441 | YTHDF2 | LZE6T | Human | Esophagus | ESCC | 5.35e-04 | 2.61e-01 | 0.0845 |
| 51441 | YTHDF2 | P2T-E | Human | Esophagus | ESCC | 6.41e-48 | 1.26e+00 | 0.1177 |
| 51441 | YTHDF2 | P4T-E | Human | Esophagus | ESCC | 1.34e-27 | 7.27e-01 | 0.1323 |
| 51441 | YTHDF2 | P5T-E | Human | Esophagus | ESCC | 7.73e-19 | 5.21e-01 | 0.1327 |
| 51441 | YTHDF2 | P8T-E | Human | Esophagus | ESCC | 1.07e-21 | 6.12e-01 | 0.0889 |
| 51441 | YTHDF2 | P9T-E | Human | Esophagus | ESCC | 1.12e-16 | 2.65e-01 | 0.1131 |
| 51441 | YTHDF2 | P10T-E | Human | Esophagus | ESCC | 4.10e-45 | 1.21e+00 | 0.116 |
| 51441 | YTHDF2 | P11T-E | Human | Esophagus | ESCC | 1.61e-18 | 8.27e-01 | 0.1426 |
| 51441 | YTHDF2 | P12T-E | Human | Esophagus | ESCC | 3.74e-27 | 8.94e-01 | 0.1122 |
| 51441 | YTHDF2 | P15T-E | Human | Esophagus | ESCC | 5.89e-38 | 1.12e+00 | 0.1149 |
| 51441 | YTHDF2 | P16T-E | Human | Esophagus | ESCC | 3.34e-33 | 7.86e-01 | 0.1153 |
| 51441 | YTHDF2 | P17T-E | Human | Esophagus | ESCC | 7.79e-05 | 6.52e-01 | 0.1278 |
| 51441 | YTHDF2 | P19T-E | Human | Esophagus | ESCC | 2.57e-06 | 5.73e-01 | 0.1662 |
| Page: 1 2 3 4 5 6 7 |
| Tissue | Expression Dynamics | Abbreviation |
| Esophagus | 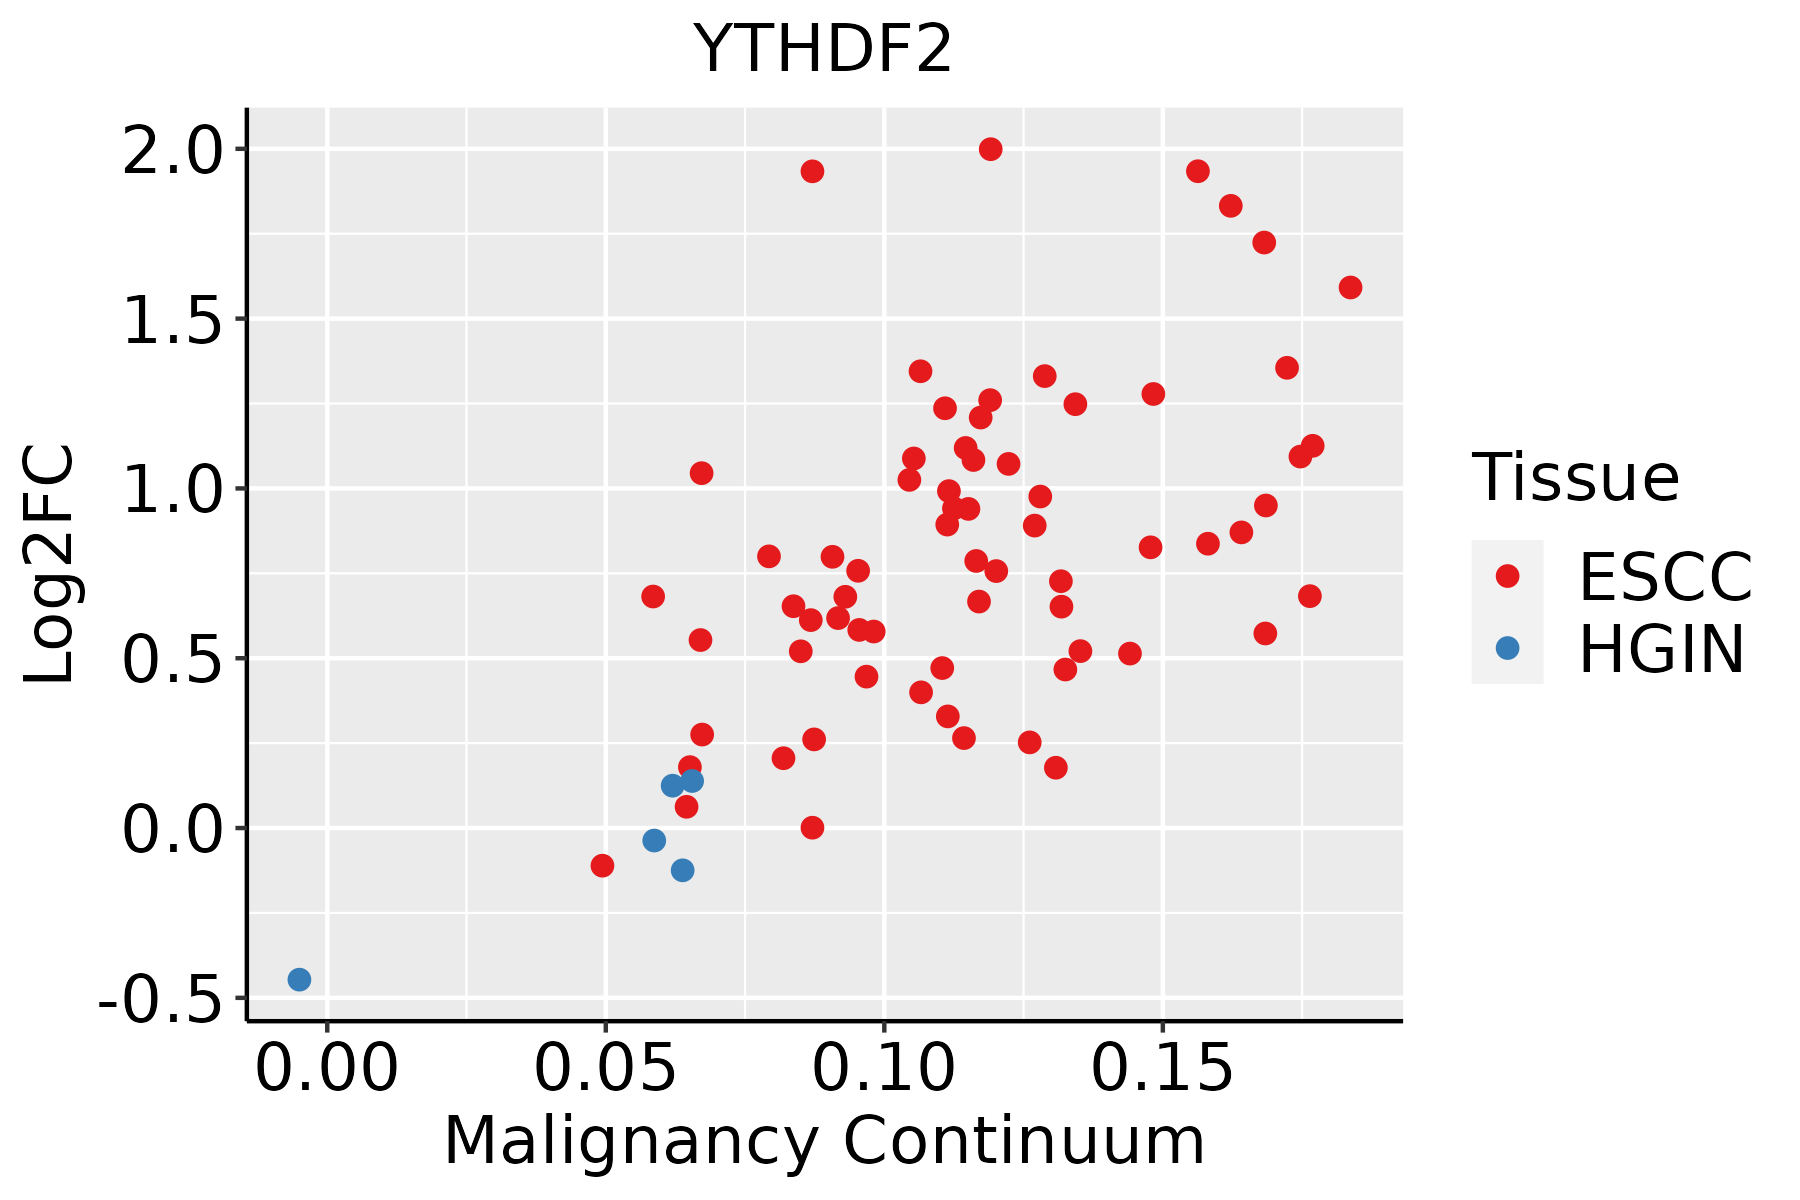 | ESCC: Esophageal squamous cell carcinoma |
| HGIN: High-grade intraepithelial neoplasias | ||
| LGIN: Low-grade intraepithelial neoplasias | ||
| Liver |  | HCC: Hepatocellular carcinoma |
| NAFLD: Non-alcoholic fatty liver disease | ||
| Oral Cavity | 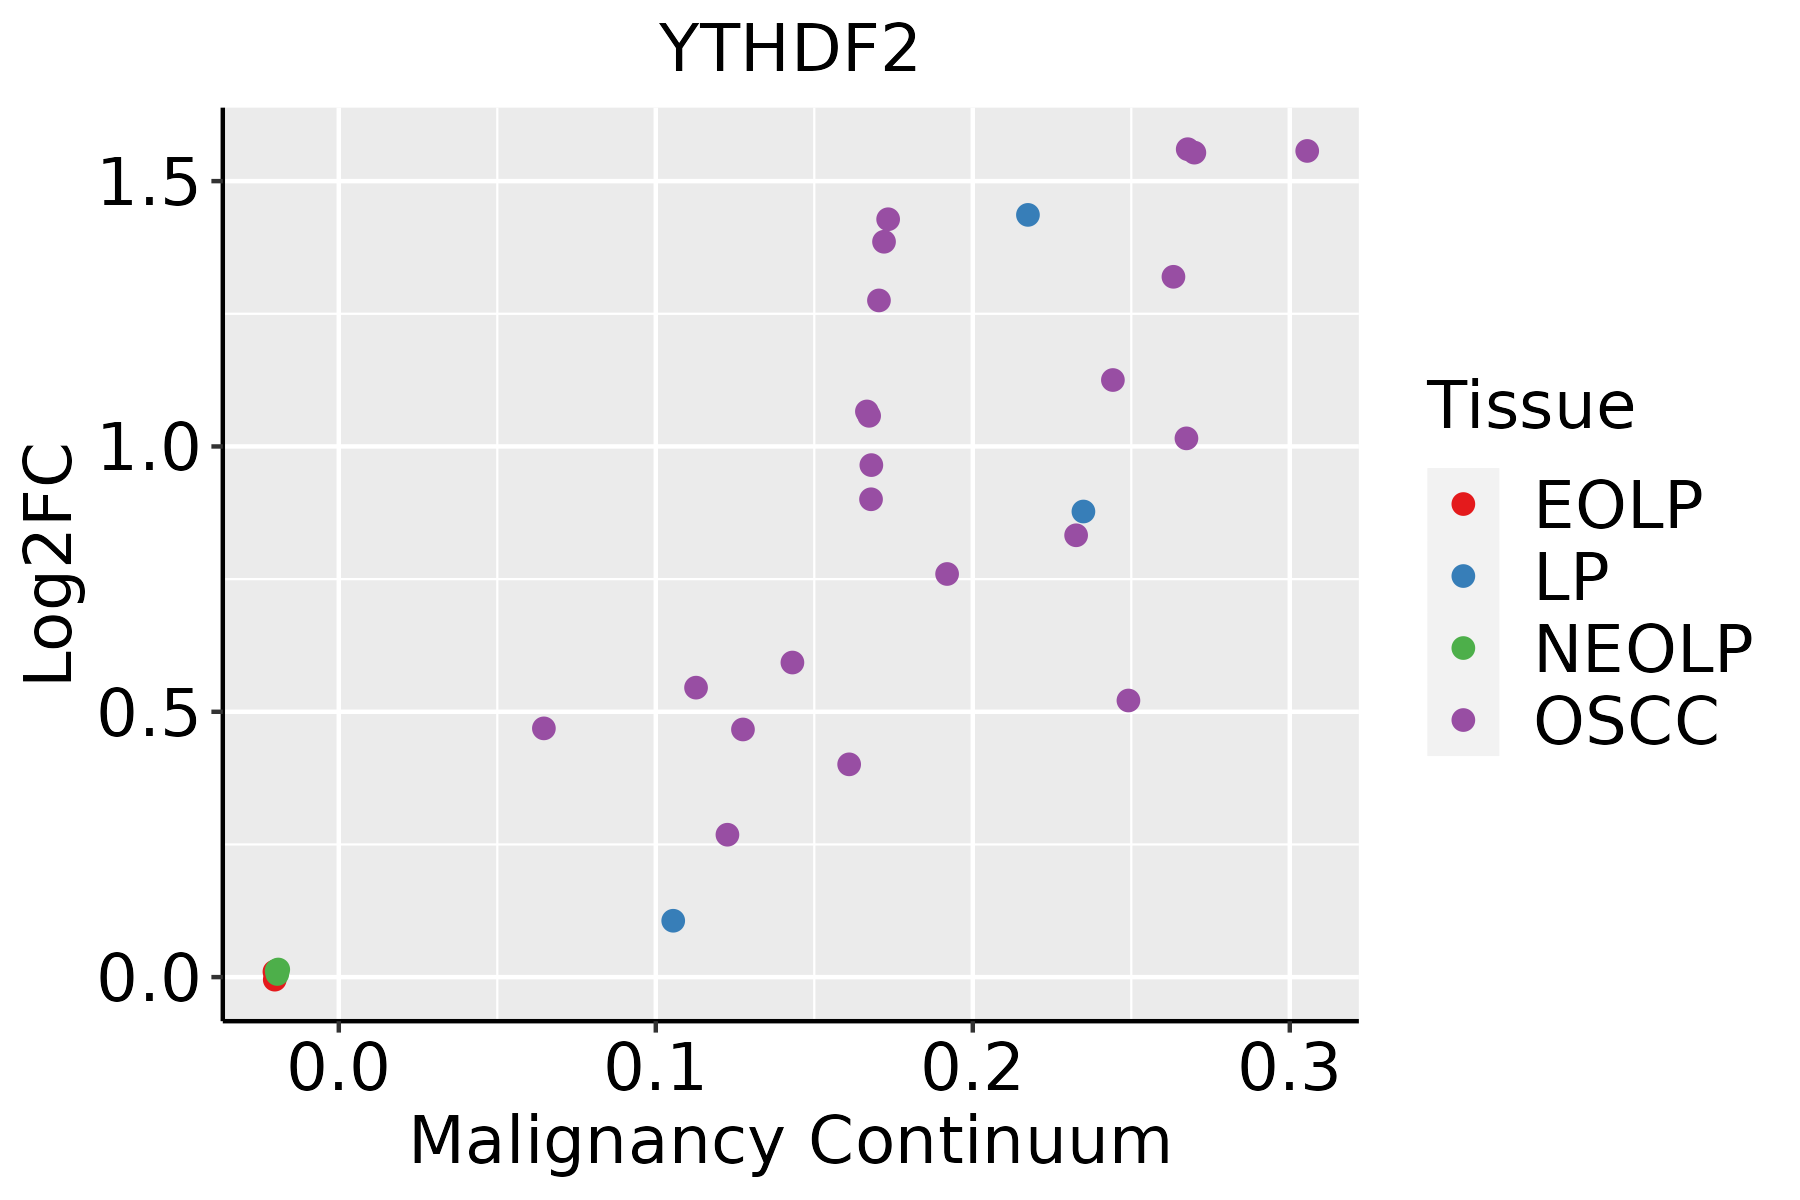 | EOLP: Erosive Oral lichen planus |
| LP: leukoplakia | ||
| NEOLP: Non-erosive oral lichen planus | ||
| OSCC: Oral squamous cell carcinoma | ||
| Prostate | 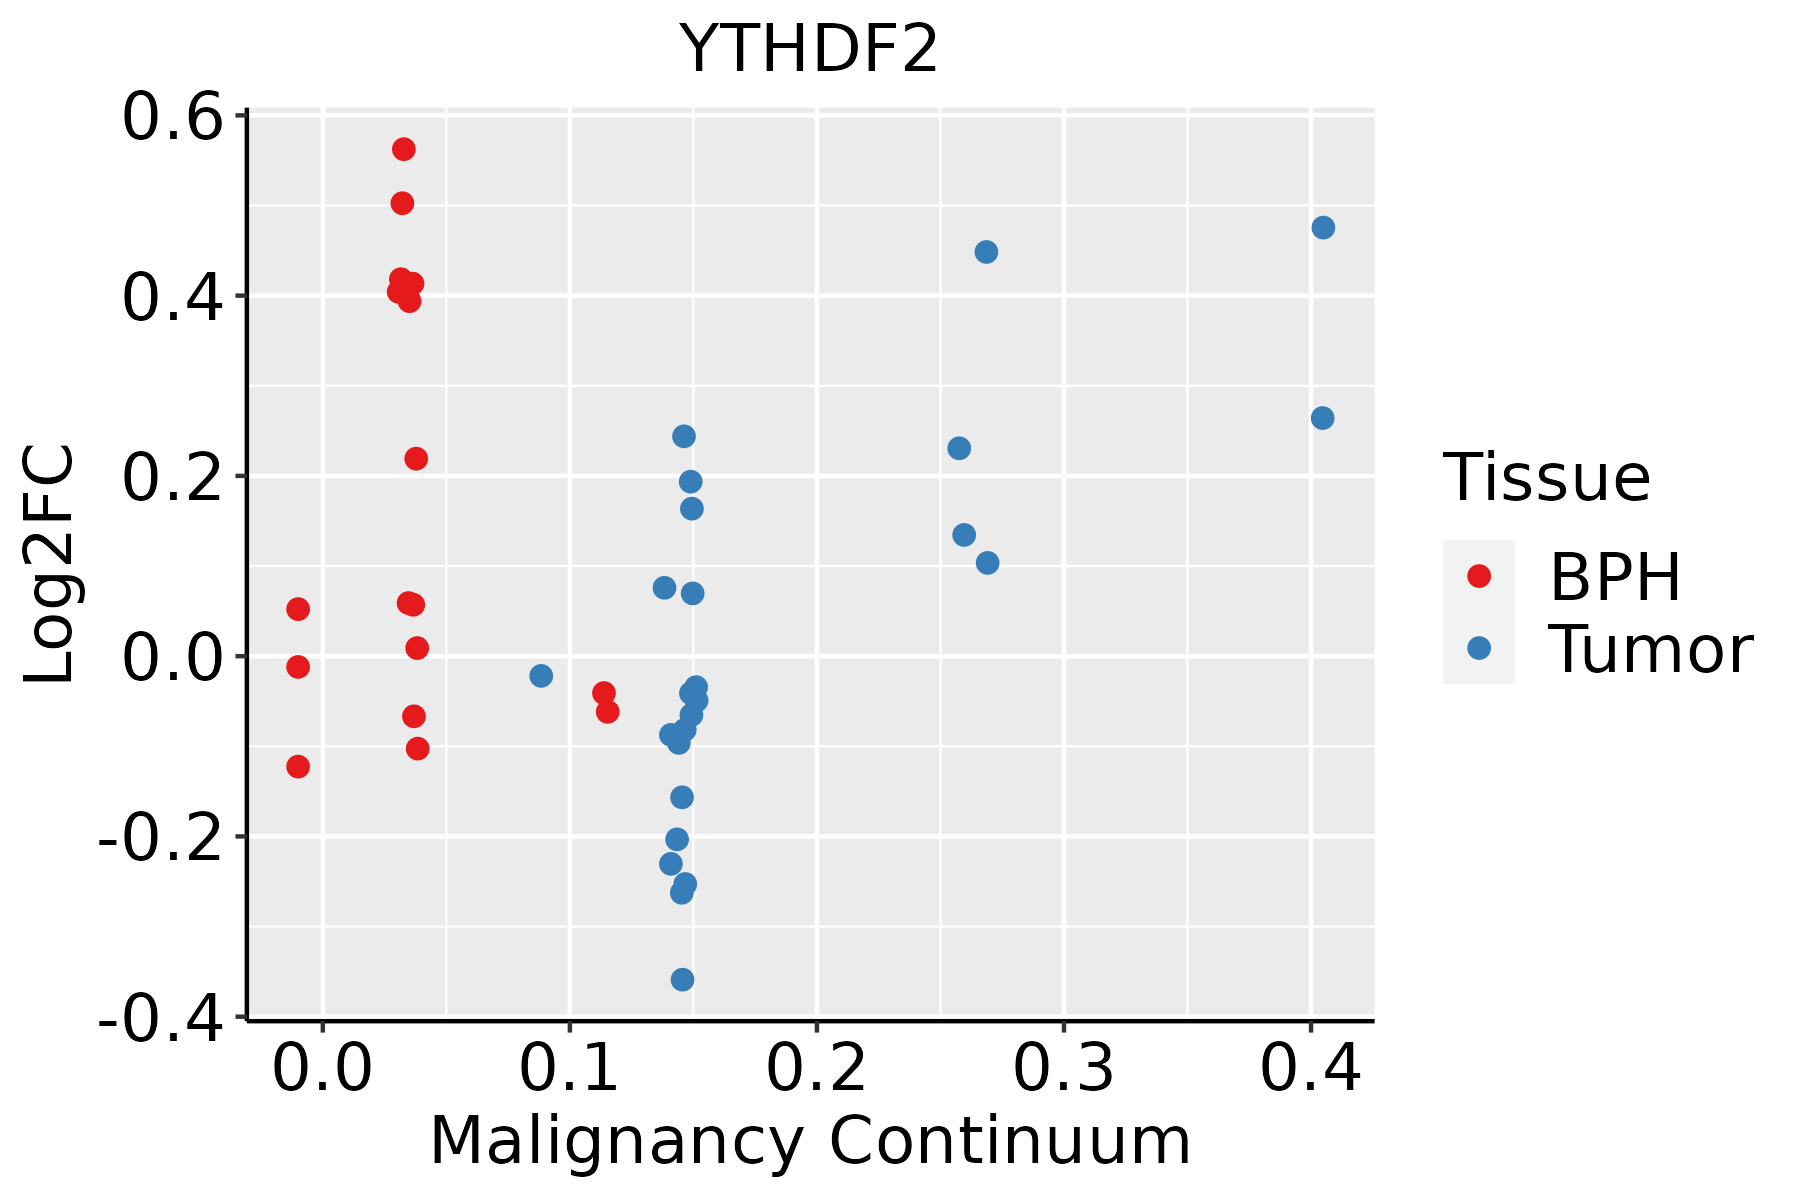 | BPH: Benign Prostatic Hyperplasia |
| Skin | 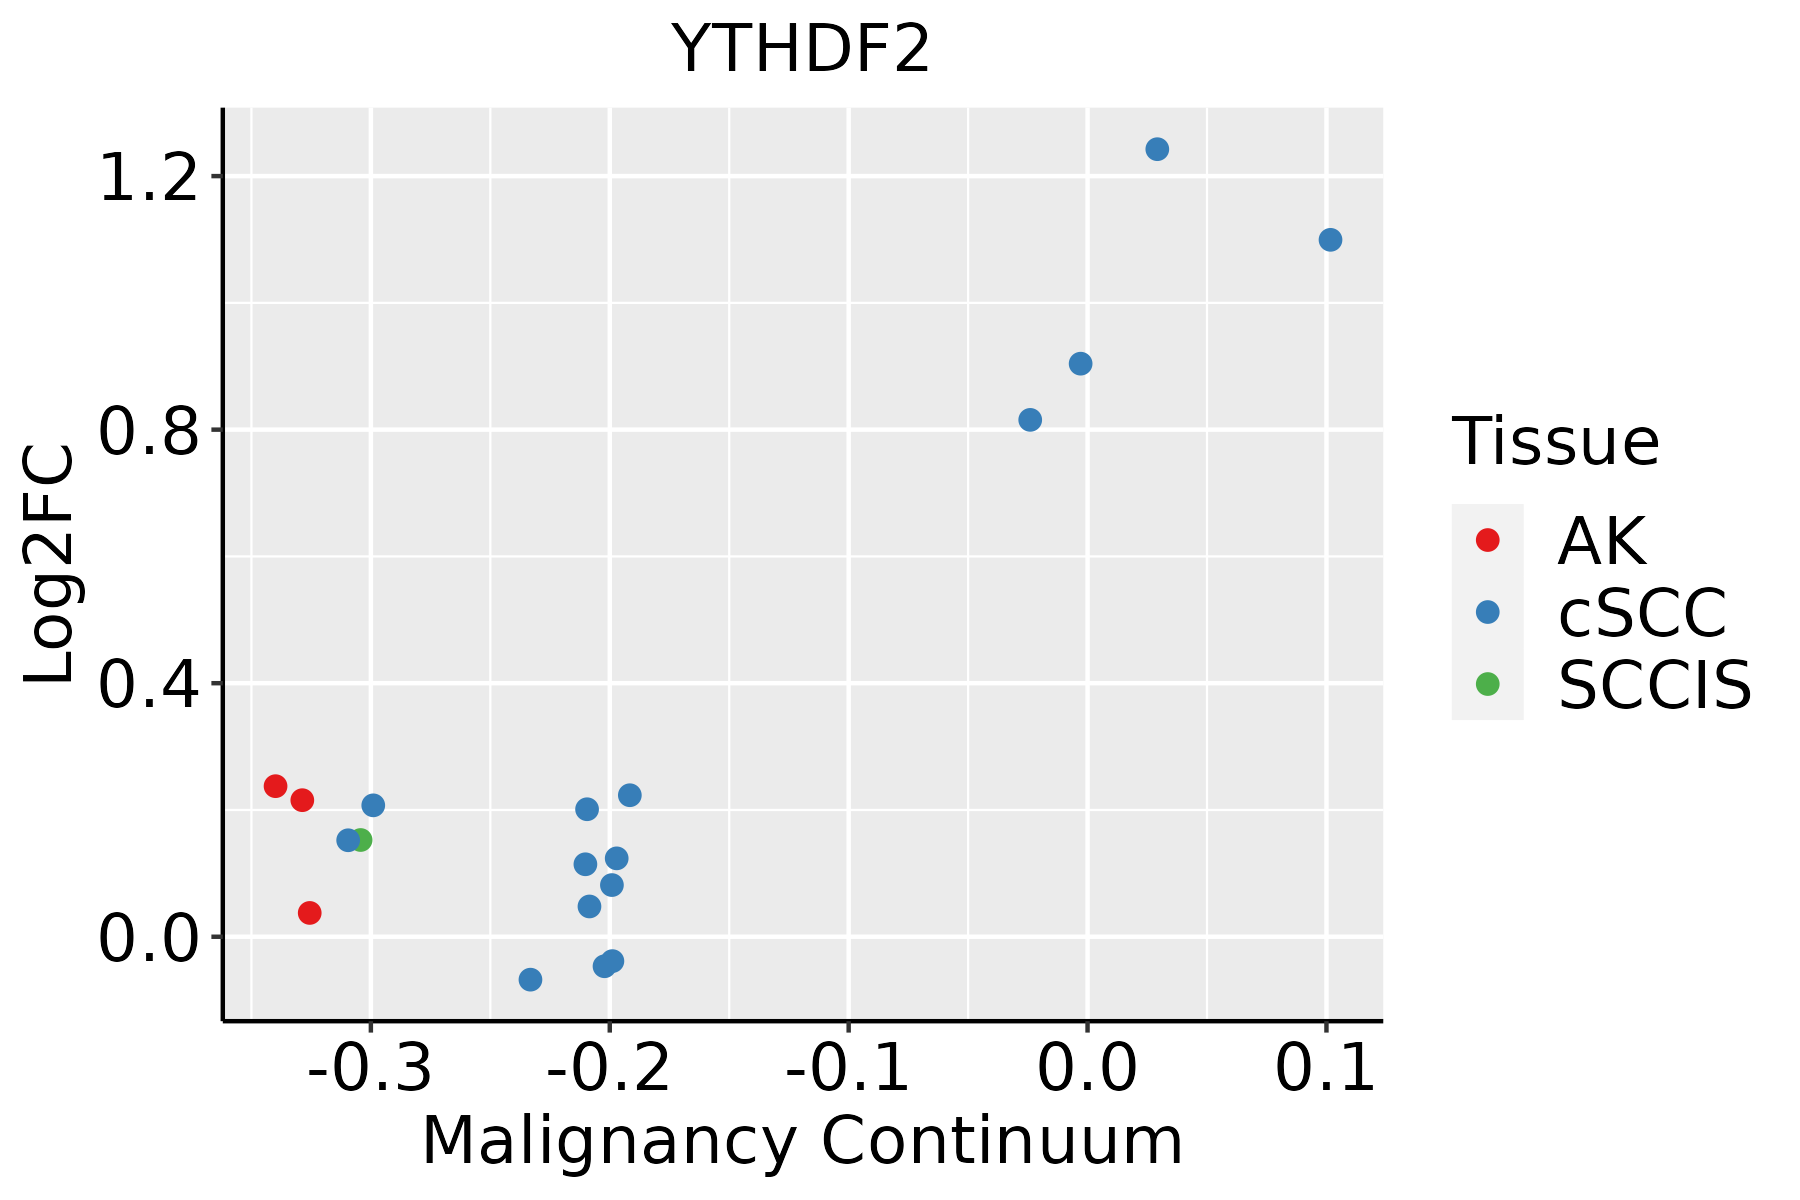 | AK: Actinic keratosis |
| cSCC: Cutaneous squamous cell carcinoma | ||
| SCCIS:squamous cell carcinoma in situ | ||
| Thyroid | 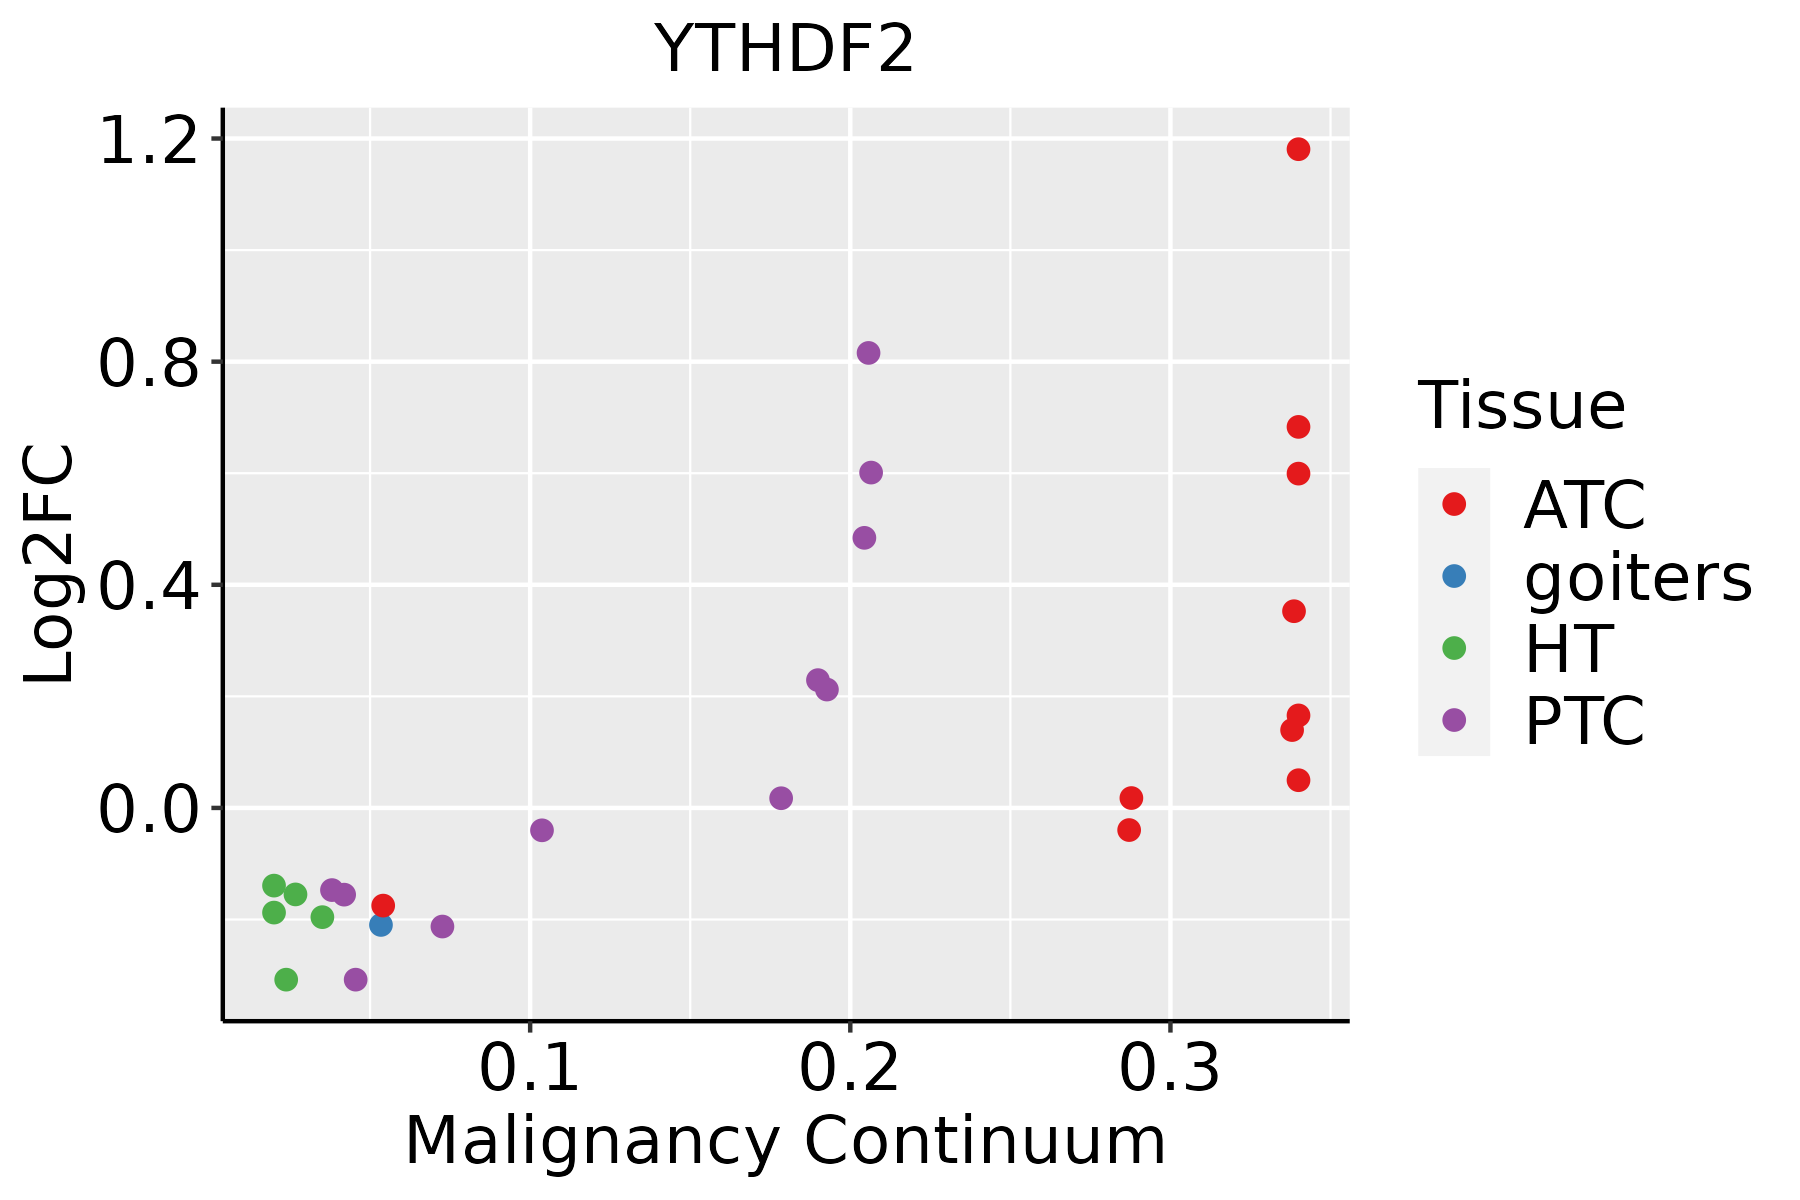 | ATC: Anaplastic thyroid cancer |
| HT: Hashimoto's thyroiditis | ||
| PTC: Papillary thyroid cancer |
| ∗log2FC in expression of this searched gene in stem-like cells from each diseased tissue sample relative to stem-like cells in normal samples in each tissue plotted against the malignancy continuum. Samples are colored based on if they are from different disease stage. |
Top |
Malignant transformation related pathway analysis |
| Find out the enriched GO biological processes and KEGG pathways involved in transition from healthy to precancer to cancer |
| Tissue | Disease Stage | Enriched GO biological Processes |
| Colorectum | AD |  |
| Colorectum | SER |  |
| Colorectum | MSS |  |
| Colorectum | MSI-H |  |
| Colorectum | FAP |  |
| ∗Top 15 enriched GO BP terms are showed in the bar plot of each disease state in each tissue. Each row represents a significant GO biological process which is colored according to the -log10(p.adjust). |
| Page: 1 2 3 4 5 6 7 8 9 |
| GO ID | Tissue | Disease Stage | Description | Gene Ratio | Bg Ratio | pvalue | p.adjust | Count |
| GO:0031331110 | Oral cavity | LP | positive regulation of cellular catabolic process | 163/4623 | 427/18723 | 3.03e-10 | 1.59e-08 | 163 |
| GO:004427017 | Oral cavity | LP | cellular nitrogen compound catabolic process | 170/4623 | 451/18723 | 3.93e-10 | 2.02e-08 | 170 |
| GO:004670016 | Oral cavity | LP | heterocycle catabolic process | 168/4623 | 445/18723 | 4.35e-10 | 2.20e-08 | 168 |
| GO:0006417110 | Oral cavity | LP | regulation of translation | 175/4623 | 468/18723 | 4.49e-10 | 2.22e-08 | 175 |
| GO:0034250110 | Oral cavity | LP | positive regulation of cellular amide metabolic process | 76/4623 | 162/18723 | 6.11e-10 | 2.97e-08 | 76 |
| GO:190136116 | Oral cavity | LP | organic cyclic compound catabolic process | 180/4623 | 495/18723 | 3.11e-09 | 1.35e-07 | 180 |
| GO:000640219 | Oral cavity | LP | mRNA catabolic process | 97/4623 | 232/18723 | 6.51e-09 | 2.65e-07 | 97 |
| GO:003434012 | Oral cavity | LP | response to type I interferon | 34/4623 | 58/18723 | 3.84e-08 | 1.37e-06 | 34 |
| GO:007135712 | Oral cavity | LP | cellular response to type I interferon | 31/4623 | 52/18723 | 8.89e-08 | 2.93e-06 | 31 |
| GO:006033712 | Oral cavity | LP | type I interferon signaling pathway | 30/4623 | 50/18723 | 1.17e-07 | 3.78e-06 | 30 |
| GO:190331315 | Oral cavity | LP | positive regulation of mRNA metabolic process | 51/4623 | 118/18723 | 7.73e-06 | 1.46e-04 | 51 |
| GO:00603381 | Oral cavity | LP | regulation of type I interferon-mediated signaling pathway | 21/4623 | 36/18723 | 1.74e-05 | 2.99e-04 | 21 |
| GO:000283211 | Oral cavity | LP | negative regulation of response to biotic stimulus | 46/4623 | 108/18723 | 3.31e-05 | 5.02e-04 | 46 |
| GO:000195911 | Oral cavity | LP | regulation of cytokine-mediated signaling pathway | 58/4623 | 150/18723 | 1.00e-04 | 1.24e-03 | 58 |
| GO:004508811 | Oral cavity | LP | regulation of innate immune response | 78/4623 | 218/18723 | 1.57e-04 | 1.78e-03 | 78 |
| GO:00603391 | Oral cavity | LP | negative regulation of type I interferon-mediated signaling pathway | 13/4623 | 20/18723 | 1.59e-04 | 1.79e-03 | 13 |
| GO:006075911 | Oral cavity | LP | regulation of response to cytokine stimulus | 61/4623 | 162/18723 | 1.61e-04 | 1.81e-03 | 61 |
| GO:006101317 | Oral cavity | LP | regulation of mRNA catabolic process | 62/4623 | 166/18723 | 1.87e-04 | 2.06e-03 | 62 |
| GO:000283112 | Oral cavity | LP | regulation of response to biotic stimulus | 109/4623 | 327/18723 | 2.45e-04 | 2.60e-03 | 109 |
| GO:004582411 | Oral cavity | LP | negative regulation of innate immune response | 31/4623 | 71/18723 | 3.58e-04 | 3.54e-03 | 31 |
| Page: 1 2 3 4 5 6 7 8 9 10 11 12 13 14 15 16 17 18 19 20 21 22 23 24 25 26 27 28 |
| Pathway ID | Tissue | Disease Stage | Description | Gene Ratio | Bg Ratio | pvalue | p.adjust | qvalue | Count |
| Page: 1 |
Top |
Cell-cell communication analysis |
| Identification of potential cell-cell interactions between two cell types and their ligand-receptor pairs for different disease states |
| Ligand | Receptor | LRpair | Pathway | Tissue | Disease Stage |
| Page: 1 |
Top |
Single-cell gene regulatory network inference analysis |
| Find out the significant the regulons (TFs) and the target genes of each regulon across cell types for different disease states |
| TF | Cell Type | Tissue | Disease Stage | Target Gene | RSS | Regulon Activity |
| ∗The dot plots of a searched regulon are shown for all cell subpopulations in each disease state of each tissue based on the regulon specific score inferred using pySCENIC and by calculating the average expression. |
| Page: 1 |
Top |
Somatic mutation of malignant transformation related genes |
| Annotation of somatic variants for genes involved in malignant transformation |
| Hugo Symbol | Variant Class | Variant Classification | dbSNP RS | HGVSc | HGVSp | HGVSp Short | SWISSPROT | BIOTYPE | SIFT | PolyPhen | Tumor Sample Barcode | Tissue | Histology | Sex | Age | Stage | Therapy Types | Drugs | Outcome |
| YTHDF2 | insertion | Nonsense_Mutation | novel | c.551_552insATGACCTGTGCATGTAGAAACTTGTTTGA | p.Ile185Ter | p.I185* | Q9Y5A9 | protein_coding | TCGA-AO-A0JB-01 | Breast | breast invasive carcinoma | Female | <65 | III/IV | Chemotherapy | cyclophosphamide | SD | ||
| YTHDF2 | SNV | Missense_Mutation | rs528989825 | c.410A>G | p.Asn137Ser | p.N137S | Q9Y5A9 | protein_coding | tolerated(1) | benign(0.003) | TCGA-2W-A8YY-01 | Cervix | cervical & endocervical cancer | Female | <65 | I/II | Chemotherapy | cisplatin | CR |
| YTHDF2 | SNV | Missense_Mutation | novel | c.1608G>T | p.Lys536Asn | p.K536N | Q9Y5A9 | protein_coding | deleterious(0) | probably_damaging(0.997) | TCGA-2W-A8YY-01 | Cervix | cervical & endocervical cancer | Female | <65 | I/II | Chemotherapy | cisplatin | CR |
| YTHDF2 | SNV | Missense_Mutation | c.91N>A | p.Asp31Asn | p.D31N | Q9Y5A9 | protein_coding | tolerated(0.11) | possibly_damaging(0.578) | TCGA-JW-A5VL-01 | Cervix | cervical & endocervical cancer | Female | <65 | I/II | Unknown | Unknown | SD | |
| YTHDF2 | SNV | Missense_Mutation | novel | c.188C>G | p.Ser63Cys | p.S63C | Q9Y5A9 | protein_coding | deleterious(0) | probably_damaging(0.984) | TCGA-VS-A958-01 | Cervix | cervical & endocervical cancer | Female | <65 | I/II | Chemotherapy | cisplatin | CR |
| YTHDF2 | insertion | Frame_Shift_Ins | novel | c.508_509insACGTCGCAGAA | p.Ala170AspfsTer17 | p.A170Dfs*17 | Q9Y5A9 | protein_coding | TCGA-DS-A1OB-01 | Cervix | cervical & endocervical cancer | Female | <65 | I/II | Chemotherapy | carboplatin | PD | ||
| YTHDF2 | SNV | Missense_Mutation | c.1274G>A | p.Arg425His | p.R425H | Q9Y5A9 | protein_coding | deleterious(0.03) | probably_damaging(0.998) | TCGA-A6-5665-01 | Colorectum | colon adenocarcinoma | Female | >=65 | I/II | Unknown | Unknown | PD | |
| YTHDF2 | SNV | Missense_Mutation | c.850G>A | p.Val284Ile | p.V284I | Q9Y5A9 | protein_coding | tolerated(0.11) | benign(0.014) | TCGA-A6-6781-01 | Colorectum | colon adenocarcinoma | Male | <65 | III/IV | Chemotherapy | oxaliplatin | SD | |
| YTHDF2 | SNV | Missense_Mutation | c.1683N>T | p.Glu561Asp | p.E561D | Q9Y5A9 | protein_coding | deleterious(0) | probably_damaging(0.925) | TCGA-AA-A010-01 | Colorectum | colon adenocarcinoma | Female | <65 | I/II | Chemotherapy | folinic | CR | |
| YTHDF2 | SNV | Missense_Mutation | rs775516240 | c.1408G>A | p.Val470Met | p.V470M | Q9Y5A9 | protein_coding | tolerated(0.47) | possibly_damaging(0.902) | TCGA-AD-5900-01 | Colorectum | colon adenocarcinoma | Male | >=65 | I/II | Unknown | Unknown | SD |
| Page: 1 2 3 4 5 6 7 |
Top |
Related drugs of malignant transformation related genes |
| Identification of chemicals and drugs interact with genes involved in malignant transfromation |
| (DGIdb 4.0) |
| Entrez ID | Symbol | Category | Interaction Types | Drug Claim Name | Drug Name | PMIDs |
| Page: 1 |

Copyright 2023-Present -The University of Texas Health Science Center at Houston |