
|
|||||
|
 | |
| |
| |
| |
| |
| |
|
Gene: WASHC2C |
Gene summary for WASHC2C |
| Gene information | Species | Human | Gene symbol | WASHC2C | Gene ID | 253725 |
| Gene name | WASH complex subunit 2C | |
| Gene Alias | FAM21A | |
| Cytomap | 10q11.22 | |
| Gene Type | protein-coding | GO ID | GO:0000902 | UniProtAcc | Q9Y4E1 |
Top |
Malignant transformation analysis |
| Identification of the aberrant gene expression in precancerous and cancerous lesions by comparing the gene expression of stem-like cells in diseased tissues with normal stem cells |
| Entrez ID | Symbol | Replicates | Species | Organ | Tissue | Adj P-value | Log2FC | Malignancy |
| 253725 | WASHC2C | HTA11_347_2000001011 | Human | Colorectum | AD | 1.84e-12 | 5.37e-01 | -0.1954 |
| 253725 | WASHC2C | HTA11_83_2000001011 | Human | Colorectum | SER | 7.50e-07 | 5.94e-01 | -0.1526 |
| 253725 | WASHC2C | HTA11_696_2000001011 | Human | Colorectum | AD | 2.82e-09 | 4.88e-01 | -0.1464 |
| 253725 | WASHC2C | HTA11_866_2000001011 | Human | Colorectum | AD | 4.84e-03 | 2.58e-01 | -0.1001 |
| 253725 | WASHC2C | HTA11_546_2000001011 | Human | Colorectum | AD | 2.84e-06 | 4.96e-01 | -0.0842 |
| 253725 | WASHC2C | HTA11_99999970781_79442 | Human | Colorectum | MSS | 9.55e-09 | -2.31e-01 | 0.294 |
| 253725 | WASHC2C | HTA11_99999971662_82457 | Human | Colorectum | MSS | 9.63e-08 | -2.31e-01 | 0.3859 |
| 253725 | WASHC2C | HTA11_99999974143_84620 | Human | Colorectum | MSS | 9.63e-08 | -2.31e-01 | 0.3005 |
| 253725 | WASHC2C | A015-C-203 | Human | Colorectum | FAP | 3.45e-02 | -1.43e-01 | -0.1294 |
| 253725 | WASHC2C | A002-C-205 | Human | Colorectum | FAP | 3.63e-02 | -1.39e-01 | -0.1236 |
| 253725 | WASHC2C | A015-C-104 | Human | Colorectum | FAP | 3.25e-02 | 2.46e-02 | -0.1899 |
| 253725 | WASHC2C | A002-C-116 | Human | Colorectum | FAP | 8.57e-03 | -1.32e-01 | -0.0452 |
| 253725 | WASHC2C | HCC1 | Human | Liver | HCC | 3.09e-12 | 3.31e+00 | 0.5336 |
| 253725 | WASHC2C | HCC2 | Human | Liver | HCC | 2.19e-22 | 3.05e+00 | 0.5341 |
| 253725 | WASHC2C | HCC5 | Human | Liver | HCC | 1.08e-06 | 1.41e+00 | 0.4932 |
| 253725 | WASHC2C | S014 | Human | Liver | HCC | 3.96e-17 | 5.24e-01 | 0.2254 |
| 253725 | WASHC2C | S015 | Human | Liver | HCC | 1.32e-21 | 6.05e-01 | 0.2375 |
| 253725 | WASHC2C | S016 | Human | Liver | HCC | 1.48e-21 | 5.99e-01 | 0.2243 |
| 253725 | WASHC2C | S027 | Human | Liver | HCC | 5.51e-14 | 6.50e-01 | 0.2446 |
| 253725 | WASHC2C | S028 | Human | Liver | HCC | 1.74e-22 | 7.32e-01 | 0.2503 |
| Page: 1 2 |
| Tissue | Expression Dynamics | Abbreviation |
| Colorectum (GSE201348) | 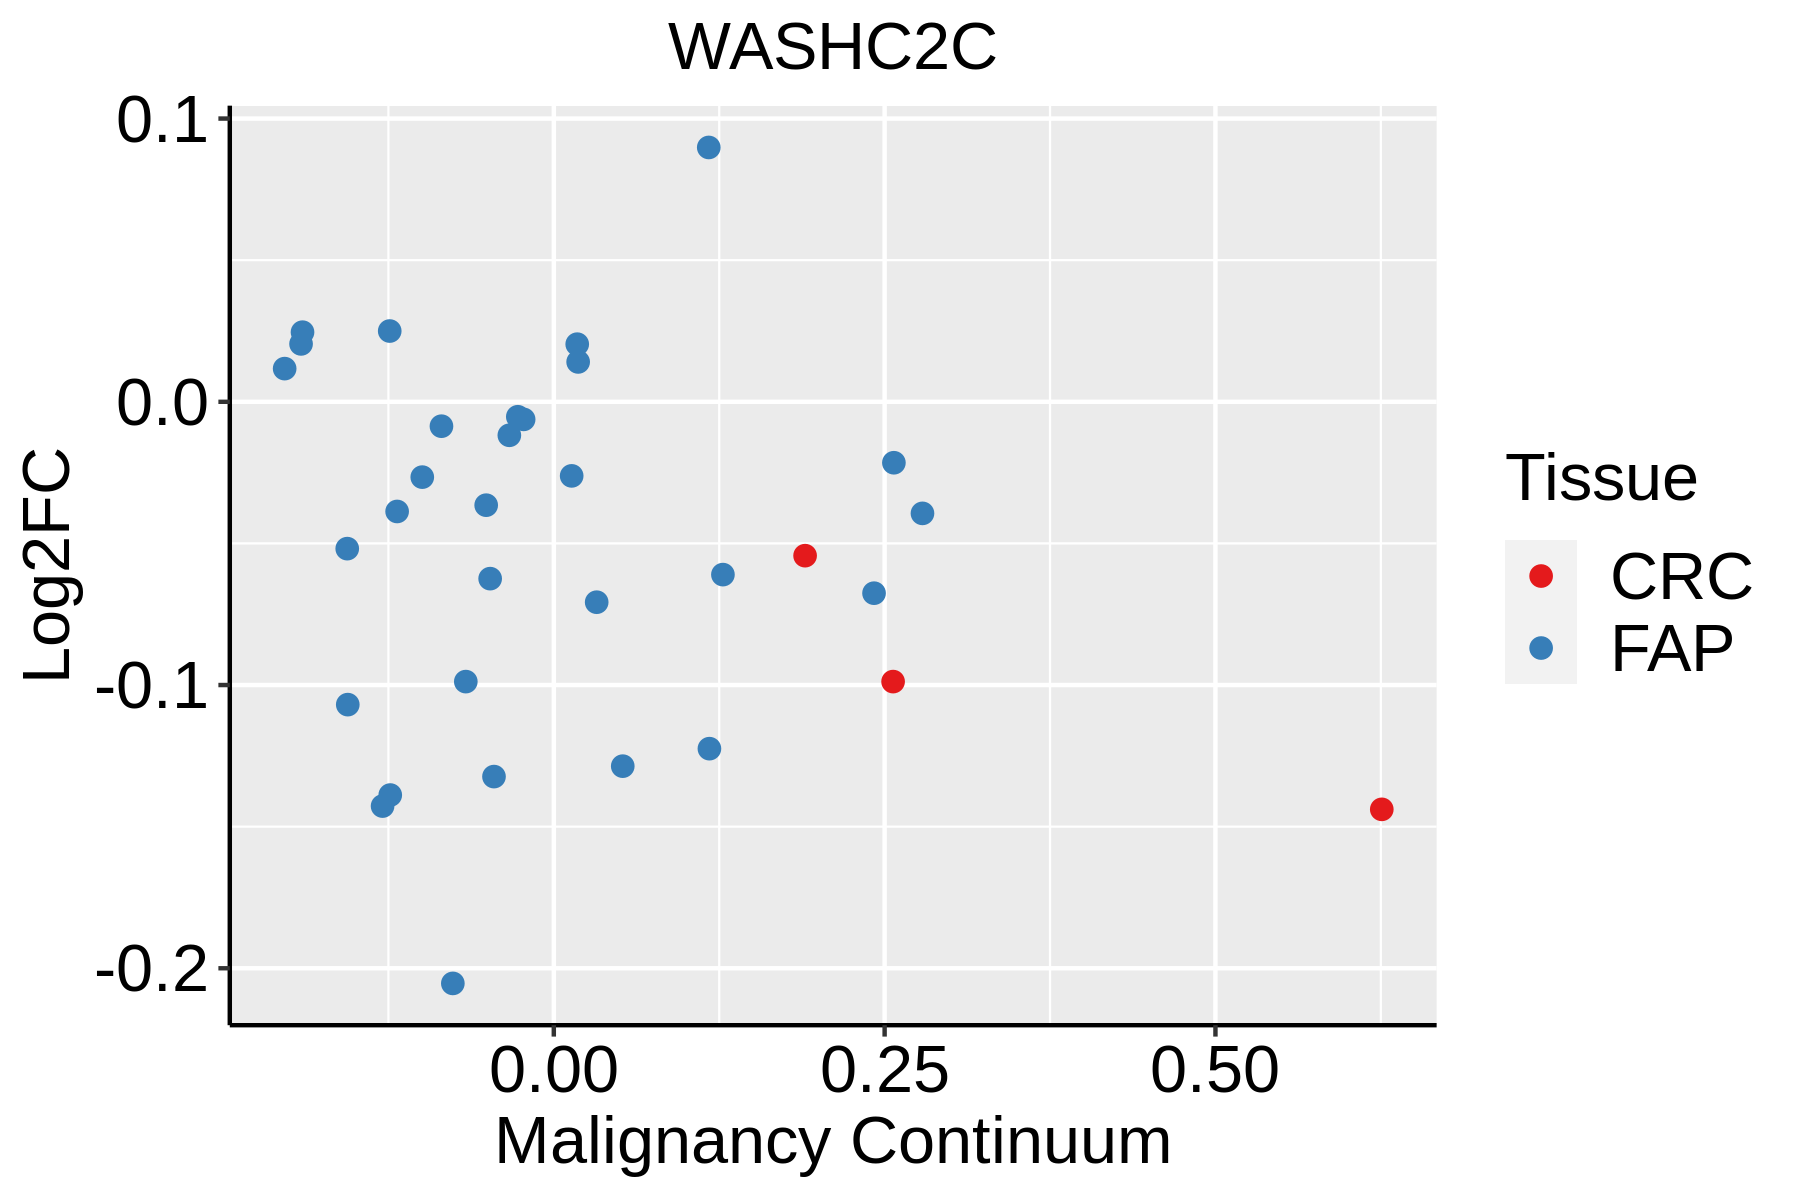 | FAP: Familial adenomatous polyposis |
| CRC: Colorectal cancer | ||
| Colorectum (HTA11) |  | AD: Adenomas |
| SER: Sessile serrated lesions | ||
| MSI-H: Microsatellite-high colorectal cancer | ||
| MSS: Microsatellite stable colorectal cancer | ||
| Liver |  | HCC: Hepatocellular carcinoma |
| NAFLD: Non-alcoholic fatty liver disease |
| ∗log2FC in expression of this searched gene in stem-like cells from each diseased tissue sample relative to stem-like cells in normal samples in each tissue plotted against the malignancy continuum. Samples are colored based on if they are from different disease stage. |
Top |
Malignant transformation related pathway analysis |
| Find out the enriched GO biological processes and KEGG pathways involved in transition from healthy to precancer to cancer |
| Tissue | Disease Stage | Enriched GO biological Processes |
| Colorectum | AD |  |
| Colorectum | SER |  |
| Colorectum | MSS |  |
| Colorectum | MSI-H |  |
| Colorectum | FAP |  |
| ∗Top 15 enriched GO BP terms are showed in the bar plot of each disease state in each tissue. Each row represents a significant GO biological process which is colored according to the -log10(p.adjust). |
| Page: 1 2 3 4 5 6 7 8 9 |
| GO ID | Tissue | Disease Stage | Description | Gene Ratio | Bg Ratio | pvalue | p.adjust | Count |
| GO:003158922 | Liver | HCC | cell-substrate adhesion | 188/7958 | 363/18723 | 2.00e-04 | 1.55e-03 | 188 |
| GO:00360103 | Liver | HCC | protein localization to endosome | 19/7958 | 24/18723 | 2.80e-04 | 2.02e-03 | 19 |
| GO:190290412 | Liver | HCC | negative regulation of supramolecular fiber organization | 90/7958 | 167/18723 | 1.90e-03 | 9.69e-03 | 90 |
| GO:003227212 | Liver | HCC | negative regulation of protein polymerization | 46/7958 | 80/18723 | 4.81e-03 | 2.03e-02 | 46 |
| GO:00432444 | Liver | HCC | regulation of protein-containing complex disassembly | 66/7958 | 121/18723 | 4.94e-03 | 2.07e-02 | 66 |
| GO:005101612 | Liver | HCC | barbed-end actin filament capping | 18/7958 | 26/18723 | 5.37e-03 | 2.24e-02 | 18 |
| GO:00514946 | Liver | HCC | negative regulation of cytoskeleton organization | 84/7958 | 163/18723 | 1.22e-02 | 4.43e-02 | 84 |
| GO:003083712 | Liver | HCC | negative regulation of actin filament polymerization | 37/7958 | 65/18723 | 1.33e-02 | 4.77e-02 | 37 |
| GO:00436242 | Liver | HCC | cellular protein complex disassembly | 71/7958 | 136/18723 | 1.39e-02 | 4.95e-02 | 71 |
| Page: 1 2 3 4 5 6 7 8 9 10 11 12 |
| Pathway ID | Tissue | Disease Stage | Description | Gene Ratio | Bg Ratio | pvalue | p.adjust | qvalue | Count |
| hsa04144 | Colorectum | AD | Endocytosis | 111/2092 | 251/8465 | 5.95e-12 | 1.42e-10 | 9.08e-11 | 111 |
| hsa041441 | Colorectum | AD | Endocytosis | 111/2092 | 251/8465 | 5.95e-12 | 1.42e-10 | 9.08e-11 | 111 |
| hsa041442 | Colorectum | SER | Endocytosis | 81/1580 | 251/8465 | 1.14e-07 | 2.36e-06 | 1.71e-06 | 81 |
| hsa041443 | Colorectum | SER | Endocytosis | 81/1580 | 251/8465 | 1.14e-07 | 2.36e-06 | 1.71e-06 | 81 |
| hsa041444 | Colorectum | MSS | Endocytosis | 102/1875 | 251/8465 | 1.85e-11 | 4.43e-10 | 2.71e-10 | 102 |
| hsa041445 | Colorectum | MSS | Endocytosis | 102/1875 | 251/8465 | 1.85e-11 | 4.43e-10 | 2.71e-10 | 102 |
| hsa041446 | Colorectum | FAP | Endocytosis | 78/1404 | 251/8465 | 6.20e-09 | 2.96e-07 | 1.80e-07 | 78 |
| hsa041447 | Colorectum | FAP | Endocytosis | 78/1404 | 251/8465 | 6.20e-09 | 2.96e-07 | 1.80e-07 | 78 |
| hsa0414422 | Liver | HCC | Endocytosis | 178/4020 | 251/8465 | 2.03e-14 | 5.22e-13 | 2.91e-13 | 178 |
| hsa0414432 | Liver | HCC | Endocytosis | 178/4020 | 251/8465 | 2.03e-14 | 5.22e-13 | 2.91e-13 | 178 |
| Page: 1 |
Top |
Cell-cell communication analysis |
| Identification of potential cell-cell interactions between two cell types and their ligand-receptor pairs for different disease states |
| Ligand | Receptor | LRpair | Pathway | Tissue | Disease Stage |
| Page: 1 |
Top |
Single-cell gene regulatory network inference analysis |
| Find out the significant the regulons (TFs) and the target genes of each regulon across cell types for different disease states |
| TF | Cell Type | Tissue | Disease Stage | Target Gene | RSS | Regulon Activity |
| ∗The dot plots of a searched regulon are shown for all cell subpopulations in each disease state of each tissue based on the regulon specific score inferred using pySCENIC and by calculating the average expression. |
| Page: 1 |
Top |
Somatic mutation of malignant transformation related genes |
| Annotation of somatic variants for genes involved in malignant transformation |
| Hugo Symbol | Variant Class | Variant Classification | dbSNP RS | HGVSc | HGVSp | HGVSp Short | SWISSPROT | BIOTYPE | SIFT | PolyPhen | Tumor Sample Barcode | Tissue | Histology | Sex | Age | Stage | Therapy Types | Drugs | Outcome |
| WASHC2C | SNV | Missense_Mutation | novel | c.605N>A | p.Gly202Glu | p.G202E | protein_coding | deleterious(0) | probably_damaging(1) | TCGA-A2-A0CR-01 | Breast | breast invasive carcinoma | Female | <65 | I/II | Chemotherapy | adriamycin | CR | |
| WASHC2C | SNV | Missense_Mutation | novel | c.459N>G | p.Ile153Met | p.I153M | protein_coding | deleterious(0) | probably_damaging(0.999) | TCGA-A2-A0YH-01 | Breast | breast invasive carcinoma | Female | <65 | III/IV | Chemotherapy | adriamycin | SD | |
| WASHC2C | SNV | Missense_Mutation | c.1825T>A | p.Ser609Thr | p.S609T | protein_coding | tolerated(0.26) | possibly_damaging(0.622) | TCGA-A7-A13D-01 | Breast | breast invasive carcinoma | Female | <65 | I/II | Chemotherapy | cytoxan | SD | ||
| WASHC2C | SNV | Missense_Mutation | c.1996N>A | p.Glu666Lys | p.E666K | protein_coding | deleterious(0.02) | possibly_damaging(0.782) | TCGA-A8-A08L-01 | Breast | breast invasive carcinoma | Female | >=65 | III/IV | Unknown | Unknown | SD | ||
| WASHC2C | SNV | Missense_Mutation | novel | c.3890A>G | p.Asp1297Gly | p.D1297G | protein_coding | deleterious(0) | probably_damaging(1) | TCGA-BH-A18G-01 | Breast | breast invasive carcinoma | Female | >=65 | I/II | Unknown | Unknown | SD | |
| WASHC2C | SNV | Missense_Mutation | novel | c.3529N>C | p.Glu1177Gln | p.E1177Q | protein_coding | deleterious(0.04) | probably_damaging(0.959) | TCGA-D8-A1JA-01 | Breast | breast invasive carcinoma | Female | <65 | III/IV | Chemotherapy | adriamycin | PD | |
| WASHC2C | SNV | Missense_Mutation | novel | c.1634N>T | p.Glu545Val | p.E545V | protein_coding | deleterious(0) | possibly_damaging(0.571) | TCGA-D8-A1JB-01 | Breast | breast invasive carcinoma | Female | <65 | I/II | Chemotherapy | adriamycin | SD | |
| WASHC2C | SNV | Missense_Mutation | rs367973237 | c.919G>A | p.Glu307Lys | p.E307K | protein_coding | tolerated(0.06) | benign(0.044) | TCGA-2W-A8YY-01 | Cervix | cervical & endocervical cancer | Female | <65 | I/II | Chemotherapy | cisplatin | CR | |
| WASHC2C | SNV | Missense_Mutation | novel | c.2537T>C | p.Leu846Pro | p.L846P | protein_coding | deleterious(0) | probably_damaging(1) | TCGA-2W-A8YY-01 | Cervix | cervical & endocervical cancer | Female | <65 | I/II | Chemotherapy | cisplatin | CR | |
| WASHC2C | SNV | Missense_Mutation | novel | c.2039N>C | p.Ser680Thr | p.S680T | protein_coding | deleterious(0) | probably_damaging(0.986) | TCGA-C5-A1M6-01 | Cervix | cervical & endocervical cancer | Female | <65 | I/II | Chemotherapy | cisplatin | PD |
| Page: 1 2 3 4 5 6 7 8 9 10 11 12 13 |
Top |
Related drugs of malignant transformation related genes |
| Identification of chemicals and drugs interact with genes involved in malignant transfromation |
| (DGIdb 4.0) |
| Entrez ID | Symbol | Category | Interaction Types | Drug Claim Name | Drug Name | PMIDs |
| Page: 1 |

Copyright 2023-Present -The University of Texas Health Science Center at Houston |