| Tissue | Expression Dynamics | Abbreviation |
| Cervix | 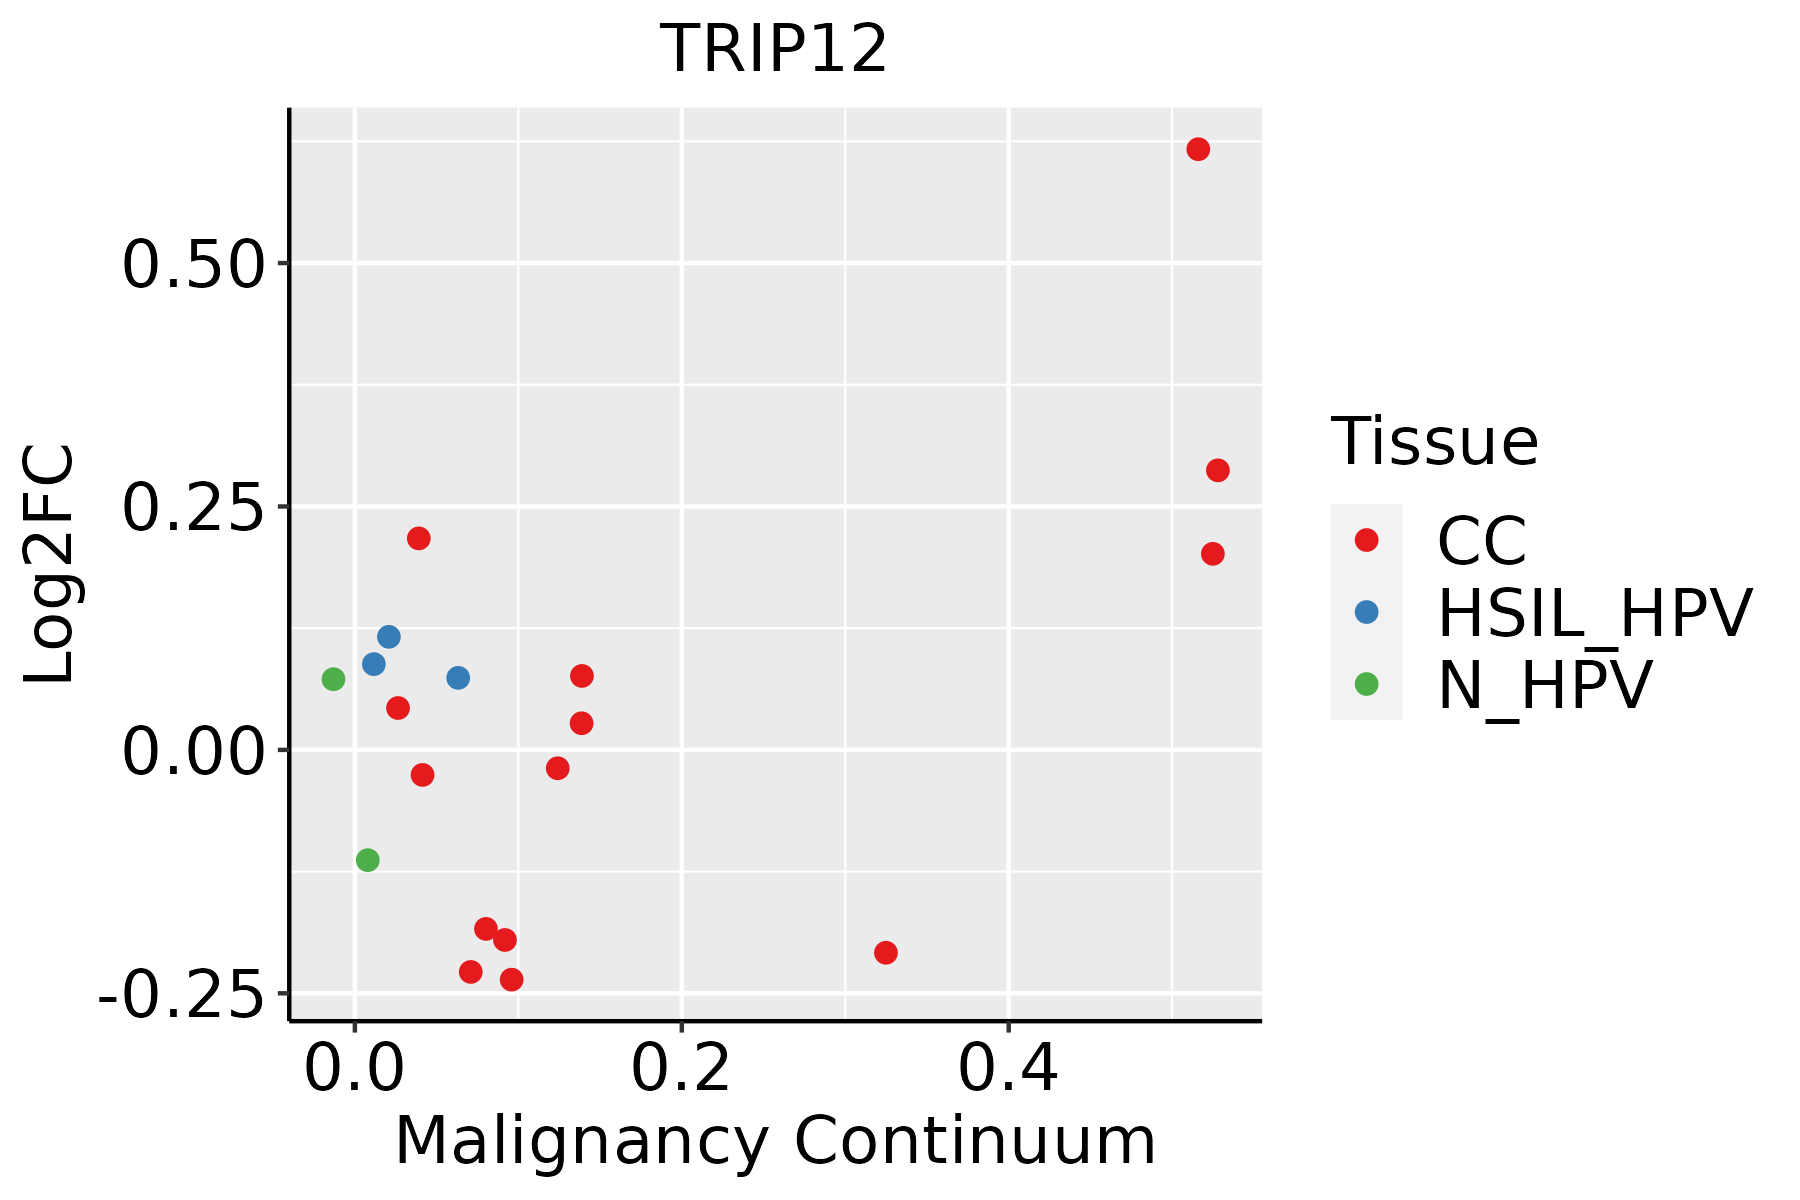 | CC: Cervix cancer |
| HSIL_HPV: HPV-infected high-grade squamous intraepithelial lesions |
| N_HPV: HPV-infected normal cervix |
| Colorectum (GSE201348) | 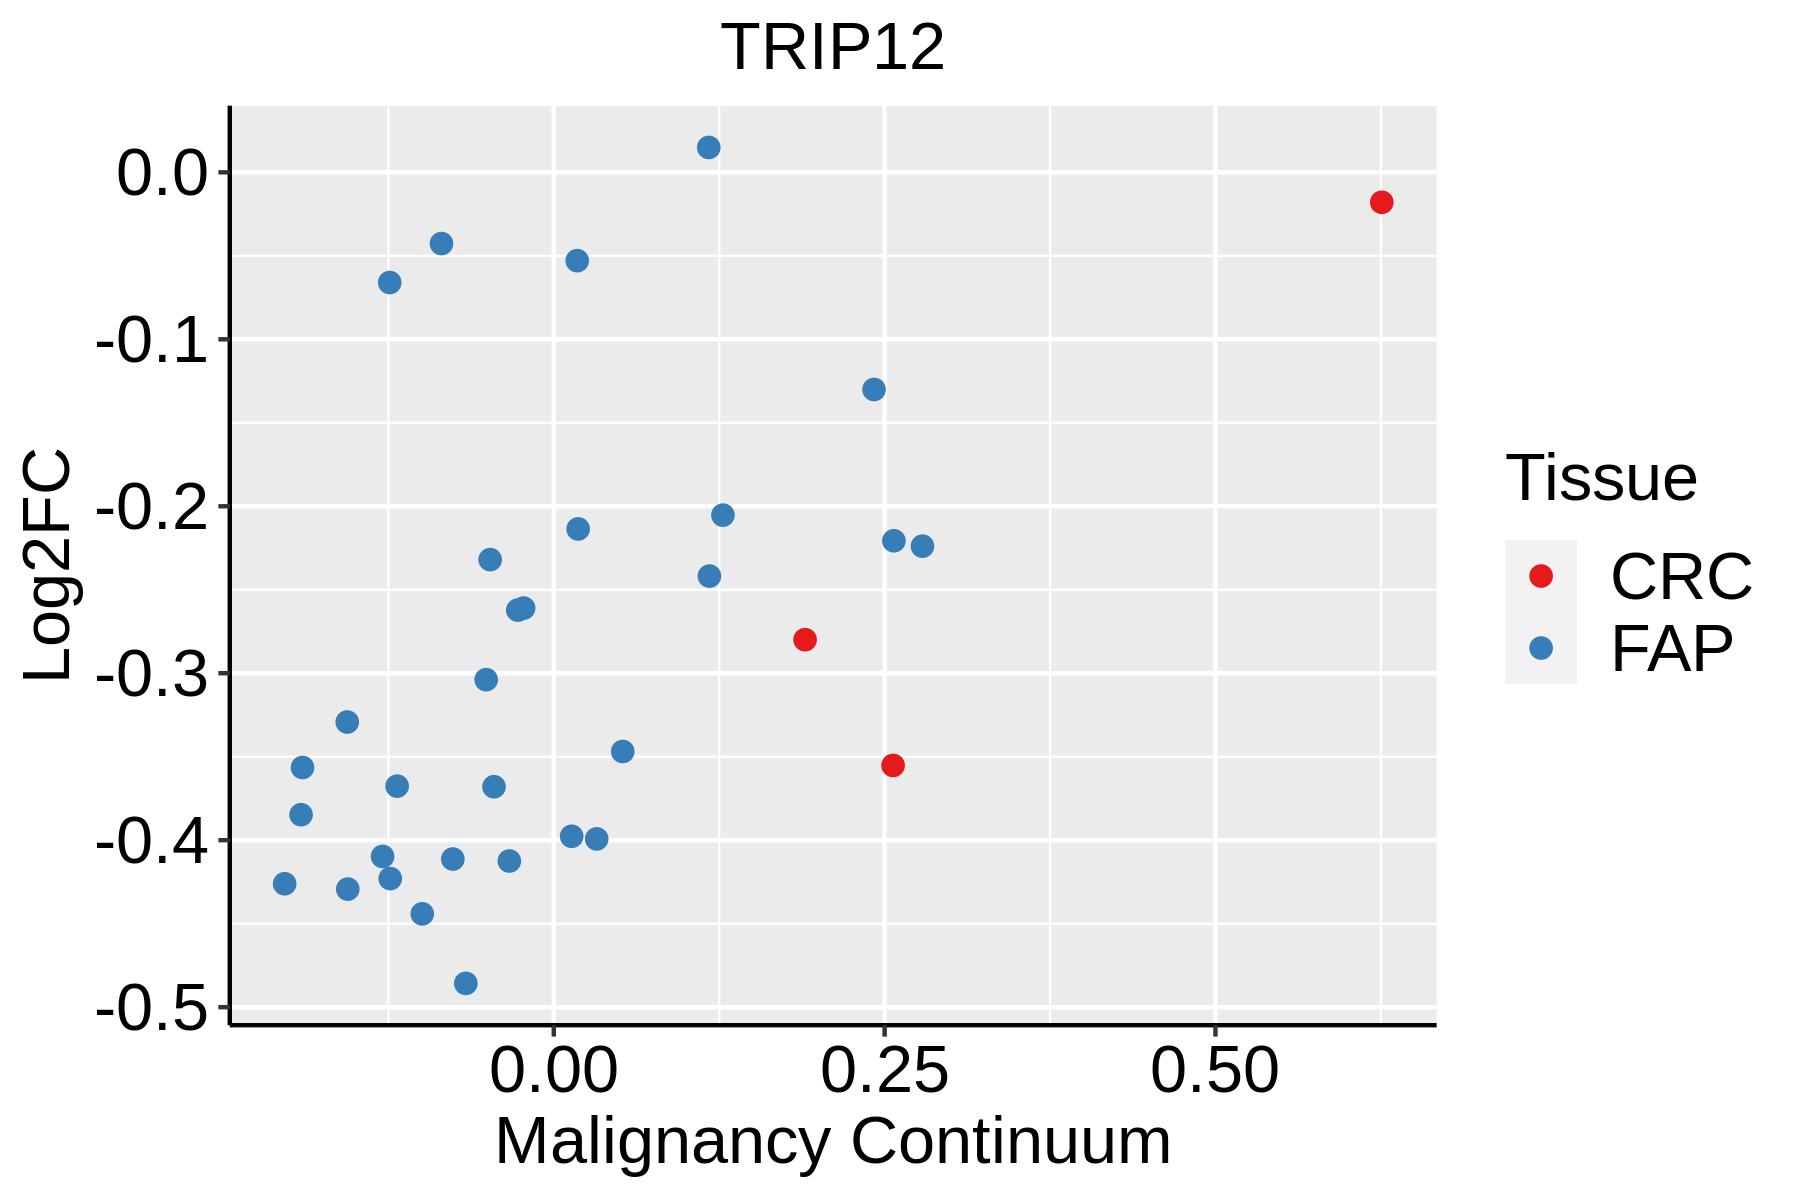 | FAP: Familial adenomatous polyposis |
| CRC: Colorectal cancer |
| Colorectum (HTA11) | 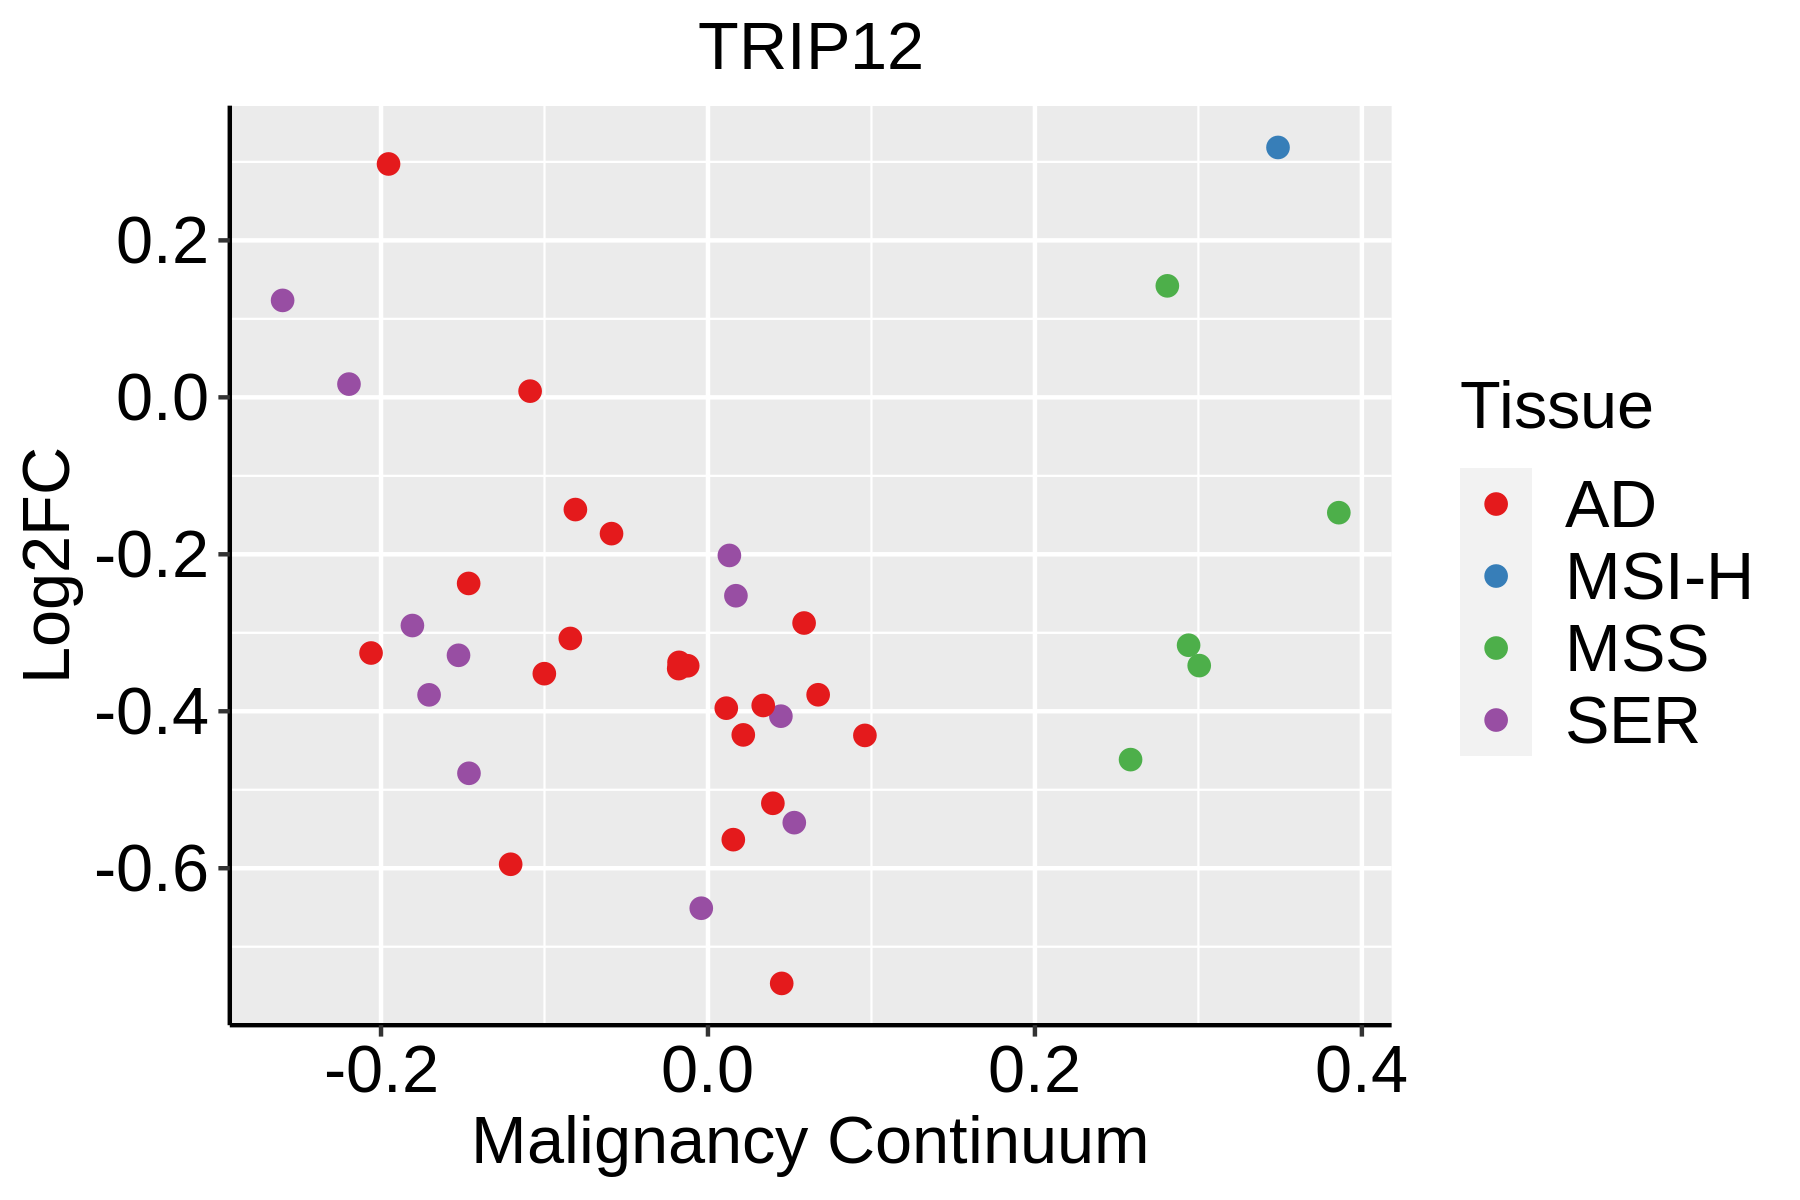 | AD: Adenomas |
| SER: Sessile serrated lesions |
| MSI-H: Microsatellite-high colorectal cancer |
| MSS: Microsatellite stable colorectal cancer |
| Esophagus |  | ESCC: Esophageal squamous cell carcinoma |
| HGIN: High-grade intraepithelial neoplasias |
| LGIN: Low-grade intraepithelial neoplasias |
| Liver |  | HCC: Hepatocellular carcinoma |
| NAFLD: Non-alcoholic fatty liver disease |
| Lung | 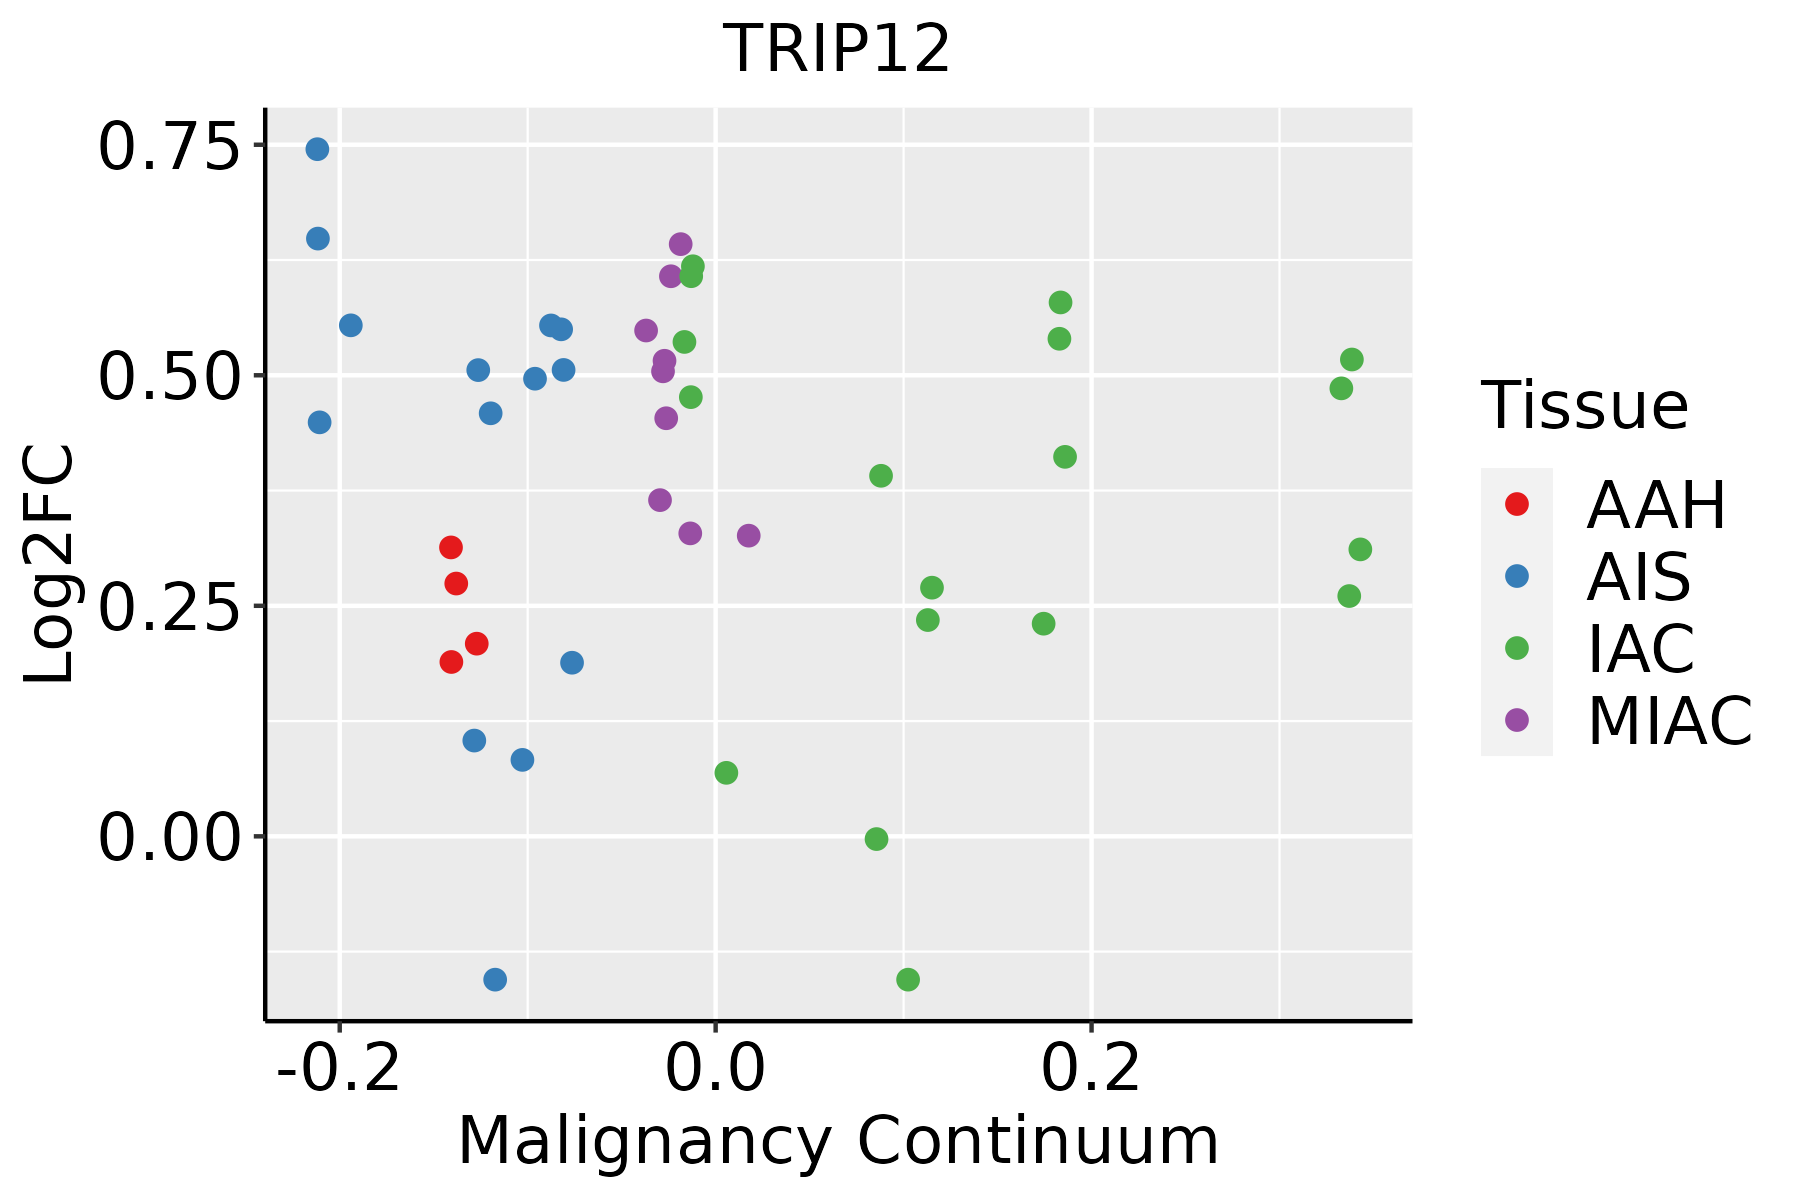 | AAH: Atypical adenomatous hyperplasia |
| AIS: Adenocarcinoma in situ |
| IAC: Invasive lung adenocarcinoma |
| MIA: Minimally invasive adenocarcinoma |
| Oral Cavity | 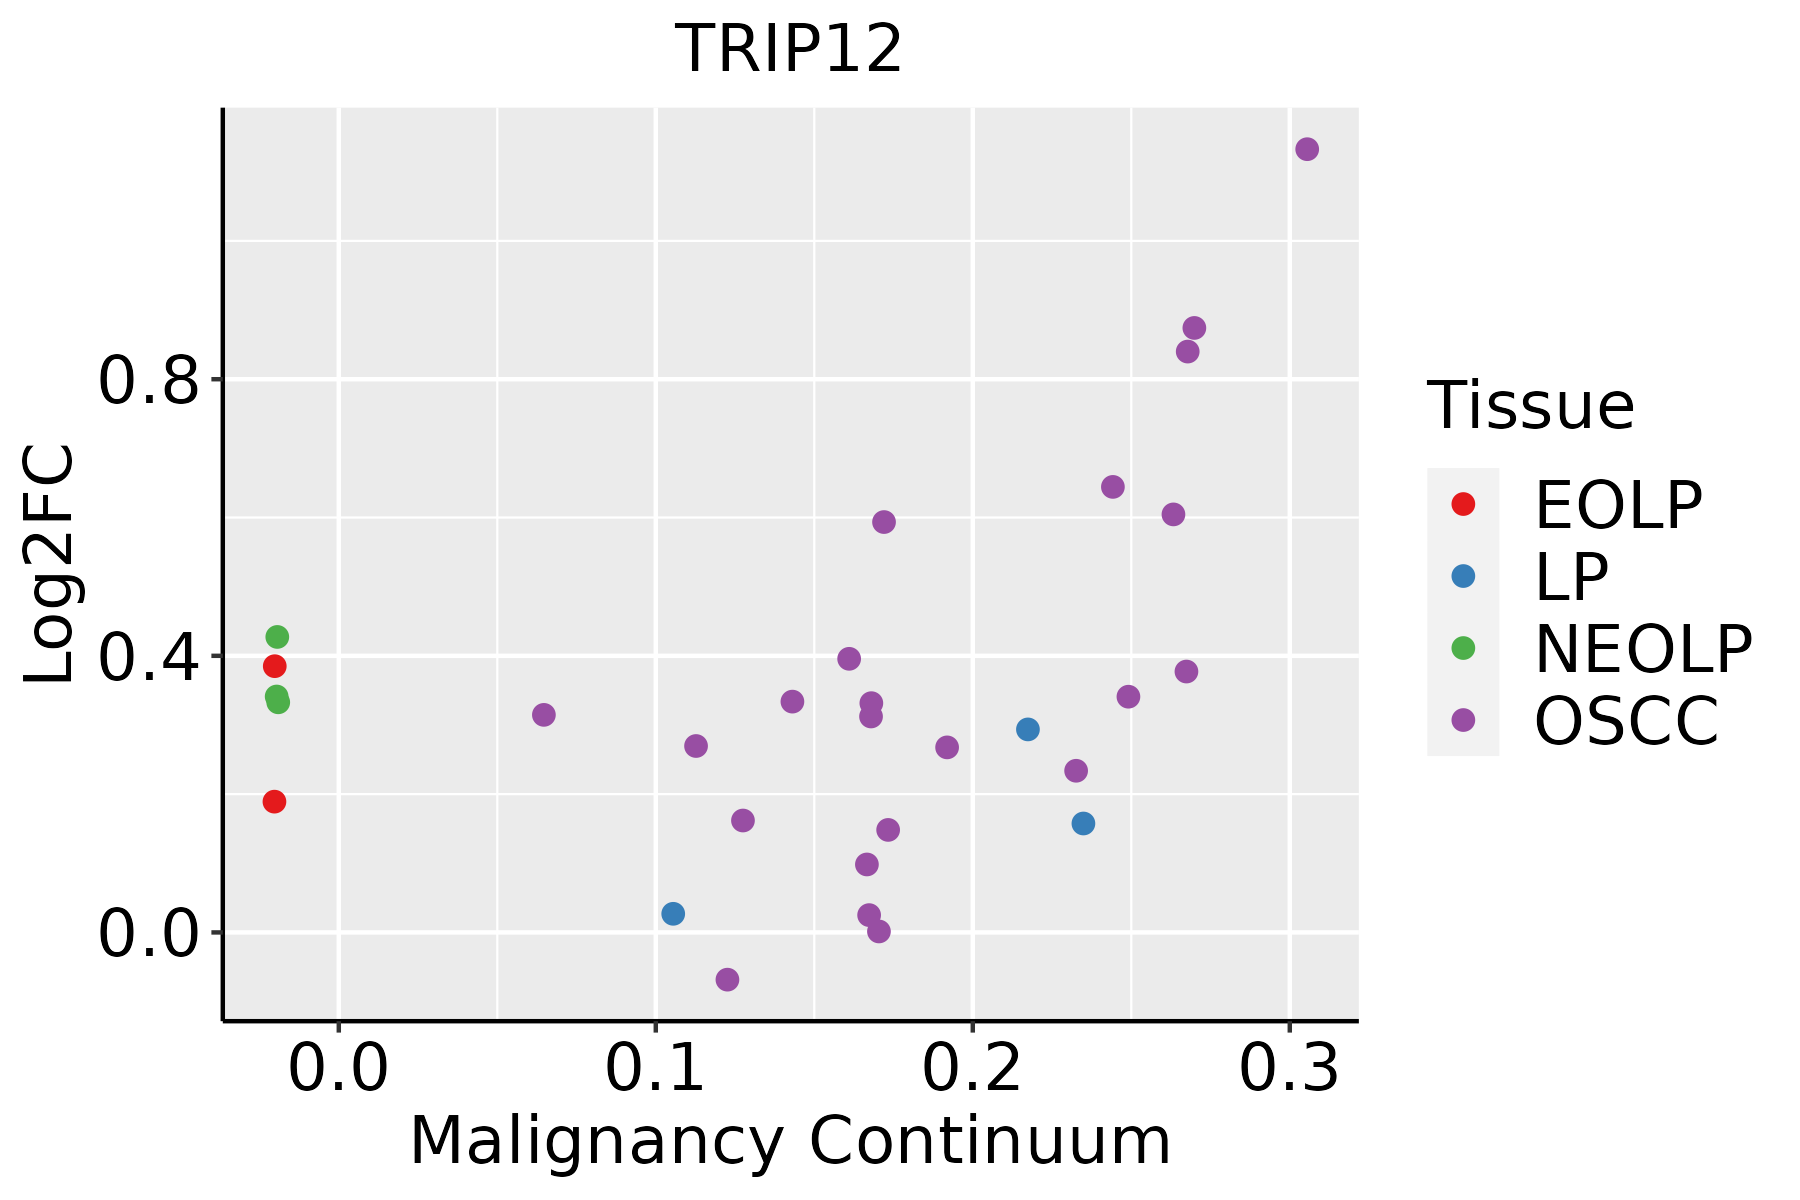 | EOLP: Erosive Oral lichen planus |
| LP: leukoplakia |
| NEOLP: Non-erosive oral lichen planus |
| OSCC: Oral squamous cell carcinoma |
| Prostate | 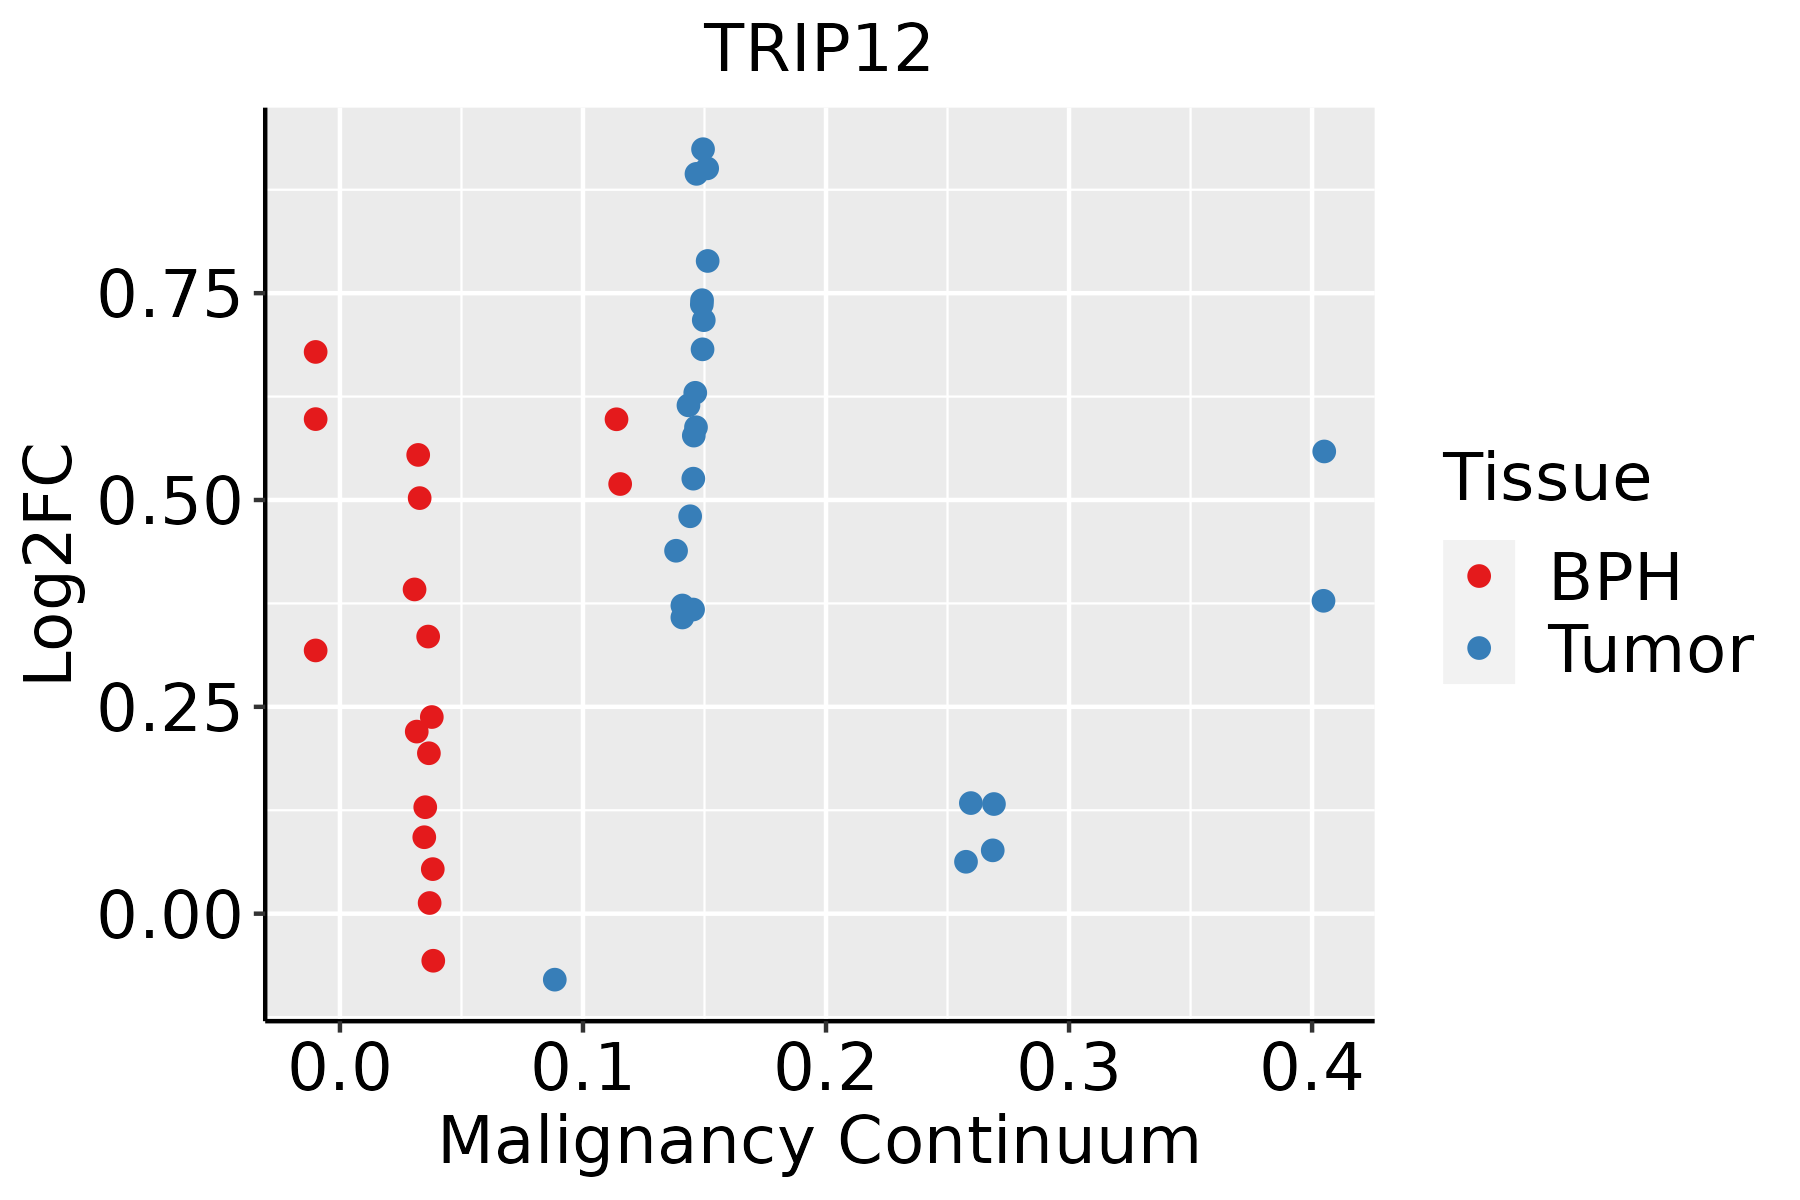 | BPH: Benign Prostatic Hyperplasia |
| Skin | 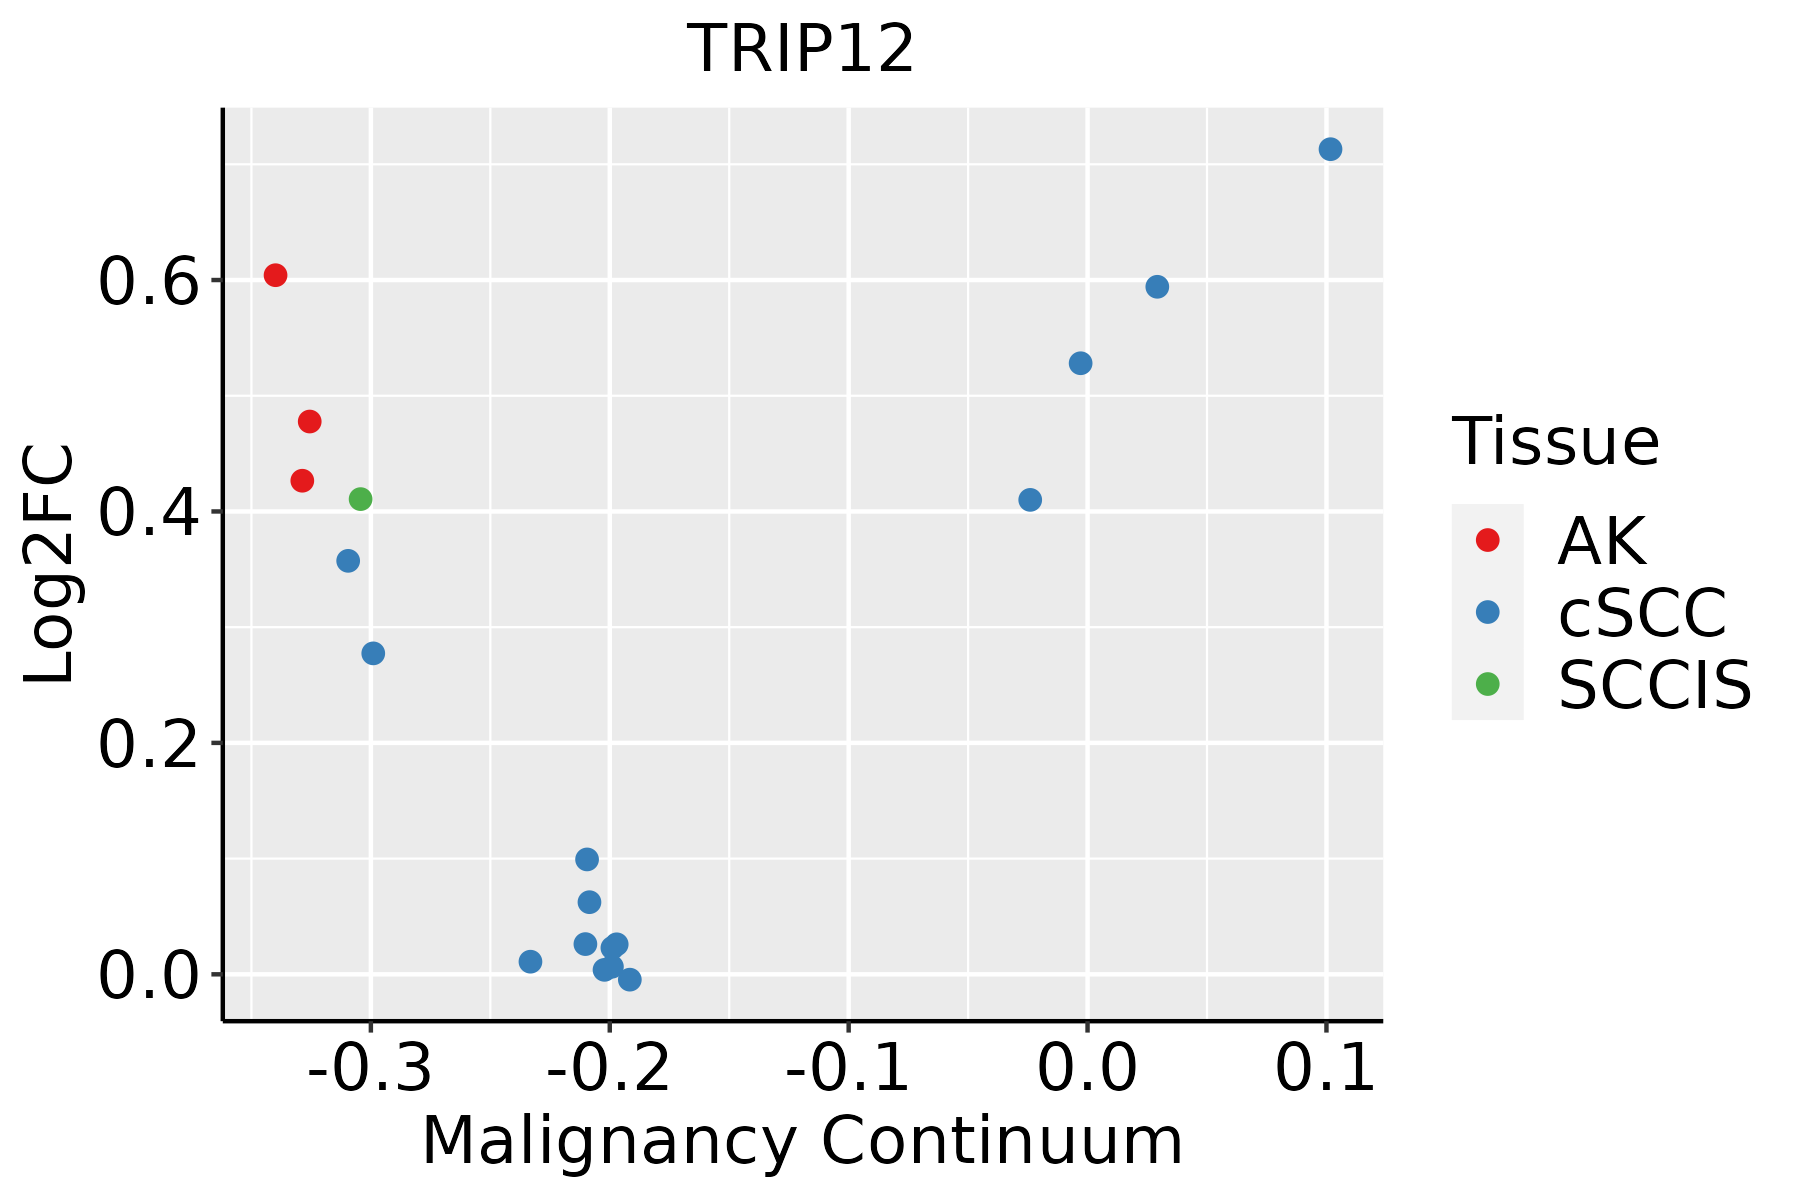 | AK: Actinic keratosis |
| cSCC: Cutaneous squamous cell carcinoma |
| SCCIS:squamous cell carcinoma in situ |
| Thyroid |  | ATC: Anaplastic thyroid cancer |
| HT: Hashimoto's thyroiditis |
| PTC: Papillary thyroid cancer |
| GO ID | Tissue | Disease Stage | Description | Gene Ratio | Bg Ratio | pvalue | p.adjust | Count |
| GO:001657431 | Oral cavity | NEOLP | histone ubiquitination | 16/2005 | 47/18723 | 1.65e-05 | 2.83e-04 | 16 |
| GO:003105631 | Oral cavity | NEOLP | regulation of histone modification | 34/2005 | 152/18723 | 2.31e-05 | 3.72e-04 | 34 |
| GO:005105231 | Oral cavity | NEOLP | regulation of DNA metabolic process | 63/2005 | 359/18723 | 5.48e-05 | 7.44e-04 | 63 |
| GO:200102031 | Oral cavity | NEOLP | regulation of response to DNA damage stimulus | 43/2005 | 219/18723 | 6.13e-05 | 8.19e-04 | 43 |
| GO:004599513 | Oral cavity | NEOLP | regulation of embryonic development | 18/2005 | 64/18723 | 9.10e-05 | 1.12e-03 | 18 |
| GO:007053421 | Oral cavity | NEOLP | protein K63-linked ubiquitination | 16/2005 | 56/18723 | 1.80e-04 | 1.97e-03 | 16 |
| GO:003352221 | Oral cavity | NEOLP | histone H2A ubiquitination | 10/2005 | 26/18723 | 2.04e-04 | 2.19e-03 | 10 |
| GO:200102121 | Oral cavity | NEOLP | negative regulation of response to DNA damage stimulus | 20/2005 | 81/18723 | 2.69e-04 | 2.71e-03 | 20 |
| GO:00310572 | Oral cavity | NEOLP | negative regulation of histone modification | 12/2005 | 46/18723 | 2.66e-03 | 1.66e-02 | 12 |
| GO:1902915 | Oral cavity | NEOLP | negative regulation of protein polyubiquitination | 5/2005 | 11/18723 | 3.72e-03 | 2.15e-02 | 5 |
| GO:19029141 | Oral cavity | NEOLP | regulation of protein polyubiquitination | 8/2005 | 27/18723 | 5.85e-03 | 3.05e-02 | 8 |
| GO:1900044 | Oral cavity | NEOLP | regulation of protein K63-linked ubiquitination | 5/2005 | 13/18723 | 8.62e-03 | 4.15e-02 | 5 |
| GO:190332018 | Prostate | BPH | regulation of protein modification by small protein conjugation or removal | 90/3107 | 242/18723 | 7.37e-15 | 1.01e-12 | 90 |
| GO:003139618 | Prostate | BPH | regulation of protein ubiquitination | 74/3107 | 210/18723 | 3.66e-11 | 2.39e-09 | 74 |
| GO:190332118 | Prostate | BPH | negative regulation of protein modification by small protein conjugation or removal | 37/3107 | 95/18723 | 1.54e-07 | 3.54e-06 | 37 |
| GO:00165706 | Prostate | BPH | histone modification | 120/3107 | 463/18723 | 1.73e-07 | 3.89e-06 | 120 |
| GO:003139718 | Prostate | BPH | negative regulation of protein ubiquitination | 33/3107 | 83/18723 | 4.07e-07 | 8.42e-06 | 33 |
| GO:00002099 | Prostate | BPH | protein polyubiquitination | 64/3107 | 236/18723 | 2.83e-05 | 3.31e-04 | 64 |
| GO:200102015 | Prostate | BPH | regulation of response to DNA damage stimulus | 60/3107 | 219/18723 | 3.58e-05 | 3.92e-04 | 60 |
| GO:00510529 | Prostate | BPH | regulation of DNA metabolic process | 89/3107 | 359/18723 | 4.07e-05 | 4.36e-04 | 89 |
| Pathway ID | Tissue | Disease Stage | Description | Gene Ratio | Bg Ratio | pvalue | p.adjust | qvalue | Count |
| hsa0412014 | Cervix | CC | Ubiquitin mediated proteolysis | 49/1267 | 142/8465 | 4.26e-09 | 7.68e-08 | 4.54e-08 | 49 |
| hsa0412015 | Cervix | CC | Ubiquitin mediated proteolysis | 49/1267 | 142/8465 | 4.26e-09 | 7.68e-08 | 4.54e-08 | 49 |
| hsa04120 | Colorectum | AD | Ubiquitin mediated proteolysis | 58/2092 | 142/8465 | 1.46e-05 | 1.53e-04 | 9.76e-05 | 58 |
| hsa041201 | Colorectum | AD | Ubiquitin mediated proteolysis | 58/2092 | 142/8465 | 1.46e-05 | 1.53e-04 | 9.76e-05 | 58 |
| hsa041202 | Colorectum | SER | Ubiquitin mediated proteolysis | 39/1580 | 142/8465 | 6.18e-03 | 3.66e-02 | 2.66e-02 | 39 |
| hsa041203 | Colorectum | SER | Ubiquitin mediated proteolysis | 39/1580 | 142/8465 | 6.18e-03 | 3.66e-02 | 2.66e-02 | 39 |
| hsa041204 | Colorectum | MSS | Ubiquitin mediated proteolysis | 55/1875 | 142/8465 | 5.02e-06 | 6.00e-05 | 3.68e-05 | 55 |
| hsa041205 | Colorectum | MSS | Ubiquitin mediated proteolysis | 55/1875 | 142/8465 | 5.02e-06 | 6.00e-05 | 3.68e-05 | 55 |
| hsa041206 | Colorectum | FAP | Ubiquitin mediated proteolysis | 51/1404 | 142/8465 | 1.55e-08 | 5.84e-07 | 3.55e-07 | 51 |
| hsa041207 | Colorectum | FAP | Ubiquitin mediated proteolysis | 51/1404 | 142/8465 | 1.55e-08 | 5.84e-07 | 3.55e-07 | 51 |
| hsa041208 | Colorectum | CRC | Ubiquitin mediated proteolysis | 42/1091 | 142/8465 | 9.98e-08 | 6.67e-06 | 4.52e-06 | 42 |
| hsa041209 | Colorectum | CRC | Ubiquitin mediated proteolysis | 42/1091 | 142/8465 | 9.98e-08 | 6.67e-06 | 4.52e-06 | 42 |
| hsa0412026 | Esophagus | HGIN | Ubiquitin mediated proteolysis | 49/1383 | 142/8465 | 7.78e-08 | 1.33e-06 | 1.06e-06 | 49 |
| hsa04120111 | Esophagus | HGIN | Ubiquitin mediated proteolysis | 49/1383 | 142/8465 | 7.78e-08 | 1.33e-06 | 1.06e-06 | 49 |
| hsa0412027 | Esophagus | ESCC | Ubiquitin mediated proteolysis | 122/4205 | 142/8465 | 6.53e-20 | 7.29e-18 | 3.74e-18 | 122 |
| hsa0412036 | Esophagus | ESCC | Ubiquitin mediated proteolysis | 122/4205 | 142/8465 | 6.53e-20 | 7.29e-18 | 3.74e-18 | 122 |
| hsa0412010 | Liver | NAFLD | Ubiquitin mediated proteolysis | 44/1043 | 142/8465 | 2.59e-09 | 1.70e-07 | 1.37e-07 | 44 |
| hsa0412011 | Liver | NAFLD | Ubiquitin mediated proteolysis | 44/1043 | 142/8465 | 2.59e-09 | 1.70e-07 | 1.37e-07 | 44 |
| hsa0412021 | Liver | Cirrhotic | Ubiquitin mediated proteolysis | 72/2530 | 142/8465 | 1.32e-07 | 1.97e-06 | 1.21e-06 | 72 |
| hsa0412031 | Liver | Cirrhotic | Ubiquitin mediated proteolysis | 72/2530 | 142/8465 | 1.32e-07 | 1.97e-06 | 1.21e-06 | 72 |
| Hugo Symbol | Variant Class | Variant Classification | dbSNP RS | HGVSc | HGVSp | HGVSp Short | SWISSPROT | BIOTYPE | SIFT | PolyPhen | Tumor Sample Barcode | Tissue | Histology | Sex | Age | Stage | Therapy Types | Drugs | Outcome |
| TRIP12 | SNV | Missense_Mutation | | c.4696G>C | p.Asp1566His | p.D1566H | Q14669 | protein_coding | deleterious(0) | probably_damaging(0.996) | TCGA-A8-A08R-01 | Breast | breast invasive carcinoma | Female | <65 | I/II | Unknown | Unknown | SD |
| TRIP12 | SNV | Missense_Mutation | | c.4291N>T | p.Pro1431Ser | p.P1431S | Q14669 | protein_coding | deleterious(0.03) | probably_damaging(0.939) | TCGA-A8-A09M-01 | Breast | breast invasive carcinoma | Female | >=65 | III/IV | Chemotherapy | paclitaxel | CR |
| TRIP12 | SNV | Missense_Mutation | | c.808N>A | p.Gln270Lys | p.Q270K | Q14669 | protein_coding | deleterious_low_confidence(0.02) | possibly_damaging(0.696) | TCGA-AC-A23H-01 | Breast | breast invasive carcinoma | Female | >=65 | I/II | Unknown | Unknown | PD |
| TRIP12 | SNV | Missense_Mutation | novel | c.5551N>A | p.Glu1851Lys | p.E1851K | Q14669 | protein_coding | deleterious(0) | probably_damaging(0.983) | TCGA-AN-A046-01 | Breast | breast invasive carcinoma | Female | >=65 | I/II | Unknown | Unknown | SD |
| TRIP12 | SNV | Missense_Mutation | novel | c.4592N>A | p.Arg1531Gln | p.R1531Q | Q14669 | protein_coding | deleterious(0.02) | probably_damaging(0.945) | TCGA-AN-A046-01 | Breast | breast invasive carcinoma | Female | >=65 | I/II | Unknown | Unknown | SD |
| TRIP12 | SNV | Missense_Mutation | novel | c.80N>C | p.Asp27Ala | p.D27A | Q14669 | protein_coding | deleterious_low_confidence(0.01) | benign(0.091) | TCGA-AN-A046-01 | Breast | breast invasive carcinoma | Female | >=65 | I/II | Unknown | Unknown | SD |
| TRIP12 | SNV | Missense_Mutation | | c.1855N>A | p.Glu619Lys | p.E619K | Q14669 | protein_coding | deleterious(0) | benign(0.001) | TCGA-AN-A0FK-01 | Breast | breast invasive carcinoma | Female | >=65 | III/IV | Unknown | Unknown | SD |
| TRIP12 | SNV | Missense_Mutation | | c.3370N>A | p.Ala1124Thr | p.A1124T | Q14669 | protein_coding | tolerated(0.15) | benign(0.1) | TCGA-BH-A0HF-01 | Breast | breast invasive carcinoma | Female | >=65 | I/II | Hormone Therapy | arimidex | SD |
| TRIP12 | SNV | Missense_Mutation | rs373429636 | c.2426N>T | p.Ala809Val | p.A809V | Q14669 | protein_coding | tolerated(0.51) | possibly_damaging(0.868) | TCGA-D8-A1XQ-01 | Breast | breast invasive carcinoma | Female | >=65 | I/II | Unknown | Unknown | SD |
| TRIP12 | insertion | Frame_Shift_Ins | novel | c.5557_5558insGAATGGAAGAAGA | p.Lys1853ArgfsTer32 | p.K1853Rfs*32 | Q14669 | protein_coding | | | TCGA-AN-A0AL-01 | Breast | breast invasive carcinoma | Female | <65 | III/IV | Unknown | Unknown | SD |


