
|
|||||
|
 | |
| |
| |
| |
| |
| |
|
Gene: TRIM44 |
Gene summary for TRIM44 |
| Gene information | Species | Human | Gene symbol | TRIM44 | Gene ID | 54765 |
| Gene name | tripartite motif containing 44 | |
| Gene Alias | AN3 | |
| Cytomap | 11p13 | |
| Gene Type | protein-coding | GO ID | GO:0000209 | UniProtAcc | Q96DX7 |
Top |
Malignant transformation analysis |
| Identification of the aberrant gene expression in precancerous and cancerous lesions by comparing the gene expression of stem-like cells in diseased tissues with normal stem cells |
| Entrez ID | Symbol | Replicates | Species | Organ | Tissue | Adj P-value | Log2FC | Malignancy |
| 54765 | TRIM44 | HTA11_99999974143_84620 | Human | Colorectum | MSS | 2.23e-03 | -2.27e-01 | 0.3005 |
| 54765 | TRIM44 | A015-C-203 | Human | Colorectum | FAP | 1.47e-26 | -2.67e-01 | -0.1294 |
| 54765 | TRIM44 | A002-C-201 | Human | Colorectum | FAP | 6.86e-07 | -2.35e-01 | 0.0324 |
| 54765 | TRIM44 | A002-C-203 | Human | Colorectum | FAP | 3.19e-03 | -3.52e-02 | 0.2786 |
| 54765 | TRIM44 | A001-C-108 | Human | Colorectum | FAP | 5.31e-16 | -9.39e-02 | -0.0272 |
| 54765 | TRIM44 | A002-C-205 | Human | Colorectum | FAP | 1.40e-12 | -1.79e-01 | -0.1236 |
| 54765 | TRIM44 | A015-C-006 | Human | Colorectum | FAP | 1.92e-08 | -4.53e-02 | -0.0994 |
| 54765 | TRIM44 | A015-C-106 | Human | Colorectum | FAP | 1.55e-07 | -1.11e-01 | -0.0511 |
| 54765 | TRIM44 | A002-C-114 | Human | Colorectum | FAP | 2.07e-10 | -1.76e-01 | -0.1561 |
| 54765 | TRIM44 | A015-C-104 | Human | Colorectum | FAP | 1.70e-24 | -1.22e-01 | -0.1899 |
| 54765 | TRIM44 | A001-C-014 | Human | Colorectum | FAP | 1.38e-10 | -2.03e-01 | 0.0135 |
| 54765 | TRIM44 | A002-C-016 | Human | Colorectum | FAP | 3.34e-14 | -2.17e-01 | 0.0521 |
| 54765 | TRIM44 | A015-C-002 | Human | Colorectum | FAP | 9.57e-06 | -2.46e-01 | -0.0763 |
| 54765 | TRIM44 | A001-C-203 | Human | Colorectum | FAP | 2.75e-04 | -5.66e-02 | -0.0481 |
| 54765 | TRIM44 | A002-C-116 | Human | Colorectum | FAP | 6.10e-25 | -3.19e-01 | -0.0452 |
| 54765 | TRIM44 | A014-C-008 | Human | Colorectum | FAP | 1.98e-05 | -2.51e-01 | -0.191 |
| 54765 | TRIM44 | A018-E-020 | Human | Colorectum | FAP | 6.66e-12 | -1.29e-01 | -0.2034 |
| 54765 | TRIM44 | F034 | Human | Colorectum | FAP | 1.08e-16 | -1.11e-01 | -0.0665 |
| 54765 | TRIM44 | F072B | Human | Colorectum | FAP | 2.06e-06 | -1.66e-01 | 0.257 |
| 54765 | TRIM44 | CRC-1-8810 | Human | Colorectum | CRC | 1.51e-02 | -6.78e-02 | 0.6257 |
| Page: 1 2 3 4 5 6 7 8 |
| Tissue | Expression Dynamics | Abbreviation |
| Colorectum (GSE201348) |  | FAP: Familial adenomatous polyposis |
| CRC: Colorectal cancer | ||
| Colorectum (HTA11) | 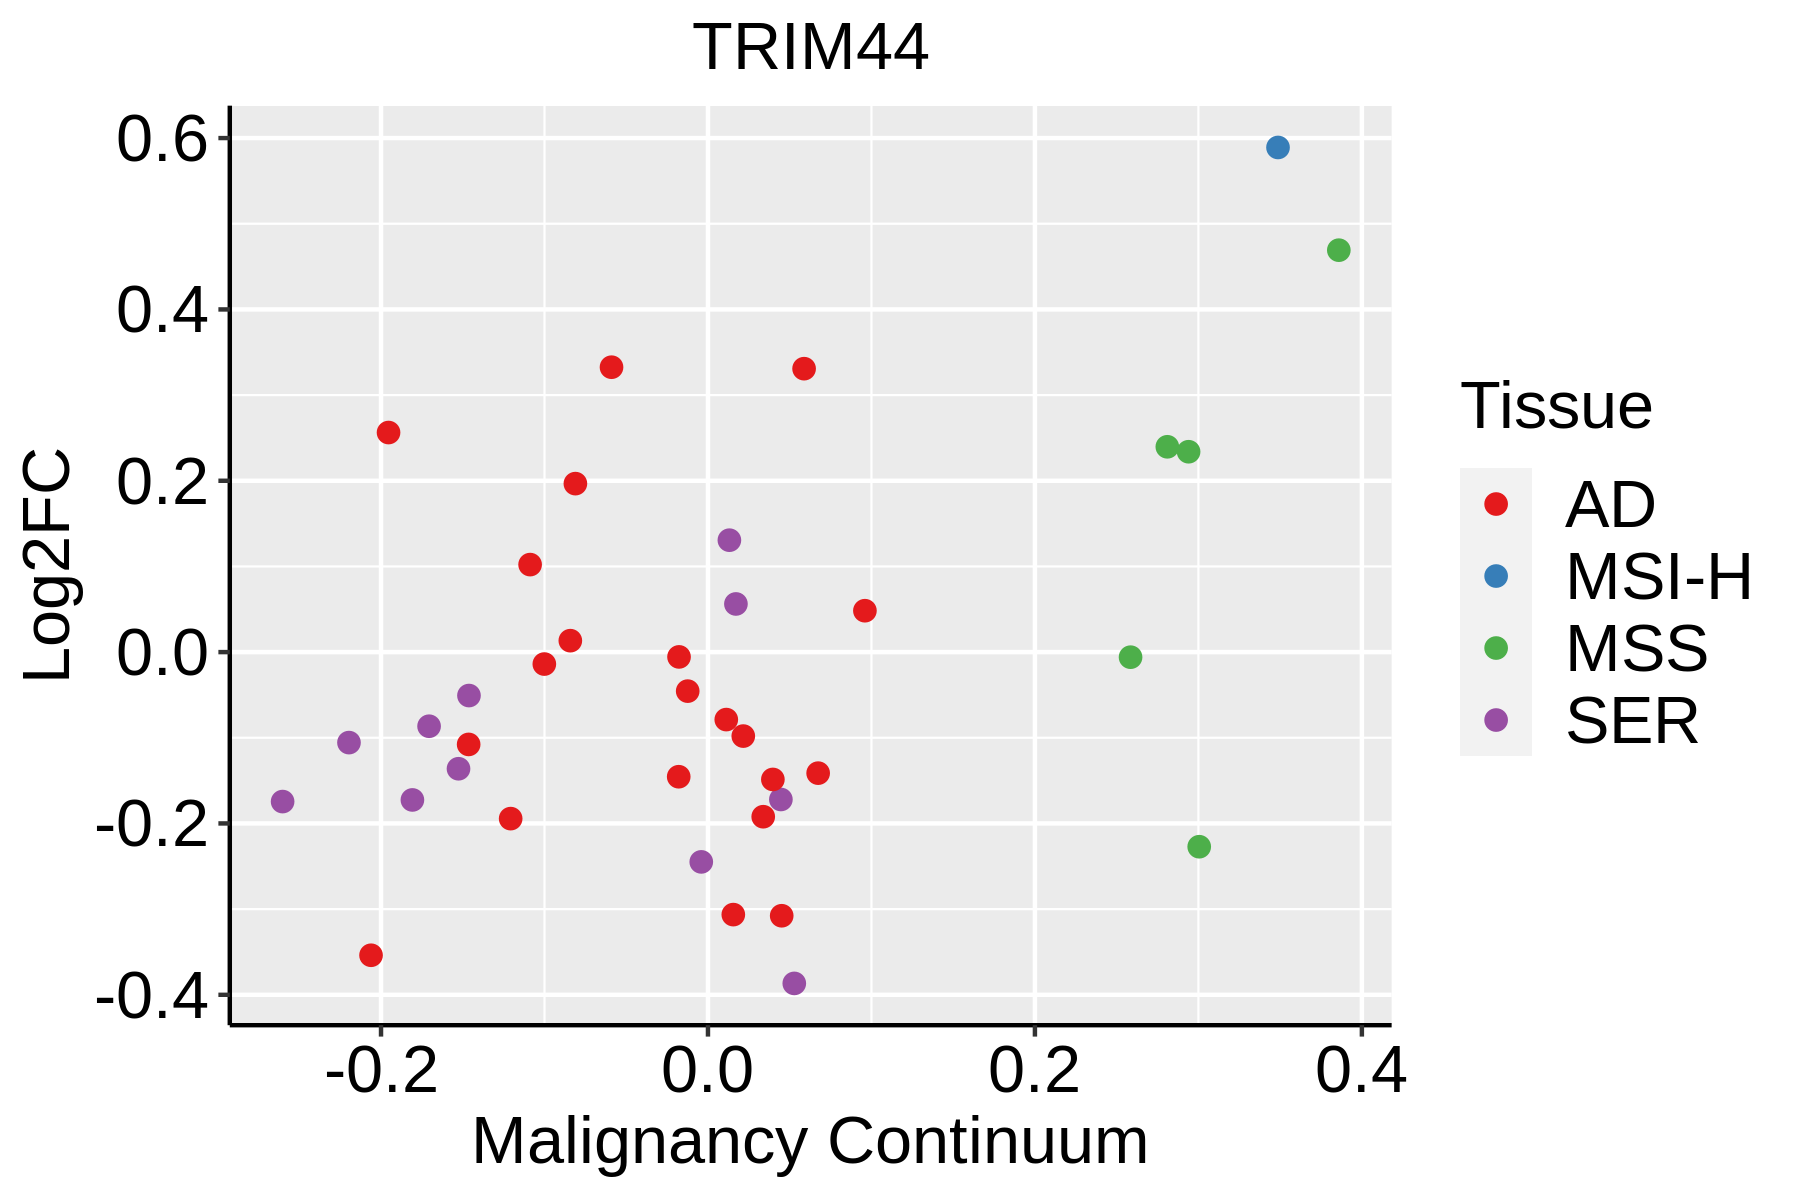 | AD: Adenomas |
| SER: Sessile serrated lesions | ||
| MSI-H: Microsatellite-high colorectal cancer | ||
| MSS: Microsatellite stable colorectal cancer | ||
| Esophagus | 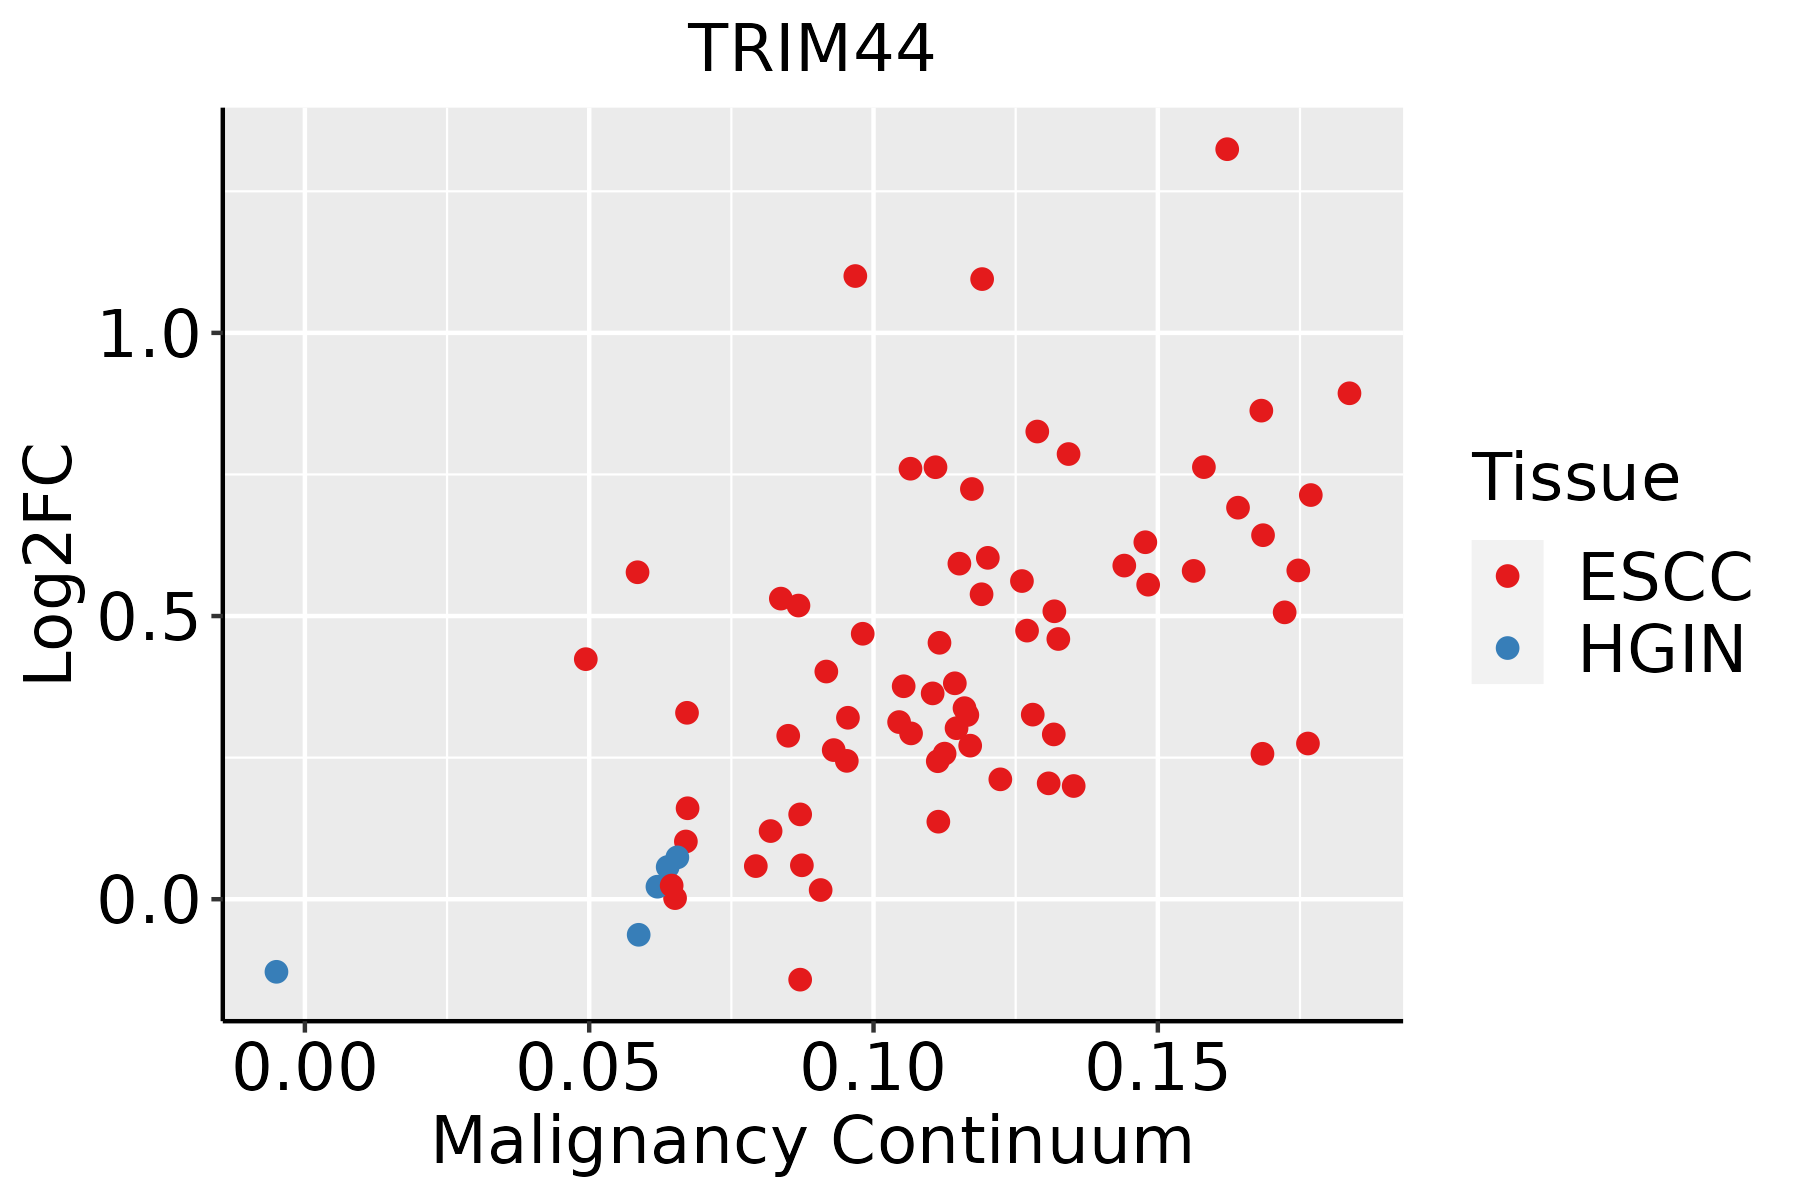 | ESCC: Esophageal squamous cell carcinoma |
| HGIN: High-grade intraepithelial neoplasias | ||
| LGIN: Low-grade intraepithelial neoplasias | ||
| Liver |  | HCC: Hepatocellular carcinoma |
| NAFLD: Non-alcoholic fatty liver disease | ||
| Oral Cavity | 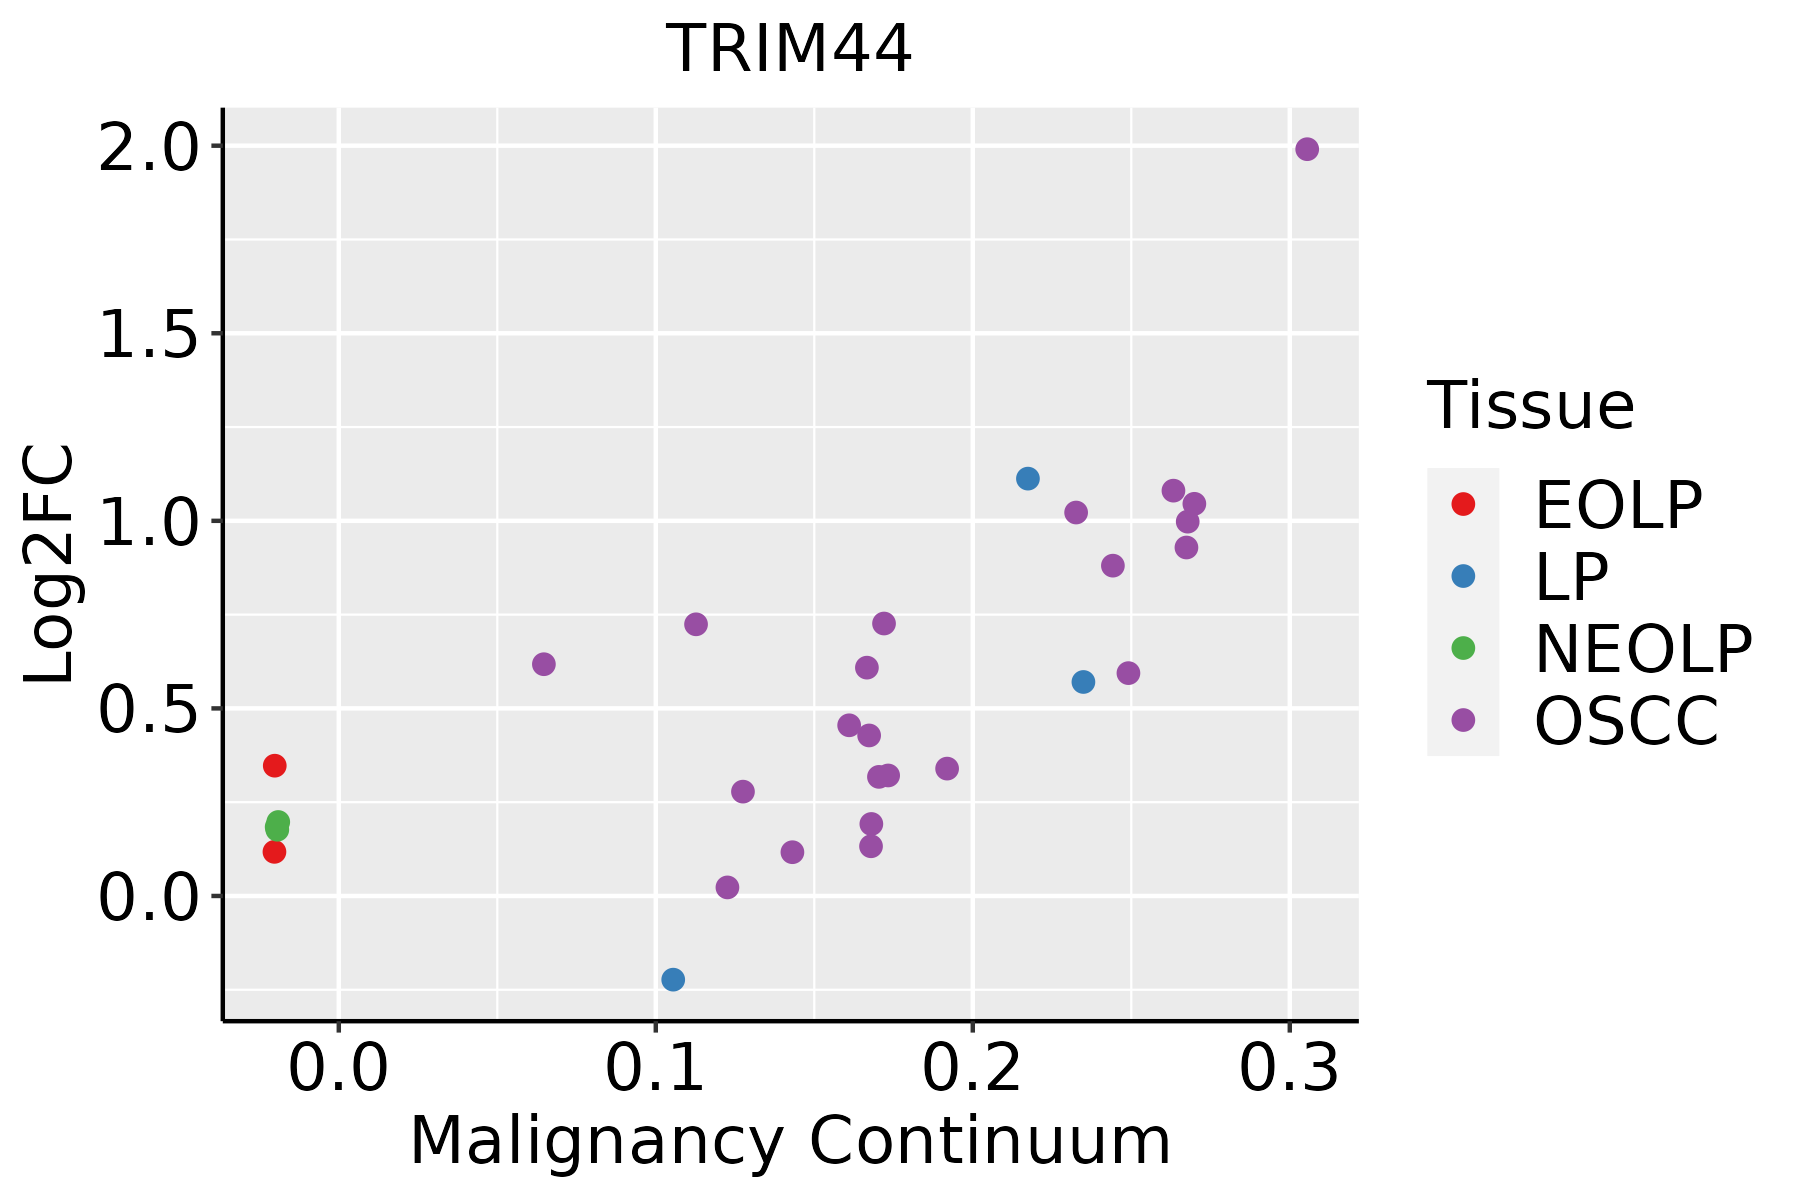 | EOLP: Erosive Oral lichen planus |
| LP: leukoplakia | ||
| NEOLP: Non-erosive oral lichen planus | ||
| OSCC: Oral squamous cell carcinoma | ||
| Prostate |  | BPH: Benign Prostatic Hyperplasia |
| Thyroid |  | ATC: Anaplastic thyroid cancer |
| HT: Hashimoto's thyroiditis | ||
| PTC: Papillary thyroid cancer |
| ∗log2FC in expression of this searched gene in stem-like cells from each diseased tissue sample relative to stem-like cells in normal samples in each tissue plotted against the malignancy continuum. Samples are colored based on if they are from different disease stage. |
Top |
Malignant transformation related pathway analysis |
| Find out the enriched GO biological processes and KEGG pathways involved in transition from healthy to precancer to cancer |
| Tissue | Disease Stage | Enriched GO biological Processes |
| Colorectum | AD |  |
| Colorectum | SER |  |
| Colorectum | MSS |  |
| Colorectum | MSI-H |  |
| Colorectum | FAP |  |
| ∗Top 15 enriched GO BP terms are showed in the bar plot of each disease state in each tissue. Each row represents a significant GO biological process which is colored according to the -log10(p.adjust). |
| Page: 1 2 3 4 5 6 7 8 9 |
| GO ID | Tissue | Disease Stage | Description | Gene Ratio | Bg Ratio | pvalue | p.adjust | Count |
| GO:0000209110 | Thyroid | ATC | protein polyubiquitination | 134/6293 | 236/18723 | 1.86e-13 | 9.20e-12 | 134 |
| GO:0070936110 | Thyroid | ATC | protein K48-linked ubiquitination | 47/6293 | 65/18723 | 1.98e-10 | 5.86e-09 | 47 |
| GO:003139734 | Thyroid | ATC | negative regulation of protein ubiquitination | 56/6293 | 83/18723 | 2.90e-10 | 8.20e-09 | 56 |
| GO:190332135 | Thyroid | ATC | negative regulation of protein modification by small protein conjugation or removal | 60/6293 | 95/18723 | 3.53e-09 | 8.14e-08 | 60 |
| GO:0009615111 | Thyroid | ATC | response to virus | 173/6293 | 367/18723 | 4.23e-08 | 7.71e-07 | 173 |
| GO:000283123 | Thyroid | ATC | regulation of response to biotic stimulus | 144/6293 | 327/18723 | 4.94e-05 | 3.91e-04 | 144 |
| GO:006076012 | Thyroid | ATC | positive regulation of response to cytokine stimulus | 33/6293 | 57/18723 | 1.43e-04 | 9.91e-04 | 33 |
| GO:006075912 | Thyroid | ATC | regulation of response to cytokine stimulus | 76/6293 | 162/18723 | 2.92e-04 | 1.85e-03 | 76 |
| GO:000195912 | Thyroid | ATC | regulation of cytokine-mediated signaling pathway | 71/6293 | 150/18723 | 3.28e-04 | 2.04e-03 | 71 |
| GO:000196112 | Thyroid | ATC | positive regulation of cytokine-mediated signaling pathway | 29/6293 | 50/18723 | 3.42e-04 | 2.12e-03 | 29 |
| GO:190122421 | Thyroid | ATC | positive regulation of NIK/NF-kappaB signaling | 37/6293 | 69/18723 | 4.80e-04 | 2.81e-03 | 37 |
| GO:005160712 | Thyroid | ATC | defense response to virus | 115/6293 | 265/18723 | 5.31e-04 | 3.09e-03 | 115 |
| GO:014054612 | Thyroid | ATC | defense response to symbiont | 115/6293 | 265/18723 | 5.31e-04 | 3.09e-03 | 115 |
| GO:003806122 | Thyroid | ATC | NIK/NF-kappaB signaling | 64/6293 | 143/18723 | 3.53e-03 | 1.57e-02 | 64 |
| GO:190122232 | Thyroid | ATC | regulation of NIK/NF-kappaB signaling | 51/6293 | 112/18723 | 5.68e-03 | 2.30e-02 | 51 |
| Page: 1 2 3 4 5 6 7 8 9 10 11 12 |
| Pathway ID | Tissue | Disease Stage | Description | Gene Ratio | Bg Ratio | pvalue | p.adjust | qvalue | Count |
| Page: 1 |
Top |
Cell-cell communication analysis |
| Identification of potential cell-cell interactions between two cell types and their ligand-receptor pairs for different disease states |
| Ligand | Receptor | LRpair | Pathway | Tissue | Disease Stage |
| Page: 1 |
Top |
Single-cell gene regulatory network inference analysis |
| Find out the significant the regulons (TFs) and the target genes of each regulon across cell types for different disease states |
| TF | Cell Type | Tissue | Disease Stage | Target Gene | RSS | Regulon Activity |
| ∗The dot plots of a searched regulon are shown for all cell subpopulations in each disease state of each tissue based on the regulon specific score inferred using pySCENIC and by calculating the average expression. |
| Page: 1 |
Top |
Somatic mutation of malignant transformation related genes |
| Annotation of somatic variants for genes involved in malignant transformation |
| Hugo Symbol | Variant Class | Variant Classification | dbSNP RS | HGVSc | HGVSp | HGVSp Short | SWISSPROT | BIOTYPE | SIFT | PolyPhen | Tumor Sample Barcode | Tissue | Histology | Sex | Age | Stage | Therapy Types | Drugs | Outcome |
| TRIM44 | deletion | Frame_Shift_Del | novel | c.998delN | p.Gly334AspfsTer81 | p.G334Dfs*81 | Q96DX7 | protein_coding | TCGA-D8-A27V-01 | Breast | breast invasive carcinoma | Female | <65 | I/II | Hormone Therapy | tamoxiphen | SD | ||
| TRIM44 | SNV | Missense_Mutation | novel | c.383A>C | p.Asp128Ala | p.D128A | Q96DX7 | protein_coding | tolerated(0.1) | benign(0.026) | TCGA-AA-A00N-01 | Colorectum | colon adenocarcinoma | Male | >=65 | I/II | Unknown | Unknown | PD |
| TRIM44 | SNV | Missense_Mutation | c.226N>T | p.Ala76Ser | p.A76S | Q96DX7 | protein_coding | tolerated(0.66) | benign(0) | TCGA-AA-A024-01 | Colorectum | colon adenocarcinoma | Male | >=65 | I/II | Unknown | Unknown | SD | |
| TRIM44 | SNV | Missense_Mutation | c.454N>A | p.Glu152Lys | p.E152K | Q96DX7 | protein_coding | tolerated(0.27) | benign(0.125) | TCGA-CA-6717-01 | Colorectum | colon adenocarcinoma | Male | <65 | I/II | Chemotherapy | oxaliplatin | CR | |
| TRIM44 | SNV | Missense_Mutation | c.739N>A | p.Asp247Asn | p.D247N | Q96DX7 | protein_coding | tolerated(0.33) | possibly_damaging(0.886) | TCGA-RU-A8FL-01 | Colorectum | colon adenocarcinoma | Male | <65 | III/IV | Chemotherapy | folfox | PD | |
| TRIM44 | SNV | Missense_Mutation | rs181043254 | c.991N>A | p.Asp331Asn | p.D331N | Q96DX7 | protein_coding | tolerated_low_confidence(0.39) | possibly_damaging(0.446) | TCGA-AG-3892-01 | Colorectum | rectum adenocarcinoma | Female | <65 | I/II | Unknown | Unknown | SD |
| TRIM44 | SNV | Missense_Mutation | rs779732372 | c.706N>A | p.Glu236Lys | p.E236K | Q96DX7 | protein_coding | deleterious(0.01) | probably_damaging(0.97) | TCGA-AG-A002-01 | Colorectum | rectum adenocarcinoma | Male | <65 | I/II | Unknown | Unknown | SD |
| TRIM44 | SNV | Missense_Mutation | novel | c.211G>A | p.Ala71Thr | p.A71T | Q96DX7 | protein_coding | tolerated(0.23) | benign(0.062) | TCGA-F5-6814-01 | Colorectum | rectum adenocarcinoma | Male | <65 | I/II | Unknown | Unknown | SD |
| TRIM44 | SNV | Missense_Mutation | c.217G>A | p.Gly73Arg | p.G73R | Q96DX7 | protein_coding | deleterious(0.05) | benign(0.003) | TCGA-AP-A0LM-01 | Endometrium | uterine corpus endometrioid carcinoma | Female | <65 | III/IV | Chemotherapy | cisplatin | SD | |
| TRIM44 | SNV | Missense_Mutation | c.217N>A | p.Gly73Arg | p.G73R | Q96DX7 | protein_coding | deleterious(0.05) | benign(0.003) | TCGA-AP-A1DK-01 | Endometrium | uterine corpus endometrioid carcinoma | Female | <65 | I/II | Unknown | Unknown | SD |
| Page: 1 2 3 4 |
Top |
Related drugs of malignant transformation related genes |
| Identification of chemicals and drugs interact with genes involved in malignant transfromation |
| (DGIdb 4.0) |
| Entrez ID | Symbol | Category | Interaction Types | Drug Claim Name | Drug Name | PMIDs |
| Page: 1 |

Copyright 2023-Present -The University of Texas Health Science Center at Houston |