Schematic overview of the cellular and molecular mechanisms involved in the cancer progression, including the proposed cellular and molecular mechanisms in cancer cells trajectory. AT1: alveolar type 1 cells; AT2: alveolar type 2 cells; AAH: atypical adenomatous hyperplasia; AIS: adenocarcinoma in situ; MIA: minimally invasive adenocarcinoma; IA: invasive adenocarcinoma; EMT: epithelial-mesenchymal transition

Home

Download

Statistics

Help

Contact

Center for Computational Systems Medicine
leaf

Gene summary

leaf

Malignant transformation analysis

leaf

Malignant transformation related pathway analysis

leaf

Cell-cell communication analysis

leaf

Single-cell gene regulatory network inference analysis

leaf

Somatic mutation of malignant transformation related genes

leaf

Related drugs of malignant transformation related genes

Gene: TBC1D5

Gene summary for TBC1D5

check button Gene summary.

Gene informationSpeciesHuman
Gene symbol

TBC1D5

Gene ID

9779

Gene nameTBC1 domain family member 5
Gene AliasTBC1D5
Cytomap3p24.3
Gene Typeprotein-coding
GO ID

GO:0002090

UniProtAcc

Q92609


Top

Malignant transformation analysis

check button Identification of the aberrant gene expression in precancerous and cancerous lesions by comparing the gene expression of stem-like cells in diseased tissues with normal stem cells
check button Malignant transformation involving gene list.
Entrez IDSymbolReplicatesSpeciesOrganTissueAdj P-valueLog2FCMalignancy
9779TBC1D5CCI_1HumanCervixCC7.31e-048.11e-010.528
9779TBC1D5CCI_3HumanCervixCC1.29e-111.49e+000.516
9779TBC1D5sample3HumanCervixCC2.20e-02-1.99e-010.1387
9779TBC1D5T3HumanCervixCC3.48e-04-1.94e-010.1389
9779TBC1D5HTA11_2487_2000001011HumanColorectumSER1.07e-02-4.68e-01-0.1808
9779TBC1D5HTA11_347_2000001011HumanColorectumAD4.77e-075.33e-01-0.1954
9779TBC1D5HTA11_2112_2000001011HumanColorectumSER4.21e-02-5.84e-01-0.2196
9779TBC1D5HTA11_5212_2000001011HumanColorectumAD4.81e-03-6.42e-01-0.2061
9779TBC1D5HTA11_5216_2000001011HumanColorectumSER1.95e-08-6.21e-01-0.1462
9779TBC1D5HTA11_866_3004761011HumanColorectumAD5.53e-03-3.74e-010.096
9779TBC1D5HTA11_99999965062_69753HumanColorectumMSI-H9.04e-131.10e+000.3487
9779TBC1D5HTA11_99999965104_69814HumanColorectumMSS1.53e-066.19e-010.281
9779TBC1D5HTA11_99999973899_84307HumanColorectumMSS2.02e-06-5.32e-010.2585
9779TBC1D5HTA11_99999974143_84620HumanColorectumMSS4.41e-15-5.15e-010.3005
9779TBC1D5A015-C-203HumanColorectumFAP5.06e-38-5.20e-01-0.1294
9779TBC1D5A015-C-204HumanColorectumFAP3.78e-05-1.79e-01-0.0228
9779TBC1D5A014-C-040HumanColorectumFAP1.58e-03-3.11e-01-0.1184
9779TBC1D5A002-C-201HumanColorectumFAP1.54e-14-4.16e-010.0324
9779TBC1D5A001-C-119HumanColorectumFAP5.59e-11-5.49e-01-0.1557
9779TBC1D5A001-C-108HumanColorectumFAP2.33e-15-2.56e-01-0.0272
Page: 1 2 3 4 5 6 7 8 9 10 11 12 13 

check button Transcriptomic changes along malignancy continuum.
TissueExpression DynamicsAbbreviation
CervixThe image shows the transcriptomic changes along malignancy continuum.log2FC in expression of this searched gene in stem-like cells from each diseased tissue sample relative to stem-like cells in normal samples in each tissue plotted against the malignancy continuum. Samples are colored based on if they are from different disease stage.CC: Cervix cancer
HSIL_HPV: HPV-infected high-grade squamous intraepithelial lesions
N_HPV: HPV-infected normal cervix
Colorectum (GSE201348)The image shows the transcriptomic changes along malignancy continuum.log2FC in expression of this searched gene in stem-like cells from each diseased tissue sample relative to stem-like cells in normal samples in each tissue plotted against the malignancy continuum. Samples are colored based on if they are from different disease stage.FAP: Familial adenomatous polyposis
CRC: Colorectal cancer
Colorectum (HTA11)The image shows the transcriptomic changes along malignancy continuum.log2FC in expression of this searched gene in stem-like cells from each diseased tissue sample relative to stem-like cells in normal samples in each tissue plotted against the malignancy continuum. Samples are colored based on if they are from different disease stage.AD: Adenomas
SER: Sessile serrated lesions
MSI-H: Microsatellite-high colorectal cancer
MSS: Microsatellite stable colorectal cancer
EndometriumThe image shows the transcriptomic changes along malignancy continuum.log2FC in expression of this searched gene in stem-like cells from each diseased tissue sample relative to stem-like cells in normal samples in each tissue plotted against the malignancy continuum. Samples are colored based on if they are from different disease stage.
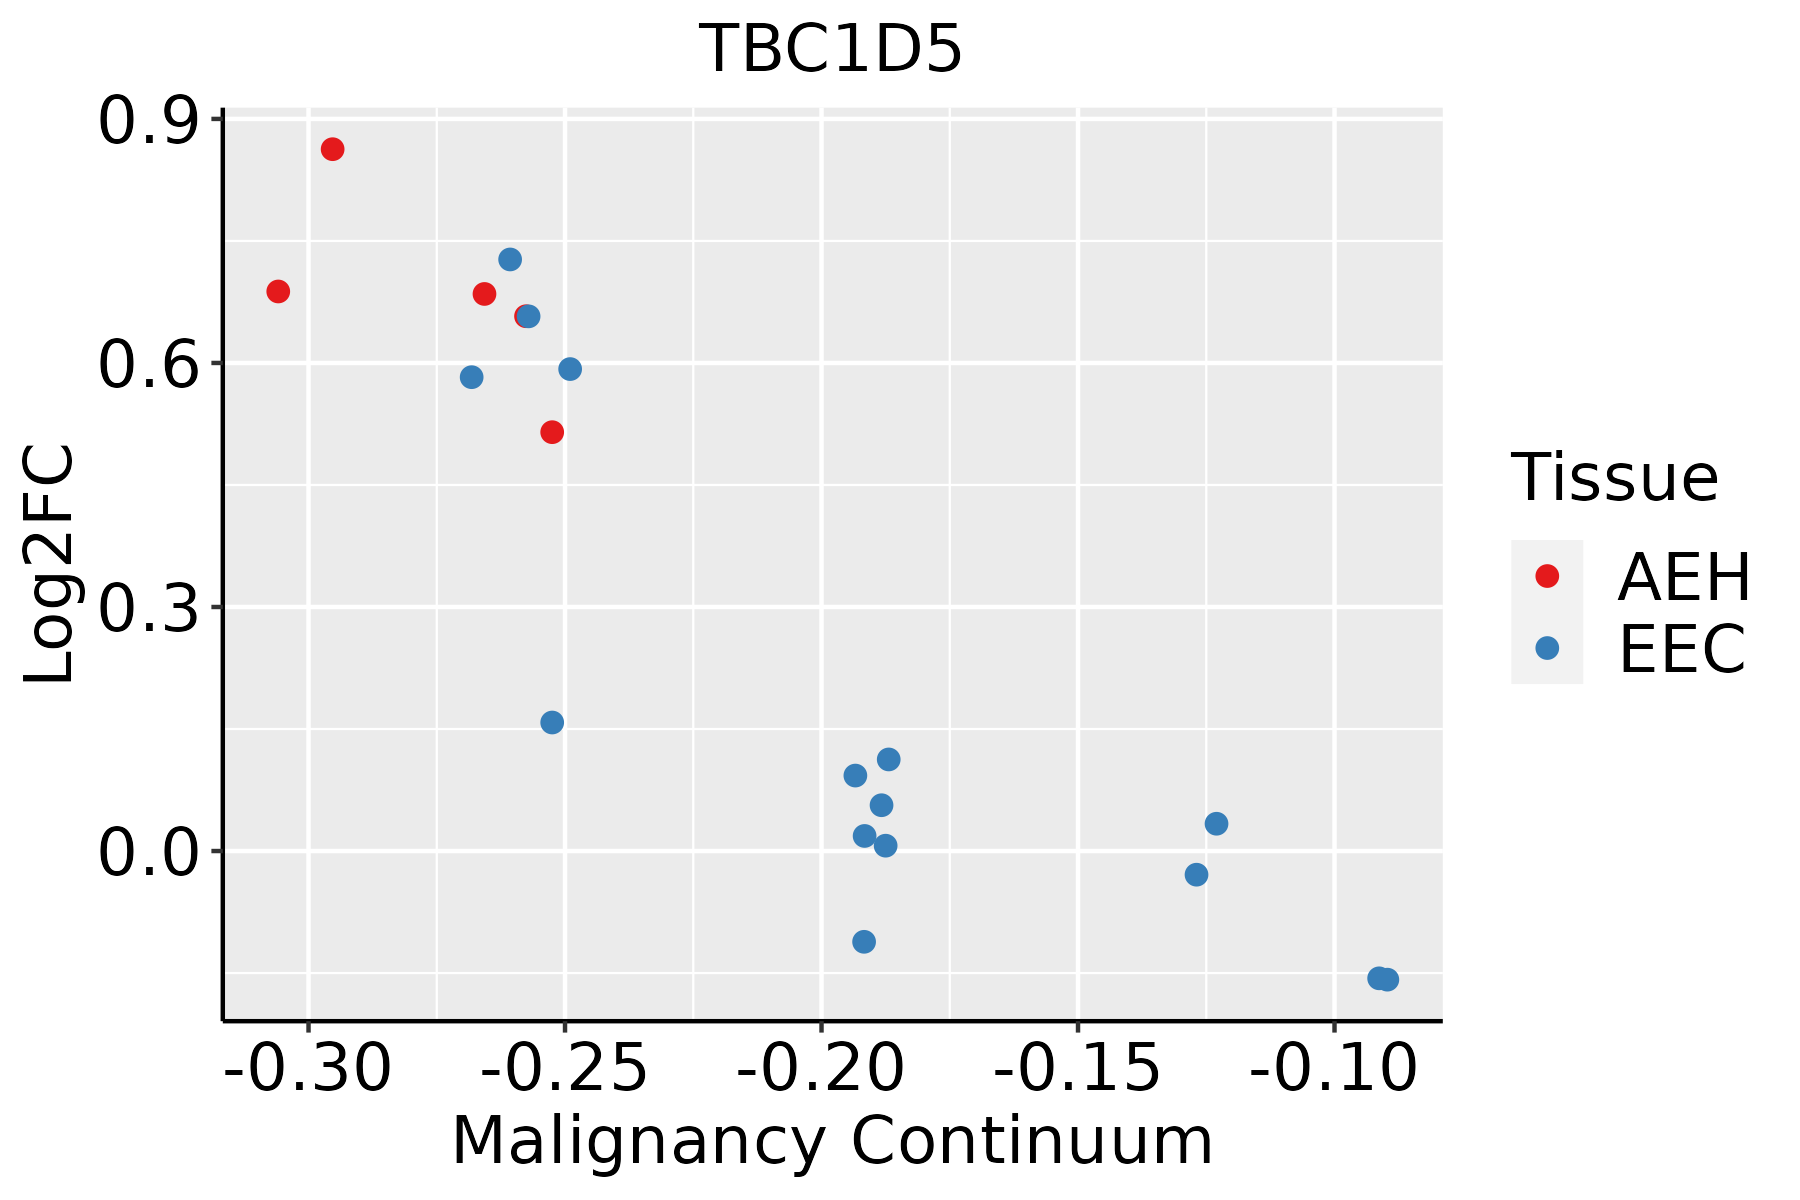
AEH: Atypical endometrial hyperplasia
EEC: Endometrioid Cancer
EsophagusThe image shows the transcriptomic changes along malignancy continuum.log2FC in expression of this searched gene in stem-like cells from each diseased tissue sample relative to stem-like cells in normal samples in each tissue plotted against the malignancy continuum. Samples are colored based on if they are from different disease stage.ESCC: Esophageal squamous cell carcinoma
HGIN: High-grade intraepithelial neoplasias
LGIN: Low-grade intraepithelial neoplasias
GCThe image shows the transcriptomic changes along malignancy continuum.log2FC in expression of this searched gene in stem-like cells from each diseased tissue sample relative to stem-like cells in normal samples in each tissue plotted against the malignancy continuum. Samples are colored based on if they are from different disease stage.CAG: Chronic atrophic gastritis
CAG with IM: Chronic atrophic gastritis with intestinal metaplasia
CSG: Chronic superficial gastritis
GC: Gastric cancer
SIM: Severe intestinal metaplasia
WIM: Wild intestinal metaplasia
LiverThe image shows the transcriptomic changes along malignancy continuum.log2FC in expression of this searched gene in stem-like cells from each diseased tissue sample relative to stem-like cells in normal samples in each tissue plotted against the malignancy continuum. Samples are colored based on if they are from different disease stage.
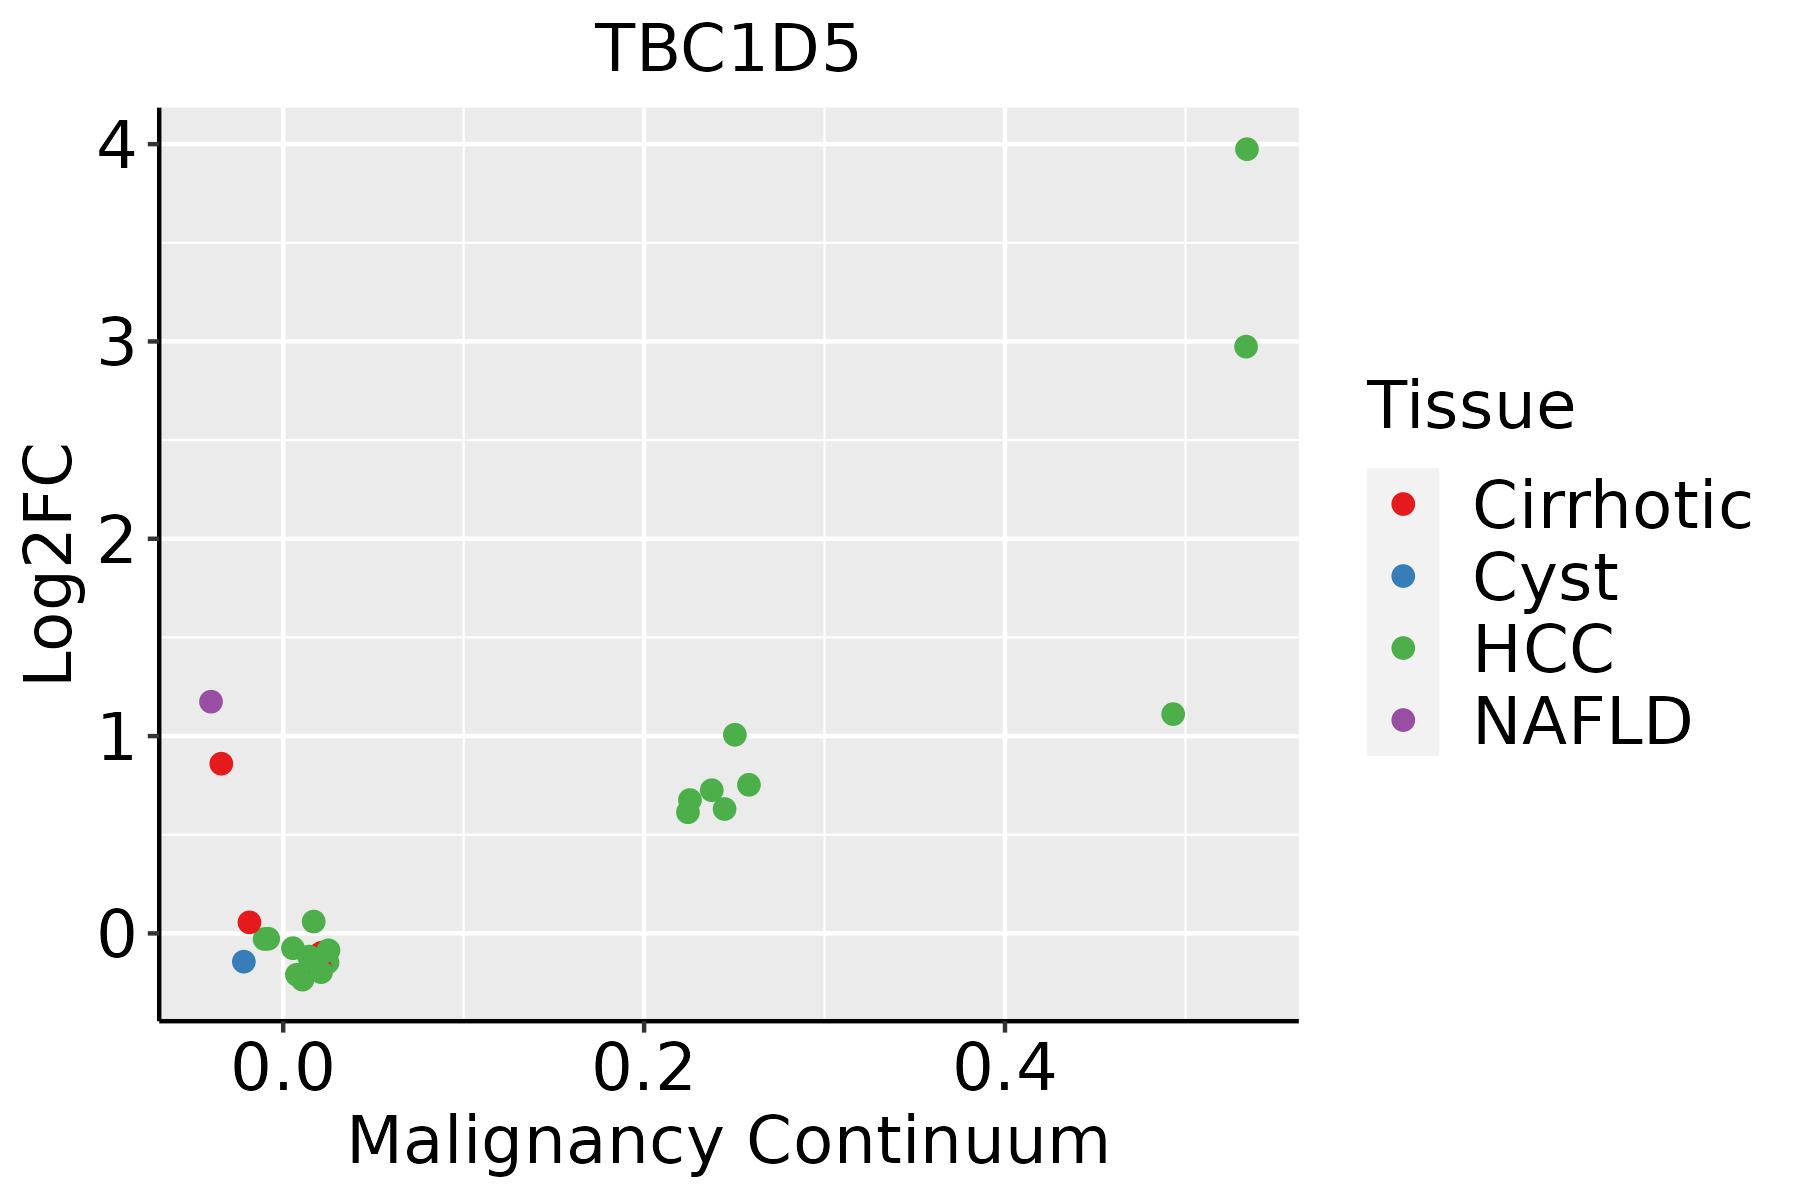
HCC: Hepatocellular carcinoma
NAFLD: Non-alcoholic fatty liver disease
LungThe image shows the transcriptomic changes along malignancy continuum.log2FC in expression of this searched gene in stem-like cells from each diseased tissue sample relative to stem-like cells in normal samples in each tissue plotted against the malignancy continuum. Samples are colored based on if they are from different disease stage.AAH: Atypical adenomatous hyperplasia
AIS: Adenocarcinoma in situ
IAC: Invasive lung adenocarcinoma
MIA: Minimally invasive adenocarcinoma
Oral CavityThe image shows the transcriptomic changes along malignancy continuum.log2FC in expression of this searched gene in stem-like cells from each diseased tissue sample relative to stem-like cells in normal samples in each tissue plotted against the malignancy continuum. Samples are colored based on if they are from different disease stage.
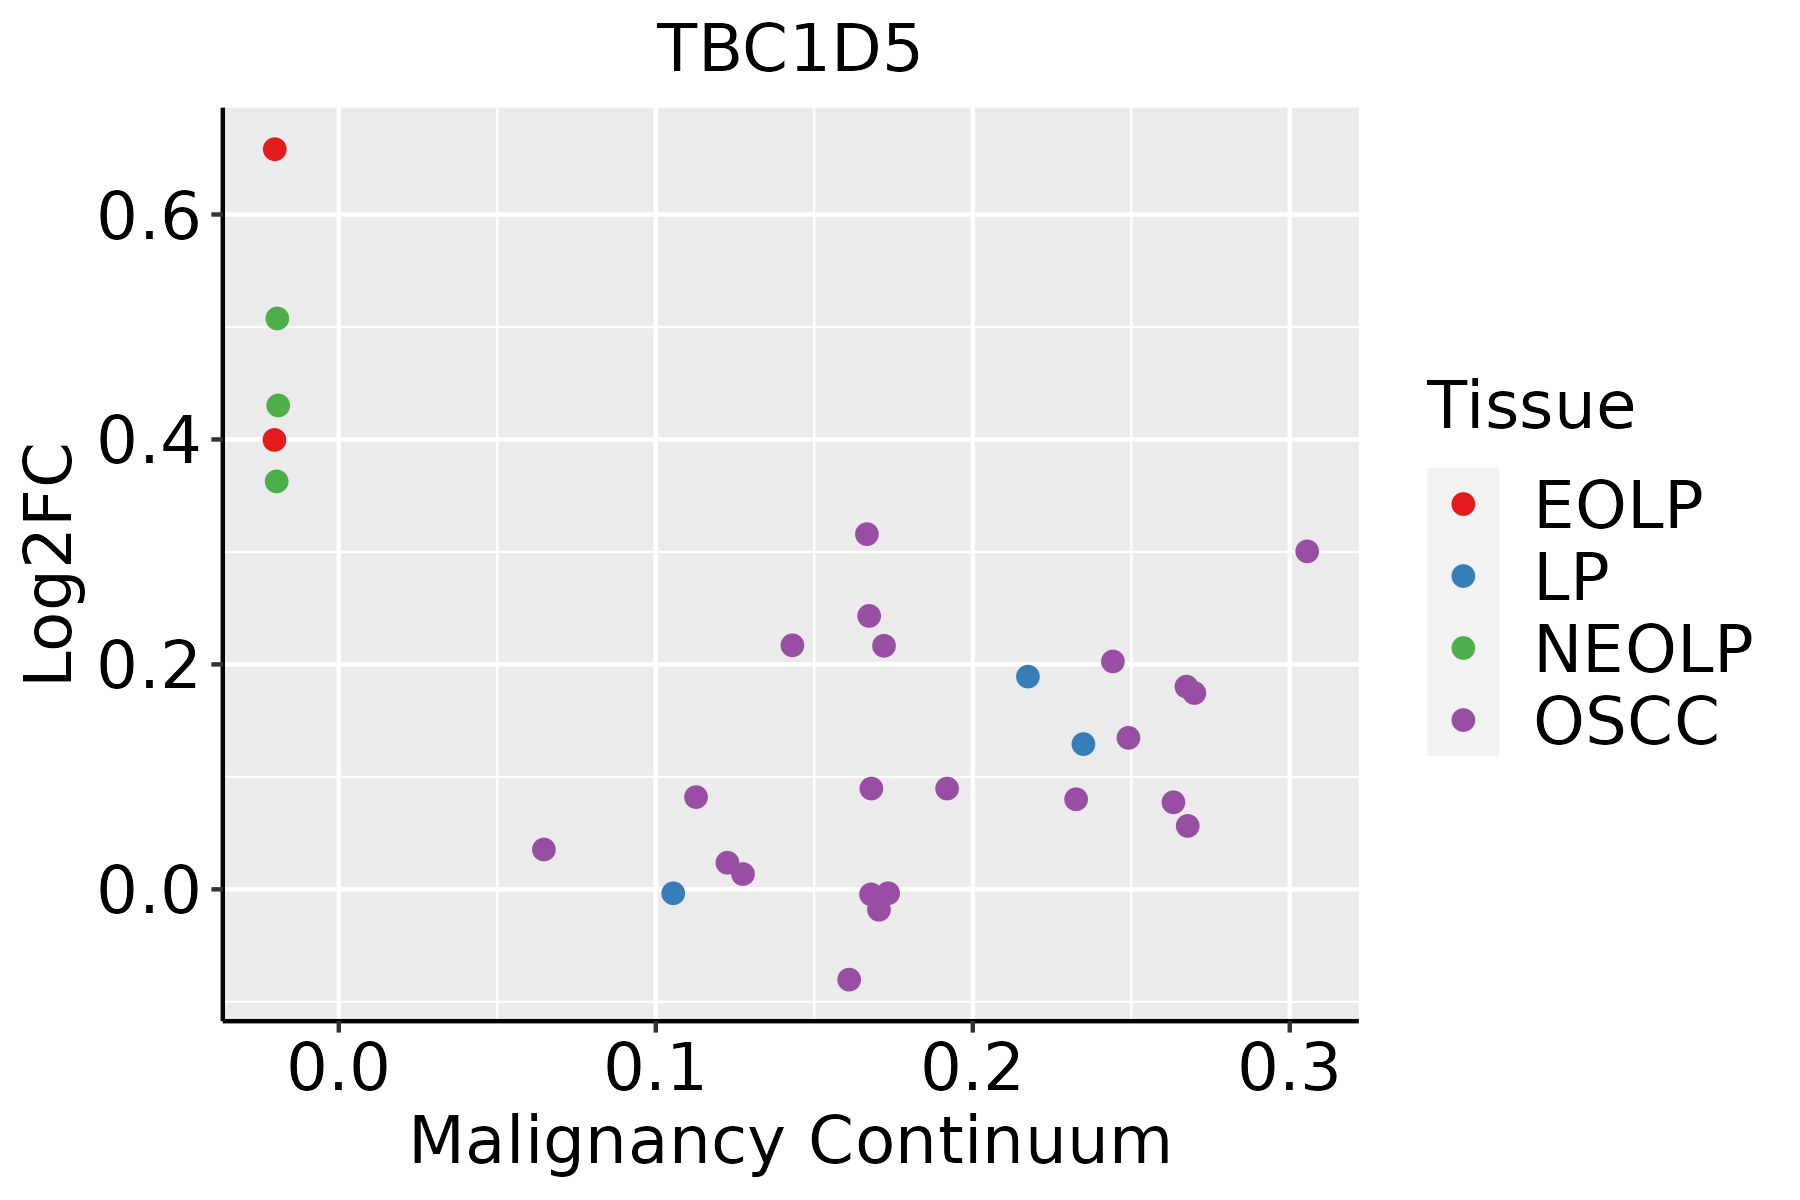
EOLP: Erosive Oral lichen planus
LP: leukoplakia
NEOLP: Non-erosive oral lichen planus
OSCC: Oral squamous cell carcinoma
ProstateThe image shows the transcriptomic changes along malignancy continuum.log2FC in expression of this searched gene in stem-like cells from each diseased tissue sample relative to stem-like cells in normal samples in each tissue plotted against the malignancy continuum. Samples are colored based on if they are from different disease stage.
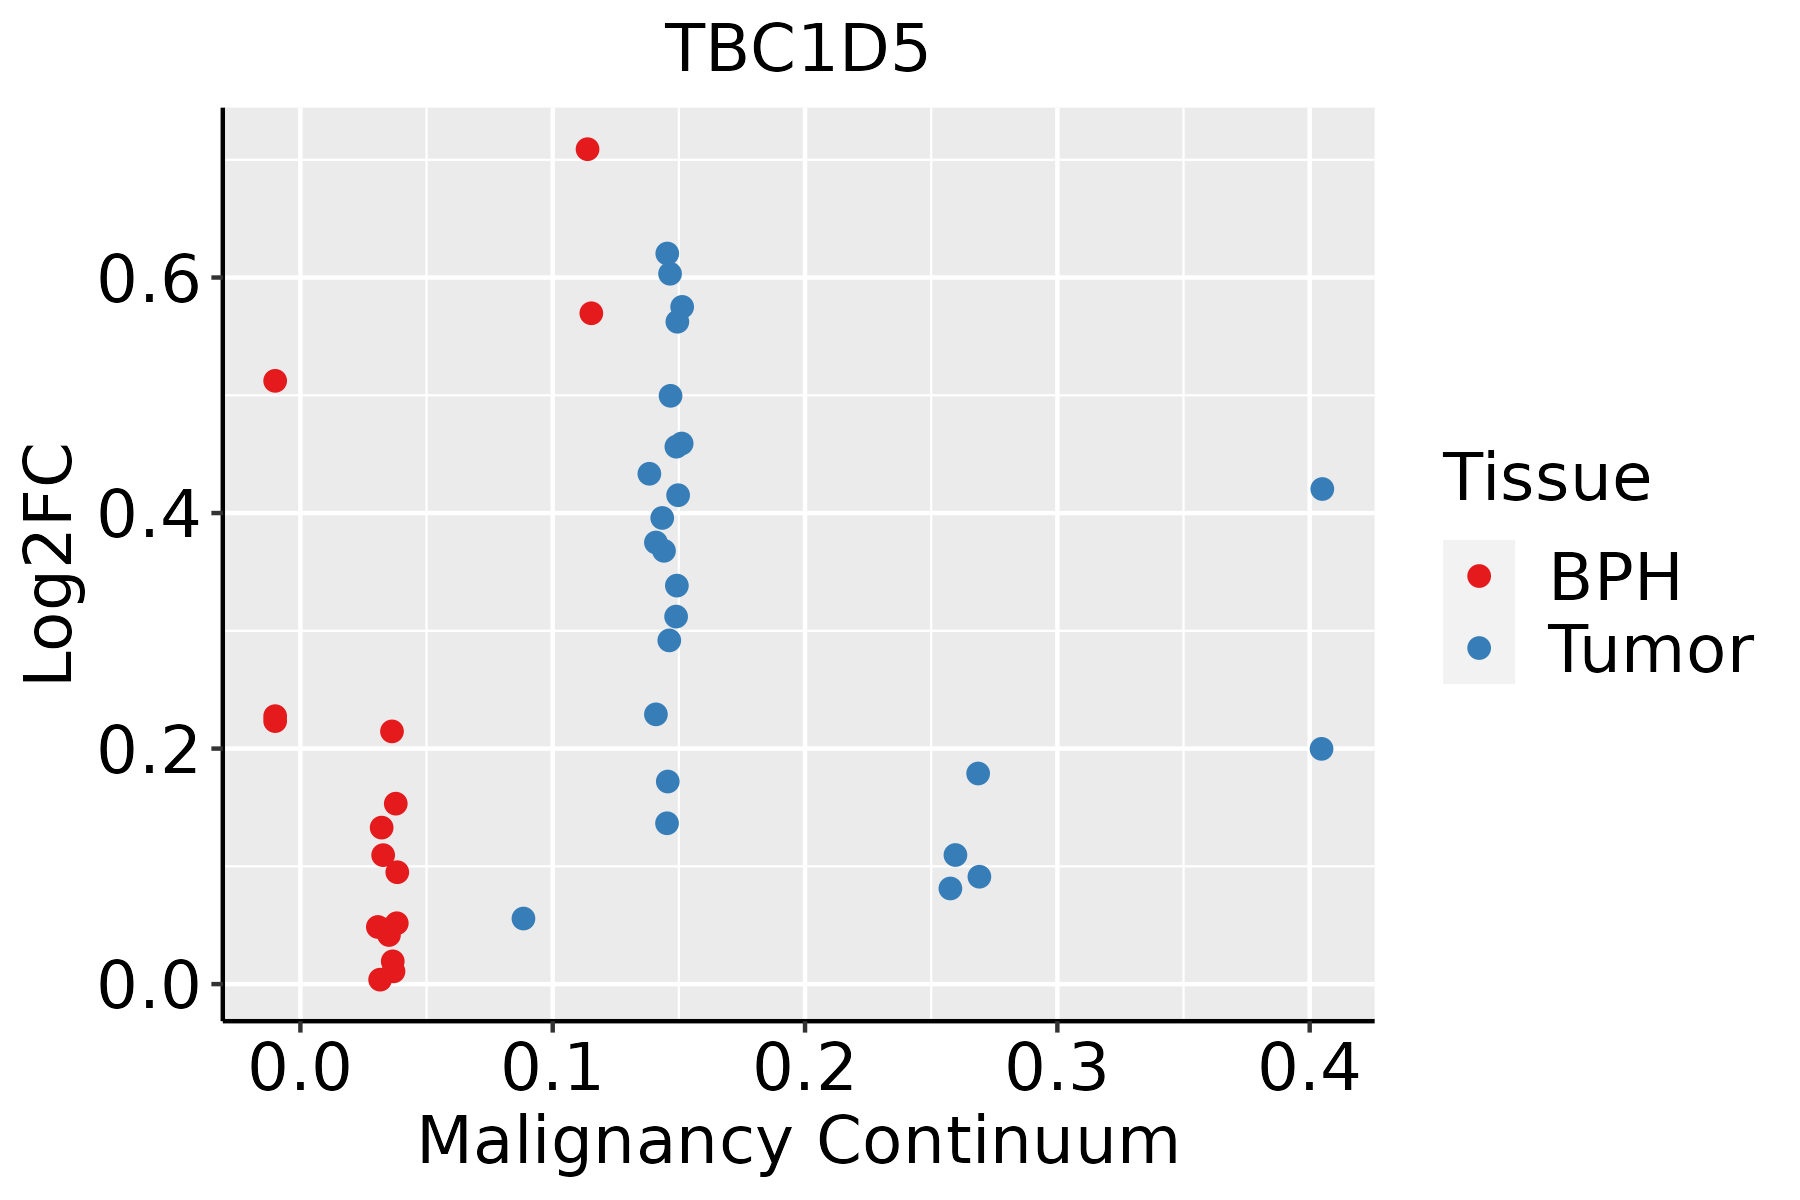
BPH: Benign Prostatic Hyperplasia
SkinThe image shows the transcriptomic changes along malignancy continuum.log2FC in expression of this searched gene in stem-like cells from each diseased tissue sample relative to stem-like cells in normal samples in each tissue plotted against the malignancy continuum. Samples are colored based on if they are from different disease stage.
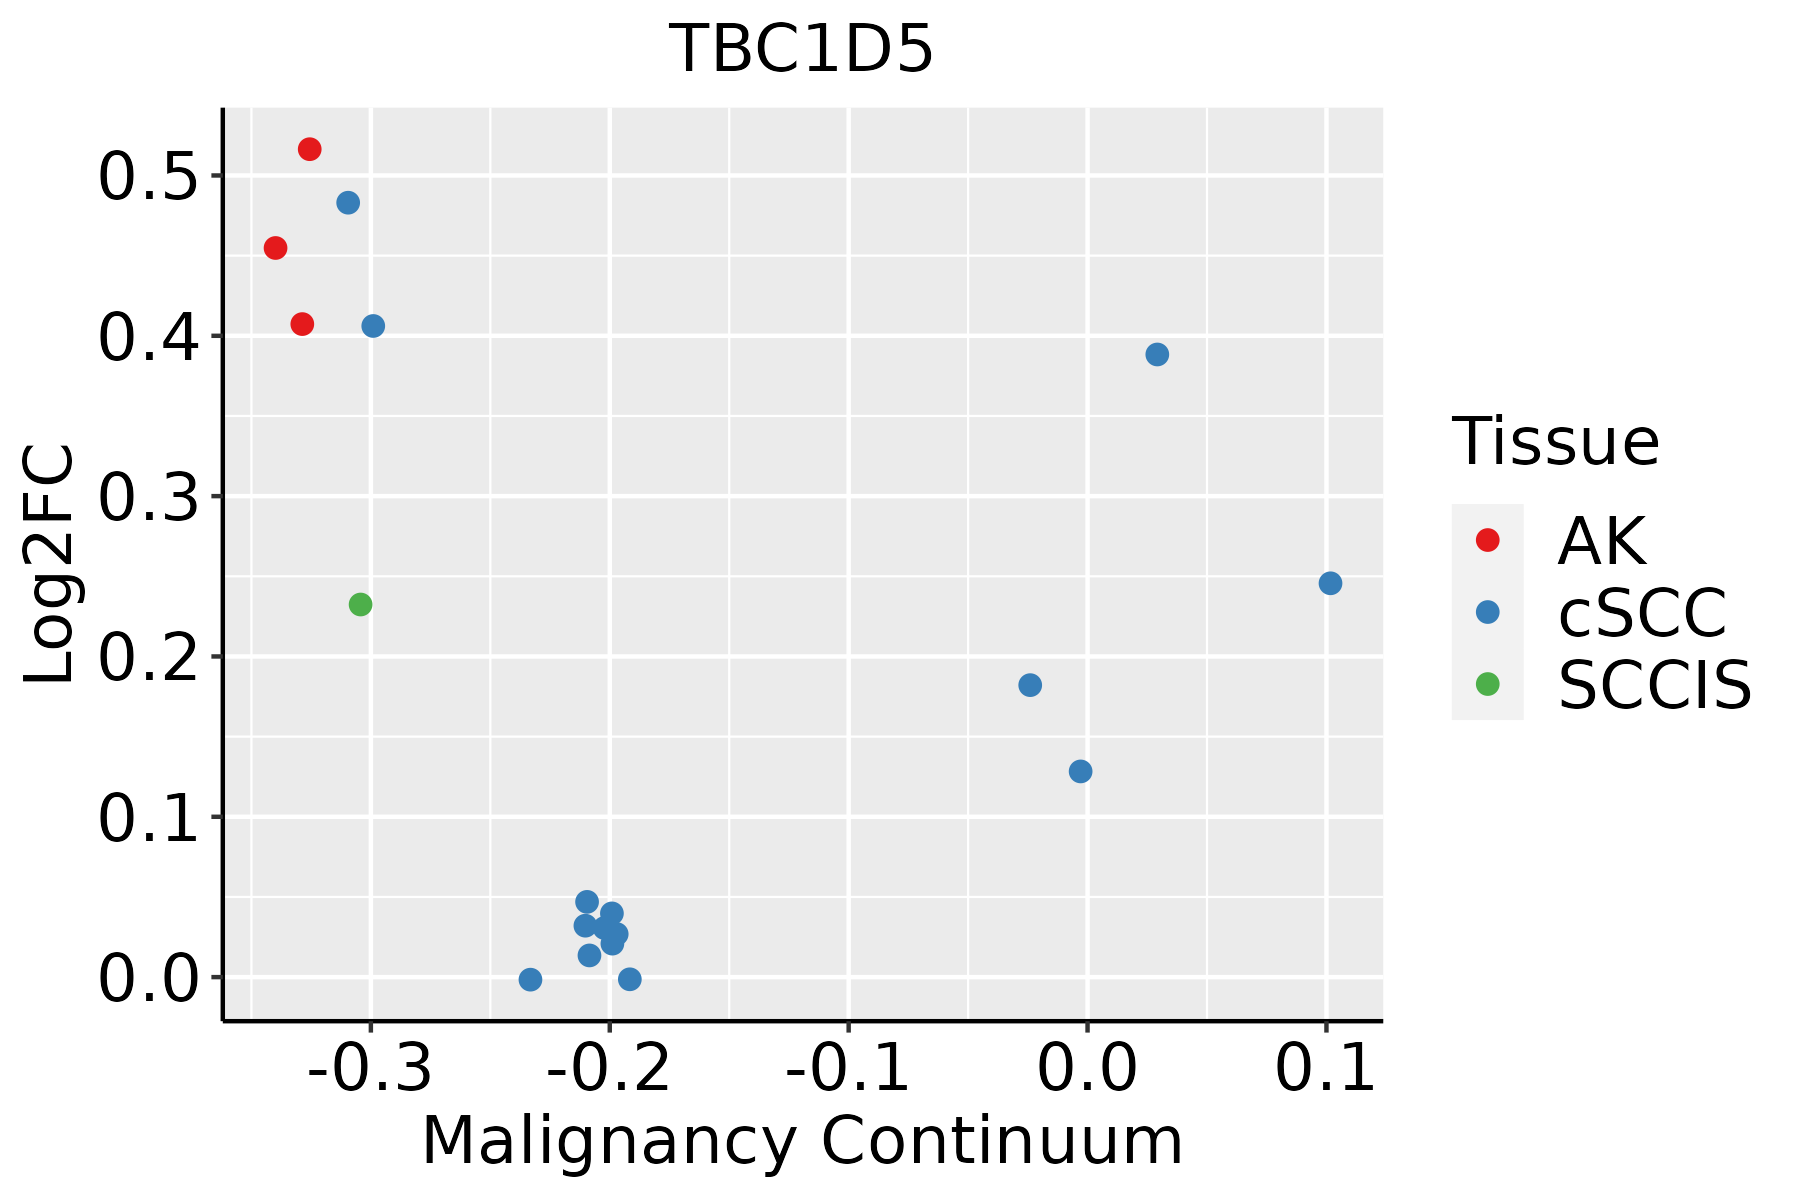
AK: Actinic keratosis
cSCC: Cutaneous squamous cell carcinoma
SCCIS:squamous cell carcinoma in situ
ThyroidThe image shows the transcriptomic changes along malignancy continuum.log2FC in expression of this searched gene in stem-like cells from each diseased tissue sample relative to stem-like cells in normal samples in each tissue plotted against the malignancy continuum. Samples are colored based on if they are from different disease stage.ATC: Anaplastic thyroid cancer
HT: Hashimoto's thyroiditis
PTC: Papillary thyroid cancer
∗log2FC in expression of this searched gene in stem-like cells from each diseased tissue sample relative to stem-like cells in normal samples in each tissue plotted against the malignancy continuum. Samples are colored based on if they are from different disease stage.

Top

Malignant transformation related pathway analysis

check buttonFind out the enriched GO biological processes and KEGG pathways involved in transition from healthy to precancer to cancer
check button Figure of enriched GO biological processes.
TissueDisease StageEnriched GO biological Processes
ColorectumADGO analysis - Figure of enriched GO biological processes: Top 15 enriched GO BP terms are showed in the bar plot of each disease state in each tissue. Each row represents a significant GO biological process which is colored according to the -log10(p.adjust).
ColorectumSERGO analysis - Figure of enriched GO biological processes: Top 15 enriched GO BP terms are showed in the bar plot of each disease state in each tissue. Each row represents a significant GO biological process which is colored according to the -log10(p.adjust).
ColorectumMSSGO analysis - Figure of enriched GO biological processes: Top 15 enriched GO BP terms are showed in the bar plot of each disease state in each tissue. Each row represents a significant GO biological process which is colored according to the -log10(p.adjust).
ColorectumMSI-HGO analysis - Figure of enriched GO biological processes: Top 15 enriched GO BP terms are showed in the bar plot of each disease state in each tissue. Each row represents a significant GO biological process which is colored according to the -log10(p.adjust).
ColorectumFAPGO analysis - Figure of enriched GO biological processes: Top 15 enriched GO BP terms are showed in the bar plot of each disease state in each tissue. Each row represents a significant GO biological process which is colored according to the -log10(p.adjust).
∗Top 15 enriched GO BP terms are showed in the bar plot of each disease state in each tissue. Each row represents a significant GO biological process which is colored according to the -log10(p.adjust).
Page: 1 2 3 4 5 6 7 8 9 

check button Enriched GO biological processes.
GO IDTissueDisease StageDescriptionGene RatioBg Ratiopvaluep.adjustCount
GO:004825915Oral cavityEOLPregulation of receptor-mediated endocytosis28/2218110/187236.12e-057.68e-0428
GO:004308714Oral cavityEOLPregulation of GTPase activity66/2218348/187236.92e-058.55e-0466
GO:004311223Oral cavityEOLPreceptor metabolic process37/2218166/187231.00e-041.14e-0337
GO:004259422Oral cavityEOLPresponse to starvation42/2218197/187231.03e-041.17e-0342
GO:003166725Oral cavityEOLPresponse to nutrient levels82/2218474/187232.59e-042.52e-0382
GO:001619722Oral cavityEOLPendosomal transport45/2218230/187234.63e-044.07e-0345
GO:00435479Oral cavityEOLPpositive regulation of GTPase activity47/2218255/187231.34e-039.33e-0347
GO:004214722Oral cavityEOLPretrograde transport, endosome to Golgi21/221891/187231.89e-031.21e-0221
GO:00482609Oral cavityEOLPpositive regulation of receptor-mediated endocytosis14/221852/187232.31e-031.42e-0214
GO:003162314Oral cavityEOLPreceptor internalization23/2218113/187236.37e-033.15e-0223
GO:004311231Oral cavityNEOLPreceptor metabolic process40/2005166/187236.24e-071.82e-0540
GO:003010031Oral cavityNEOLPregulation of endocytosis47/2005211/187237.96e-072.20e-0547
GO:000689831Oral cavityNEOLPreceptor-mediated endocytosis51/2005244/187232.08e-064.87e-0551
GO:004580731Oral cavityNEOLPpositive regulation of endocytosis27/2005100/187234.19e-069.05e-0527
GO:001623631Oral cavityNEOLPmacroautophagy54/2005291/187233.95e-055.62e-0454
GO:003162322Oral cavityNEOLPreceptor internalization26/2005113/187231.24e-041.47e-0326
GO:003166732Oral cavityNEOLPresponse to nutrient levels77/2005474/187231.27e-041.49e-0377
GO:004825923Oral cavityNEOLPregulation of receptor-mediated endocytosis25/2005110/187232.04e-042.19e-0325
GO:001619731Oral cavityNEOLPendosomal transport41/2005230/187237.41e-046.05e-0341
GO:004826015Oral cavityNEOLPpositive regulation of receptor-mediated endocytosis14/200552/187238.66e-046.83e-0314
Page: 1 2 3 4 5 6 7 8 9 10 11 12 13 14 15 16 17 

check button Enriched KEGG pathways.
Pathway IDTissueDisease StageDescriptionGene RatioBg Ratiopvaluep.adjustqvalueCount
Page: 1 

Top

Cell-cell communication analysis

check buttonIdentification of potential cell-cell interactions between two cell types and their ligand-receptor pairs for different disease states
LigandReceptorLRpairPathwayTissueDisease Stage
Page: 1 

Top

Single-cell gene regulatory network inference analysis

check buttonFind out the significant the regulons (TFs) and the target genes of each regulon across cell types for different disease states
TFCell TypeTissueDisease StageTarget GeneRSSRegulon Activity
∗The dot plots of a searched regulon are shown for all cell subpopulations in each disease state of each tissue based on the regulon specific score inferred using pySCENIC and by calculating the average expression.
Page: 1 

Top

Somatic mutation of malignant transformation related genes

check buttonAnnotation of somatic variants for genes involved in malignant transformation
Hugo SymbolVariant ClassVariant ClassificationdbSNP RSHGVScHGVSpHGVSp ShortSWISSPROTBIOTYPESIFTPolyPhenTumor Sample BarcodeTissueHistologySexAgeStageTherapy TypesDrugsOutcome
TBC1D5SNVMissense_Mutationc.2287C>Ap.Leu763Ilep.L763IQ92609protein_codingtolerated_low_confidence(0.41)benign(0)TCGA-A8-A07W-01Breastbreast invasive carcinomaFemale>=65III/IVHormone TherapyexemestaneSD
TBC1D5SNVMissense_Mutationc.2047G>Cp.Glu683Glnp.E683QQ92609protein_codingdeleterious(0)probably_damaging(0.981)TCGA-C8-A12T-01Breastbreast invasive carcinomaFemale<65I/IIUnknownUnknownSD
TBC1D5SNVMissense_Mutationc.819N>Cp.Gln273Hisp.Q273HQ92609protein_codingtolerated(0.1)possibly_damaging(0.747)TCGA-D8-A1JA-01Breastbreast invasive carcinomaFemale<65III/IVChemotherapyadriamycinPD
TBC1D5SNVMissense_Mutationc.2021C>Tp.Ser674Phep.S674FQ92609protein_codingdeleterious(0)possibly_damaging(0.656)TCGA-2W-A8YY-01Cervixcervical & endocervical cancerFemale<65I/IIChemotherapycisplatinCR
TBC1D5SNVMissense_Mutationnovelc.1423C>Tp.Pro475Serp.P475SQ92609protein_codingtolerated(0.99)benign(0.001)TCGA-2W-A8YY-01Cervixcervical & endocervical cancerFemale<65I/IIChemotherapycisplatinCR
TBC1D5SNVMissense_Mutationc.100N>Cp.Asp34Hisp.D34HQ92609protein_codingdeleterious_low_confidence(0.05)benign(0.215)TCGA-4J-AA1J-01Cervixcervical & endocervical cancerFemale<65I/IIUnknownUnknownSD
TBC1D5SNVMissense_Mutationc.1376N>Gp.Asn459Serp.N459SQ92609protein_codingtolerated(1)benign(0.003)TCGA-C5-A1BN-01Cervixcervical & endocervical cancerFemale<65I/IIChemotherapycisplatinPD
TBC1D5SNVMissense_Mutationc.2291N>Ap.Arg764Lysp.R764KQ92609protein_codingtolerated_low_confidence(0.36)benign(0)TCGA-C5-A1BQ-01Cervixcervical & endocervical cancerFemale>=65III/IVChemotherapycisplatinCR
TBC1D5SNVMissense_Mutationc.34N>Gp.Leu12Valp.L12VQ92609protein_codingdeleterious_low_confidence(0.01)probably_damaging(0.994)TCGA-C5-A1BQ-01Cervixcervical & endocervical cancerFemale>=65III/IVChemotherapycisplatinCR
TBC1D5SNVMissense_Mutationc.2291N>Ap.Arg764Lysp.R764KQ92609protein_codingtolerated_low_confidence(0.36)benign(0)TCGA-C5-A3HL-01Cervixcervical & endocervical cancerFemale>=65I/IIUnknownUnknownSD
Page: 1 2 3 4 5 6 7 8 9 

Top

Related drugs of malignant transformation related genes

check buttonIdentification of chemicals and drugs interact with genes involved in malignant transfromation
(DGIdb 4.0)
Entrez IDSymbolCategoryInteraction TypesDrug Claim NameDrug NamePMIDs
Page: 1