Schematic overview of the cellular and molecular mechanisms involved in the cancer progression, including the proposed cellular and molecular mechanisms in cancer cells trajectory. AT1: alveolar type 1 cells; AT2: alveolar type 2 cells; AAH: atypical adenomatous hyperplasia; AIS: adenocarcinoma in situ; MIA: minimally invasive adenocarcinoma; IA: invasive adenocarcinoma; EMT: epithelial-mesenchymal transition

Home

Download

Statistics

Help

Contact

Center for Computational Systems Medicine
leaf

Gene summary

leaf

Malignant transformation analysis

leaf

Malignant transformation related pathway analysis

leaf

Cell-cell communication analysis

leaf

Single-cell gene regulatory network inference analysis

leaf

Somatic mutation of malignant transformation related genes

leaf

Related drugs of malignant transformation related genes

Gene: SRPK2

Gene summary for SRPK2

check button Gene summary.

Gene informationSpeciesHuman
Gene symbol

SRPK2

Gene ID

6733

Gene nameSRSF protein kinase 2
Gene AliasSFRSK2
Cytomap7q22.3
Gene Typeprotein-coding
GO ID

GO:0000245

UniProtAcc

A0A024R704


Top

Malignant transformation analysis

check button Identification of the aberrant gene expression in precancerous and cancerous lesions by comparing the gene expression of stem-like cells in diseased tissues with normal stem cells
check button Malignant transformation involving gene list.
Entrez IDSymbolReplicatesSpeciesOrganTissueAdj P-valueLog2FCMalignancy
6733SRPK2CA_HPV_1HumanCervixCC1.32e-02-1.40e-010.0264
6733SRPK2CCI_1HumanCervixCC6.86e-211.69e+000.528
6733SRPK2CCI_2HumanCervixCC3.73e-081.34e+000.5249
6733SRPK2CCI_3HumanCervixCC2.46e-221.39e+000.516
6733SRPK2HTA11_3410_2000001011HumanColorectumAD2.41e-05-2.80e-010.0155
6733SRPK2A001-C-207HumanColorectumFAP7.81e-04-2.37e-010.1278
6733SRPK2A015-C-203HumanColorectumFAP1.45e-33-5.26e-01-0.1294
6733SRPK2A015-C-204HumanColorectumFAP5.80e-09-4.68e-01-0.0228
6733SRPK2A014-C-040HumanColorectumFAP3.90e-04-3.30e-01-0.1184
6733SRPK2A002-C-201HumanColorectumFAP7.17e-13-2.58e-010.0324
6733SRPK2A001-C-119HumanColorectumFAP3.90e-05-2.63e-01-0.1557
6733SRPK2A001-C-108HumanColorectumFAP6.11e-16-3.63e-01-0.0272
6733SRPK2A002-C-205HumanColorectumFAP3.38e-25-3.80e-01-0.1236
6733SRPK2A001-C-104HumanColorectumFAP6.07e-03-3.21e-010.0184
6733SRPK2A015-C-005HumanColorectumFAP9.12e-05-2.46e-01-0.0336
6733SRPK2A015-C-006HumanColorectumFAP7.24e-18-4.82e-01-0.0994
6733SRPK2A015-C-106HumanColorectumFAP4.79e-11-3.02e-01-0.0511
6733SRPK2A002-C-114HumanColorectumFAP3.78e-21-4.28e-01-0.1561
6733SRPK2A015-C-104HumanColorectumFAP9.85e-32-4.82e-01-0.1899
6733SRPK2A001-C-014HumanColorectumFAP1.94e-11-3.35e-010.0135
Page: 1 2 3 4 5 6 7 8 9 10 11 12 

check button Transcriptomic changes along malignancy continuum.
TissueExpression DynamicsAbbreviation
CervixThe image shows the transcriptomic changes along malignancy continuum.log2FC in expression of this searched gene in stem-like cells from each diseased tissue sample relative to stem-like cells in normal samples in each tissue plotted against the malignancy continuum. Samples are colored based on if they are from different disease stage.CC: Cervix cancer
HSIL_HPV: HPV-infected high-grade squamous intraepithelial lesions
N_HPV: HPV-infected normal cervix
Colorectum (GSE201348)The image shows the transcriptomic changes along malignancy continuum.log2FC in expression of this searched gene in stem-like cells from each diseased tissue sample relative to stem-like cells in normal samples in each tissue plotted against the malignancy continuum. Samples are colored based on if they are from different disease stage.FAP: Familial adenomatous polyposis
CRC: Colorectal cancer
Colorectum (HTA11)The image shows the transcriptomic changes along malignancy continuum.log2FC in expression of this searched gene in stem-like cells from each diseased tissue sample relative to stem-like cells in normal samples in each tissue plotted against the malignancy continuum. Samples are colored based on if they are from different disease stage.AD: Adenomas
SER: Sessile serrated lesions
MSI-H: Microsatellite-high colorectal cancer
MSS: Microsatellite stable colorectal cancer
EndometriumThe image shows the transcriptomic changes along malignancy continuum.log2FC in expression of this searched gene in stem-like cells from each diseased tissue sample relative to stem-like cells in normal samples in each tissue plotted against the malignancy continuum. Samples are colored based on if they are from different disease stage.AEH: Atypical endometrial hyperplasia
EEC: Endometrioid Cancer
EsophagusThe image shows the transcriptomic changes along malignancy continuum.log2FC in expression of this searched gene in stem-like cells from each diseased tissue sample relative to stem-like cells in normal samples in each tissue plotted against the malignancy continuum. Samples are colored based on if they are from different disease stage.
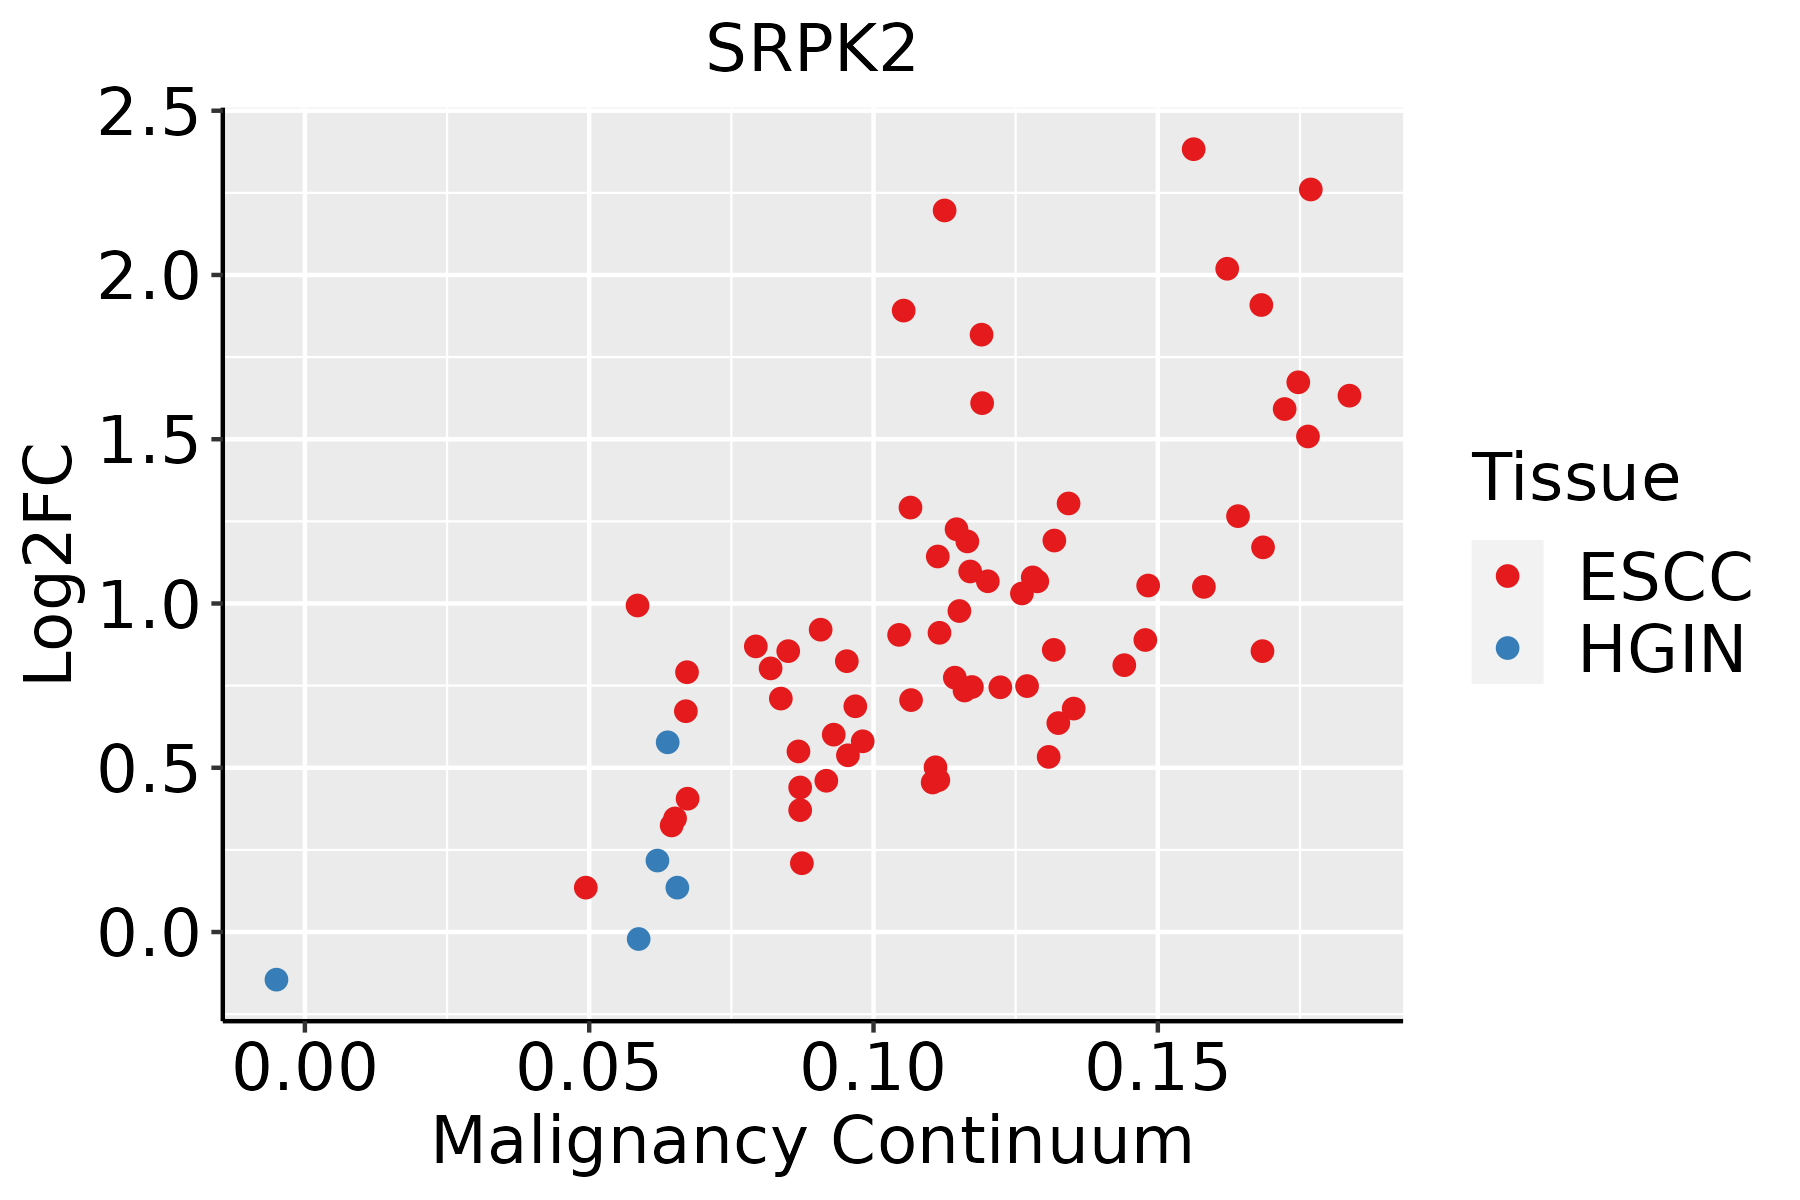
ESCC: Esophageal squamous cell carcinoma
HGIN: High-grade intraepithelial neoplasias
LGIN: Low-grade intraepithelial neoplasias
LiverThe image shows the transcriptomic changes along malignancy continuum.log2FC in expression of this searched gene in stem-like cells from each diseased tissue sample relative to stem-like cells in normal samples in each tissue plotted against the malignancy continuum. Samples are colored based on if they are from different disease stage.
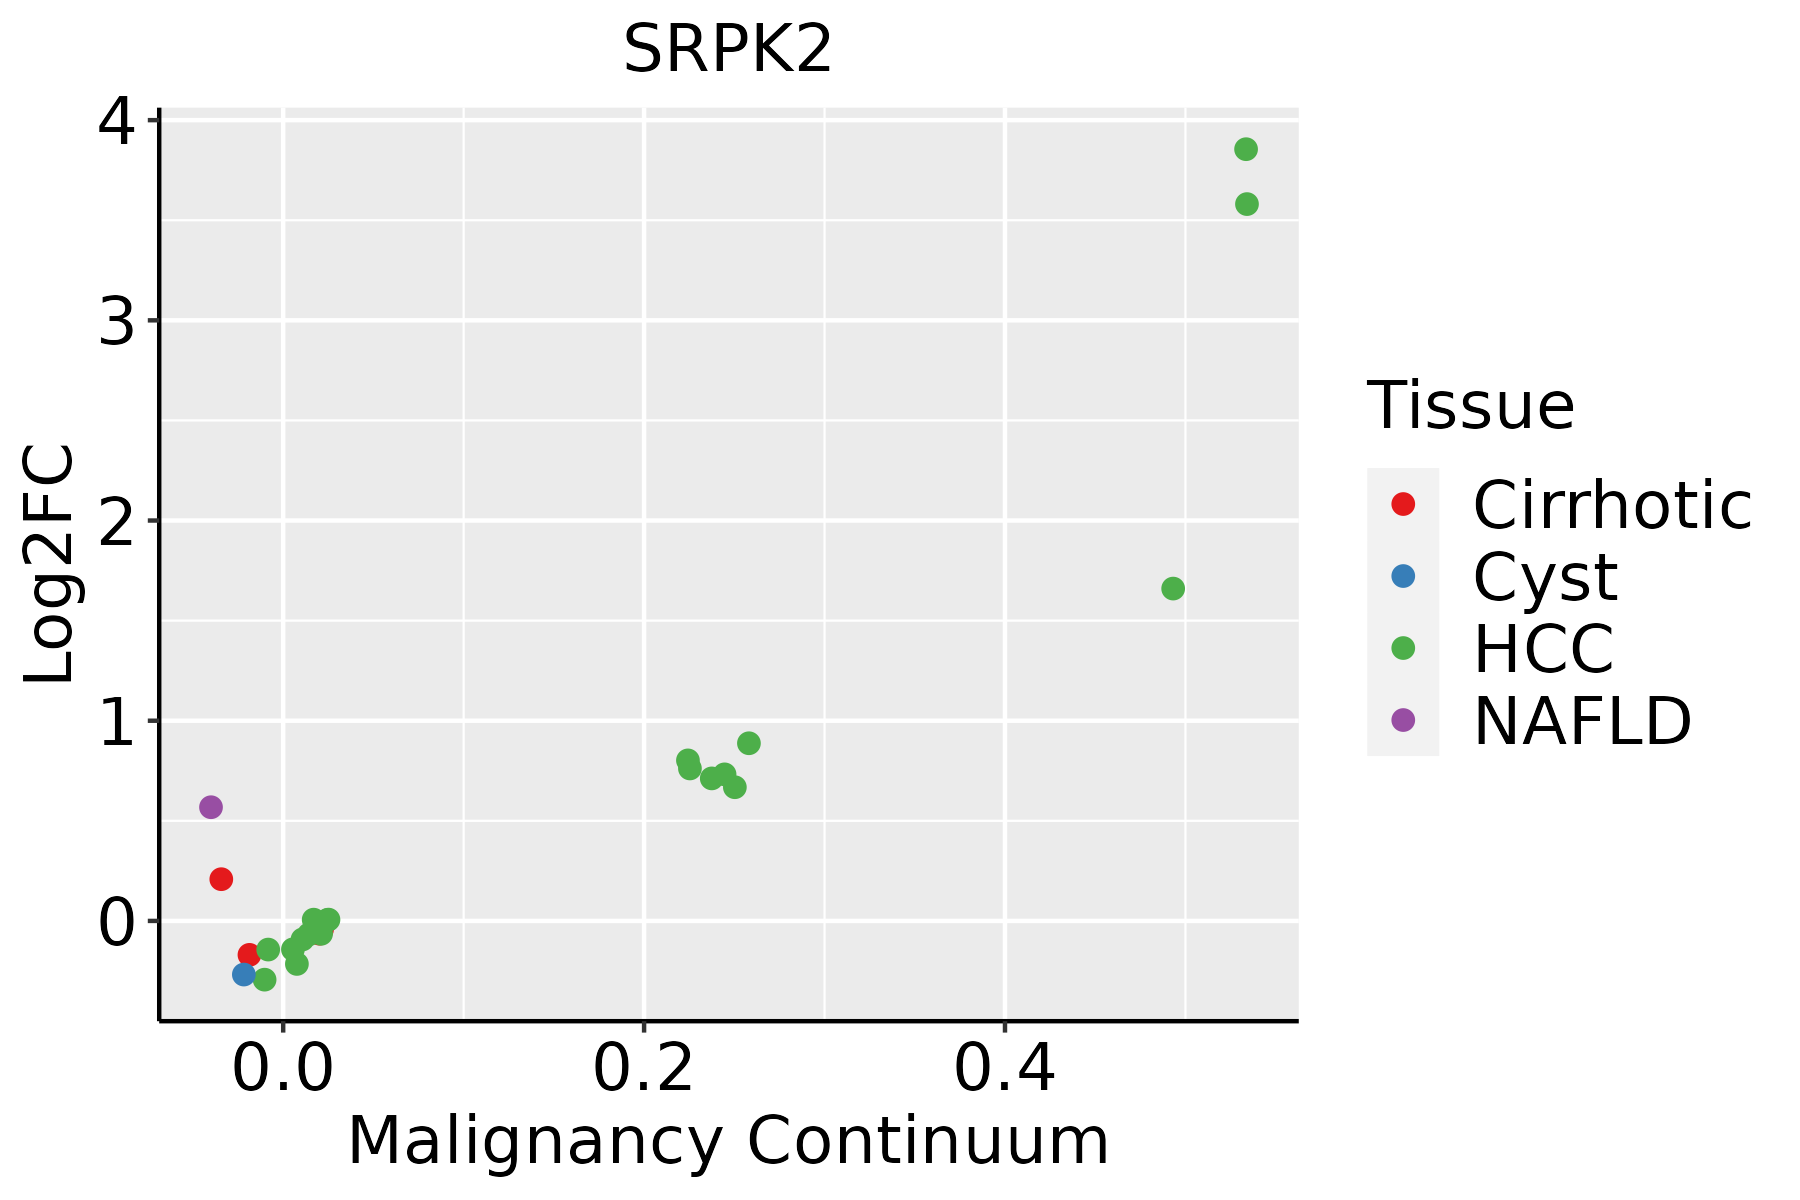
HCC: Hepatocellular carcinoma
NAFLD: Non-alcoholic fatty liver disease
LungThe image shows the transcriptomic changes along malignancy continuum.log2FC in expression of this searched gene in stem-like cells from each diseased tissue sample relative to stem-like cells in normal samples in each tissue plotted against the malignancy continuum. Samples are colored based on if they are from different disease stage.AAH: Atypical adenomatous hyperplasia
AIS: Adenocarcinoma in situ
IAC: Invasive lung adenocarcinoma
MIA: Minimally invasive adenocarcinoma
Oral CavityThe image shows the transcriptomic changes along malignancy continuum.log2FC in expression of this searched gene in stem-like cells from each diseased tissue sample relative to stem-like cells in normal samples in each tissue plotted against the malignancy continuum. Samples are colored based on if they are from different disease stage.EOLP: Erosive Oral lichen planus
LP: leukoplakia
NEOLP: Non-erosive oral lichen planus
OSCC: Oral squamous cell carcinoma
ProstateThe image shows the transcriptomic changes along malignancy continuum.log2FC in expression of this searched gene in stem-like cells from each diseased tissue sample relative to stem-like cells in normal samples in each tissue plotted against the malignancy continuum. Samples are colored based on if they are from different disease stage.
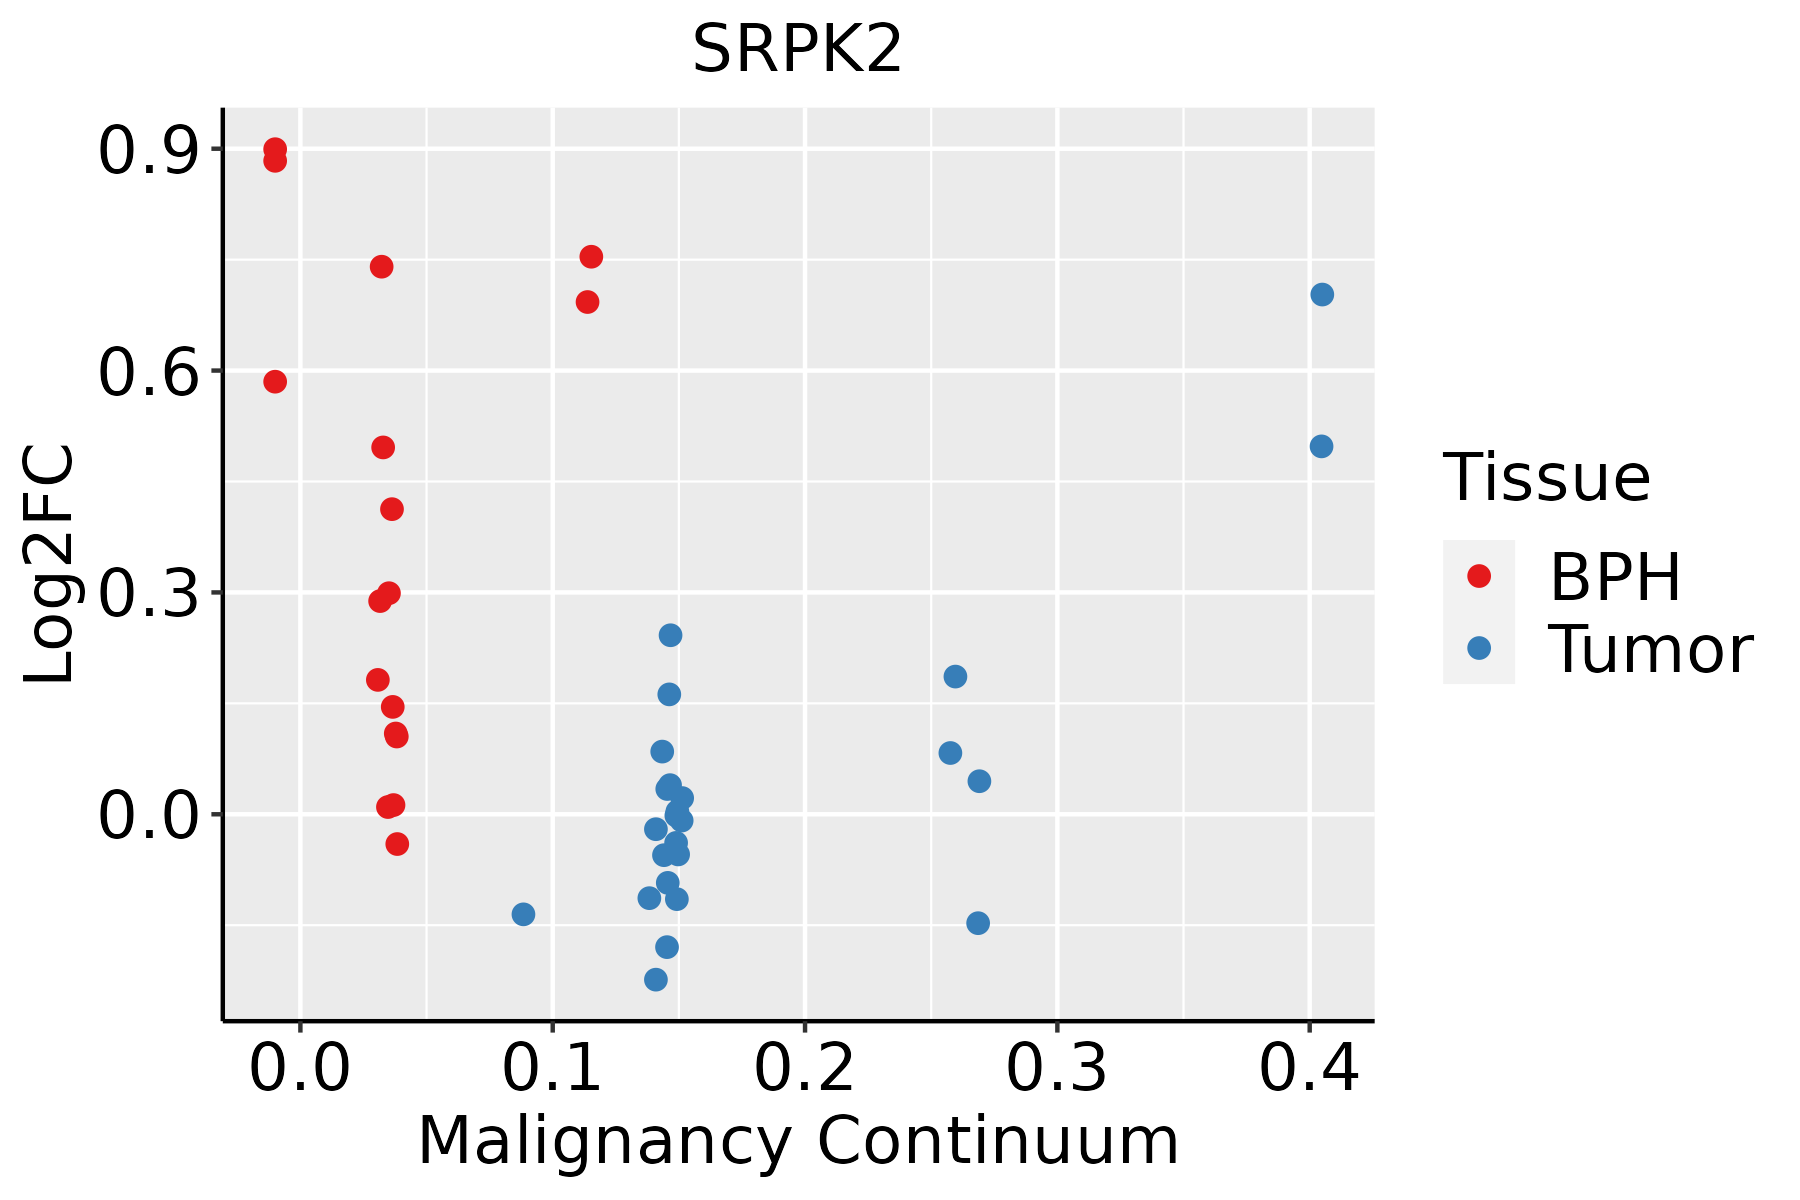
BPH: Benign Prostatic Hyperplasia
SkinThe image shows the transcriptomic changes along malignancy continuum.log2FC in expression of this searched gene in stem-like cells from each diseased tissue sample relative to stem-like cells in normal samples in each tissue plotted against the malignancy continuum. Samples are colored based on if they are from different disease stage.
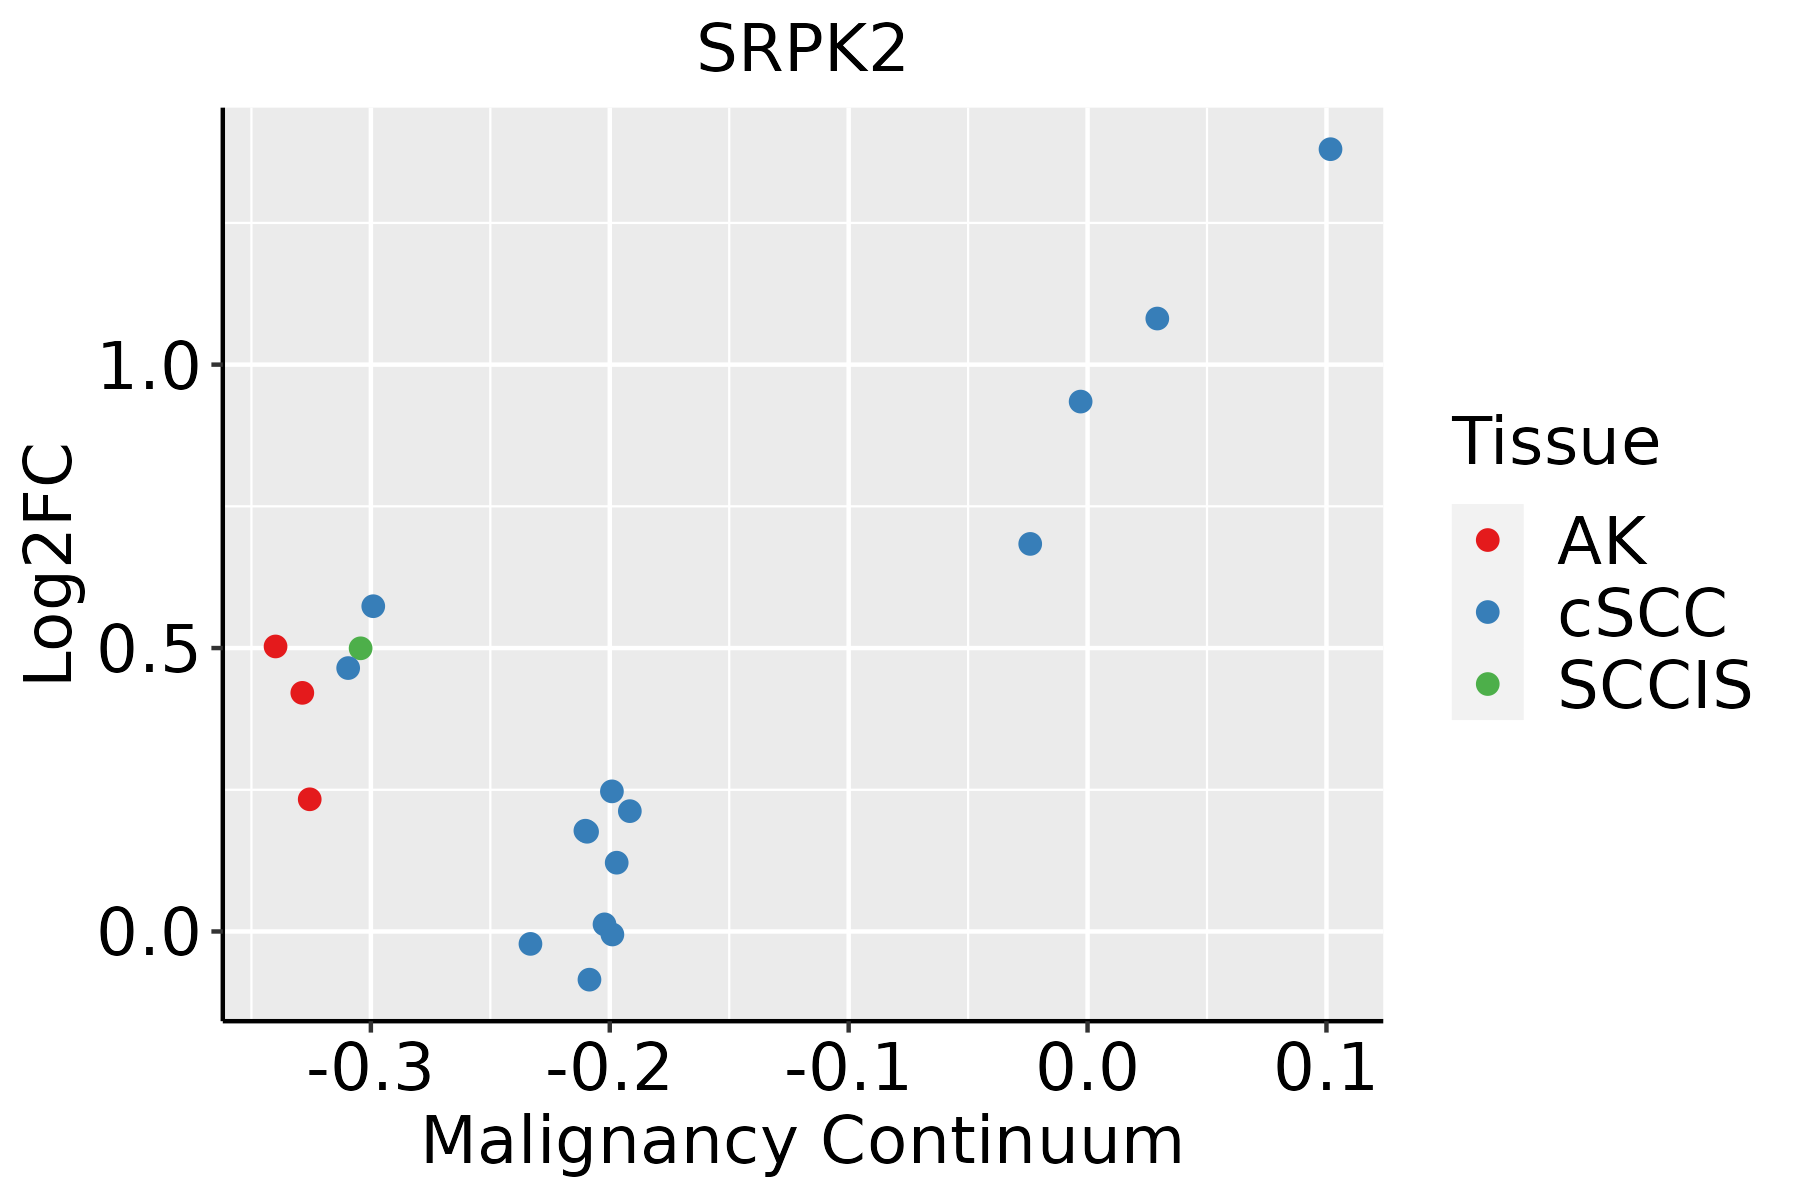
AK: Actinic keratosis
cSCC: Cutaneous squamous cell carcinoma
SCCIS:squamous cell carcinoma in situ
ThyroidThe image shows the transcriptomic changes along malignancy continuum.log2FC in expression of this searched gene in stem-like cells from each diseased tissue sample relative to stem-like cells in normal samples in each tissue plotted against the malignancy continuum. Samples are colored based on if they are from different disease stage.ATC: Anaplastic thyroid cancer
HT: Hashimoto's thyroiditis
PTC: Papillary thyroid cancer
∗log2FC in expression of this searched gene in stem-like cells from each diseased tissue sample relative to stem-like cells in normal samples in each tissue plotted against the malignancy continuum. Samples are colored based on if they are from different disease stage.

Top

Malignant transformation related pathway analysis

check buttonFind out the enriched GO biological processes and KEGG pathways involved in transition from healthy to precancer to cancer
check button Figure of enriched GO biological processes.
TissueDisease StageEnriched GO biological Processes
ColorectumADGO analysis - Figure of enriched GO biological processes: Top 15 enriched GO BP terms are showed in the bar plot of each disease state in each tissue. Each row represents a significant GO biological process which is colored according to the -log10(p.adjust).
ColorectumSERGO analysis - Figure of enriched GO biological processes: Top 15 enriched GO BP terms are showed in the bar plot of each disease state in each tissue. Each row represents a significant GO biological process which is colored according to the -log10(p.adjust).
ColorectumMSSGO analysis - Figure of enriched GO biological processes: Top 15 enriched GO BP terms are showed in the bar plot of each disease state in each tissue. Each row represents a significant GO biological process which is colored according to the -log10(p.adjust).
ColorectumMSI-HGO analysis - Figure of enriched GO biological processes: Top 15 enriched GO BP terms are showed in the bar plot of each disease state in each tissue. Each row represents a significant GO biological process which is colored according to the -log10(p.adjust).
ColorectumFAPGO analysis - Figure of enriched GO biological processes: Top 15 enriched GO BP terms are showed in the bar plot of each disease state in each tissue. Each row represents a significant GO biological process which is colored according to the -log10(p.adjust).
∗Top 15 enriched GO BP terms are showed in the bar plot of each disease state in each tissue. Each row represents a significant GO biological process which is colored according to the -log10(p.adjust).
Page: 1 2 3 4 5 6 7 8 9 

check button Enriched GO biological processes.
GO IDTissueDisease StageDescriptionGene RatioBg Ratiopvaluep.adjustCount
GO:1901216111EsophagusESCCpositive regulation of neuron death65/855297/187231.76e-051.56e-0465
GO:004507015EsophagusESCCpositive regulation of viral genome replication24/855230/187231.27e-048.67e-0424
GO:0043525110EsophagusESCCpositive regulation of neuron apoptotic process40/855258/187232.83e-041.71e-0340
GO:004352317EsophagusESCCregulation of neuron apoptotic process122/8552212/187233.21e-041.90e-03122
GO:000024514EsophagusESCCspliceosomal complex assembly48/855279/187234.93e-031.89e-0248
GO:19033116LiverNAFLDregulation of mRNA metabolic process66/1882288/187231.06e-102.96e-0866
GO:00160327LiverNAFLDviral process80/1882415/187237.71e-091.07e-0680
GO:00181055LiverNAFLDpeptidyl-serine phosphorylation63/1882315/187237.45e-086.60e-0663
GO:00182094LiverNAFLDpeptidyl-serine modification64/1882338/187234.65e-072.89e-0564
GO:00434847LiverNAFLDregulation of RNA splicing35/1882148/187231.14e-065.55e-0535
GO:00506846LiverNAFLDregulation of mRNA processing33/1882137/187231.47e-066.73e-0533
GO:00480247LiverNAFLDregulation of mRNA splicing, via spliceosome26/1882101/187235.10e-061.89e-0426
GO:00190587LiverNAFLDviral life cycle57/1882317/187231.00e-053.18e-0457
GO:00226137LiverNAFLDribonucleoprotein complex biogenesis76/1882463/187231.19e-053.67e-0476
GO:00226187LiverNAFLDribonucleoprotein complex assembly42/1882220/187233.40e-058.80e-0442
GO:00083807LiverNAFLDRNA splicing70/1882434/187234.62e-051.10e-0370
GO:00718267LiverNAFLDribonucleoprotein complex subunit organization42/1882227/187237.21e-051.51e-0342
GO:00450705LiverNAFLDpositive regulation of viral genome replication10/188230/187234.67e-046.74e-0310
GO:00190797LiverNAFLDviral genome replication26/1882131/187235.40e-047.38e-0326
GO:00003777LiverNAFLDRNA splicing, via transesterification reactions with bulged adenosine as nucleophile51/1882320/187236.21e-048.18e-0351
Page: 1 2 3 4 5 6 7 8 9 10 11 12 13 14 15 16 17 18 19 20 21 22 23 24 25 26 27 28 29 30 31 32 33 34 35 36 

check button Enriched KEGG pathways.
Pathway IDTissueDisease StageDescriptionGene RatioBg Ratiopvaluep.adjustqvalueCount
Page: 1 

Top

Cell-cell communication analysis

check buttonIdentification of potential cell-cell interactions between two cell types and their ligand-receptor pairs for different disease states
LigandReceptorLRpairPathwayTissueDisease Stage
Page: 1 

Top

Single-cell gene regulatory network inference analysis

check buttonFind out the significant the regulons (TFs) and the target genes of each regulon across cell types for different disease states
TFCell TypeTissueDisease StageTarget GeneRSSRegulon Activity
∗The dot plots of a searched regulon are shown for all cell subpopulations in each disease state of each tissue based on the regulon specific score inferred using pySCENIC and by calculating the average expression.
Page: 1 

Top

Somatic mutation of malignant transformation related genes

check buttonAnnotation of somatic variants for genes involved in malignant transformation
Hugo SymbolVariant ClassVariant ClassificationdbSNP RSHGVScHGVSpHGVSp ShortSWISSPROTBIOTYPESIFTPolyPhenTumor Sample BarcodeTissueHistologySexAgeStageTherapy TypesDrugsOutcome
SRPK2SNVMissense_Mutationnovelc.736N>Ap.Glu246Lysp.E246KP78362protein_codingdeleterious(0.02)probably_damaging(0.986)TCGA-5L-AAT1-01Breastbreast invasive carcinomaFemale<65III/IVHormone TherapyletrozolSD
SRPK2SNVMissense_Mutationc.536N>Cp.Val179Alap.V179AP78362protein_codingdeleterious(0)probably_damaging(0.996)TCGA-BH-A18G-01Breastbreast invasive carcinomaFemale>=65I/IIUnknownUnknownSD
SRPK2SNVMissense_Mutationc.406N>Ap.Glu136Lysp.E136KP78362protein_codingdeleterious(0)probably_damaging(0.996)TCGA-GM-A2DH-01Breastbreast invasive carcinomaFemale<65I/IIChemotherapytaxolCR
SRPK2insertionFrame_Shift_Insnovelc.1735_1736insTAGAGAGTGCTGTGTGGAGAp.Trp579LeufsTer39p.W579Lfs*39P78362protein_codingTCGA-AN-A0FX-01Breastbreast invasive carcinomaFemale<65I/IIUnknownUnknownSD
SRPK2insertionNonsense_Mutationnovelc.964_965insATTGAATGTAAGTTGCCTTGGTCATCACAATCCATGTAAAGGAGp.Pro322HisfsTer2p.P322Hfs*2P78362protein_codingTCGA-BH-A0HK-01Breastbreast invasive carcinomaFemale>=65I/IIHormone TherapyarimidexSD
SRPK2SNVMissense_Mutationc.169N>Cp.Glu57Glnp.E57QP78362protein_codingdeleterious(0.04)probably_damaging(0.994)TCGA-EK-A2H0-01Cervixcervical & endocervical cancerFemale<65I/IIChemotherapycisplatinCR
SRPK2SNVMissense_Mutationc.57G>Tp.Glu19Aspp.E19DP78362protein_codingtolerated(0.33)benign(0.388)TCGA-FU-A3HZ-01Cervixcervical & endocervical cancerFemale<65I/IIChemotherapycisplatinCR
SRPK2SNVMissense_Mutationc.277N>Tp.His93Tyrp.H93YP78362protein_codingdeleterious(0)probably_damaging(0.977)TCGA-IR-A3LI-01Cervixcervical & endocervical cancerFemale<65I/IIChemotherapycisplatinCR
SRPK2SNVMissense_Mutationnovelc.766N>Tp.Pro256Serp.P256SP78362protein_codingdeleterious(0.01)probably_damaging(0.998)TCGA-VS-A958-01Cervixcervical & endocervical cancerFemale<65I/IIChemotherapycisplatinCR
SRPK2SNVMissense_Mutationc.169N>Cp.Glu57Glnp.E57QP78362protein_codingdeleterious(0.04)probably_damaging(0.994)TCGA-ZJ-A8QQ-01Cervixcervical & endocervical cancerFemale<65I/IIChemotherapycisplatinSD
Page: 1 2 3 4 5 6 7 

Top

Related drugs of malignant transformation related genes

check buttonIdentification of chemicals and drugs interact with genes involved in malignant transfromation
(DGIdb 4.0)
Entrez IDSymbolCategoryInteraction TypesDrug Claim NameDrug NamePMIDs
6733SRPK2SERINE THREONINE KINASE, KINASE, ENZYME, DRUGGABLE GENOMEinhibitor249565786
Page: 1