
|
|||||
|
 | |
| |
| |
| |
| |
| |
|
Gene: SOCS1 |
Gene summary for SOCS1 |
| Gene information | Species | Human | Gene symbol | SOCS1 | Gene ID | 8651 |
| Gene name | suppressor of cytokine signaling 1 | |
| Gene Alias | AISIMD | |
| Cytomap | 16p13.13 | |
| Gene Type | protein-coding | GO ID | GO:0001101 | UniProtAcc | O15524 |
Top |
Malignant transformation analysis |
| Identification of the aberrant gene expression in precancerous and cancerous lesions by comparing the gene expression of stem-like cells in diseased tissues with normal stem cells |
| Entrez ID | Symbol | Replicates | Species | Organ | Tissue | Adj P-value | Log2FC | Malignancy |
| 8651 | SOCS1 | HSIL_HPV_2 | Human | Cervix | HSIL_HPV | 5.25e-12 | -4.36e-01 | 0.0208 |
| 8651 | SOCS1 | CCI_1 | Human | Cervix | CC | 2.11e-03 | -5.07e-01 | 0.528 |
| 8651 | SOCS1 | CCI_3 | Human | Cervix | CC | 3.48e-02 | -4.75e-01 | 0.516 |
| 8651 | SOCS1 | CCII_1 | Human | Cervix | CC | 6.78e-08 | -5.07e-01 | 0.3249 |
| 8651 | SOCS1 | Tumor | Human | Cervix | CC | 2.18e-05 | -3.40e-01 | 0.1241 |
| 8651 | SOCS1 | sample3 | Human | Cervix | CC | 2.38e-05 | -2.86e-01 | 0.1387 |
| 8651 | SOCS1 | H2 | Human | Cervix | HSIL_HPV | 2.42e-06 | -3.73e-01 | 0.0632 |
| 8651 | SOCS1 | L1 | Human | Cervix | CC | 2.31e-06 | -4.93e-01 | 0.0802 |
| 8651 | SOCS1 | T3 | Human | Cervix | CC | 2.02e-04 | -3.06e-01 | 0.1389 |
| 8651 | SOCS1 | LZE20T | Human | Esophagus | ESCC | 2.84e-14 | 7.87e-01 | 0.0662 |
| 8651 | SOCS1 | LZE22T | Human | Esophagus | ESCC | 5.53e-04 | 7.45e-01 | 0.068 |
| 8651 | SOCS1 | LZE24T | Human | Esophagus | ESCC | 1.18e-12 | 5.14e-01 | 0.0596 |
| 8651 | SOCS1 | LZE21T | Human | Esophagus | ESCC | 1.72e-06 | 9.04e-01 | 0.0655 |
| 8651 | SOCS1 | P1T-E | Human | Esophagus | ESCC | 1.43e-15 | 1.70e+00 | 0.0875 |
| 8651 | SOCS1 | P2T-E | Human | Esophagus | ESCC | 2.54e-85 | 1.65e+00 | 0.1177 |
| 8651 | SOCS1 | P4T-E | Human | Esophagus | ESCC | 3.74e-53 | 1.54e+00 | 0.1323 |
| 8651 | SOCS1 | P5T-E | Human | Esophagus | ESCC | 7.79e-40 | 1.03e+00 | 0.1327 |
| 8651 | SOCS1 | P8T-E | Human | Esophagus | ESCC | 1.74e-07 | 4.17e-01 | 0.0889 |
| 8651 | SOCS1 | P9T-E | Human | Esophagus | ESCC | 5.40e-16 | 5.92e-01 | 0.1131 |
| 8651 | SOCS1 | P10T-E | Human | Esophagus | ESCC | 7.06e-33 | 7.21e-01 | 0.116 |
| Page: 1 2 3 4 5 6 |
| Tissue | Expression Dynamics | Abbreviation |
| Cervix | 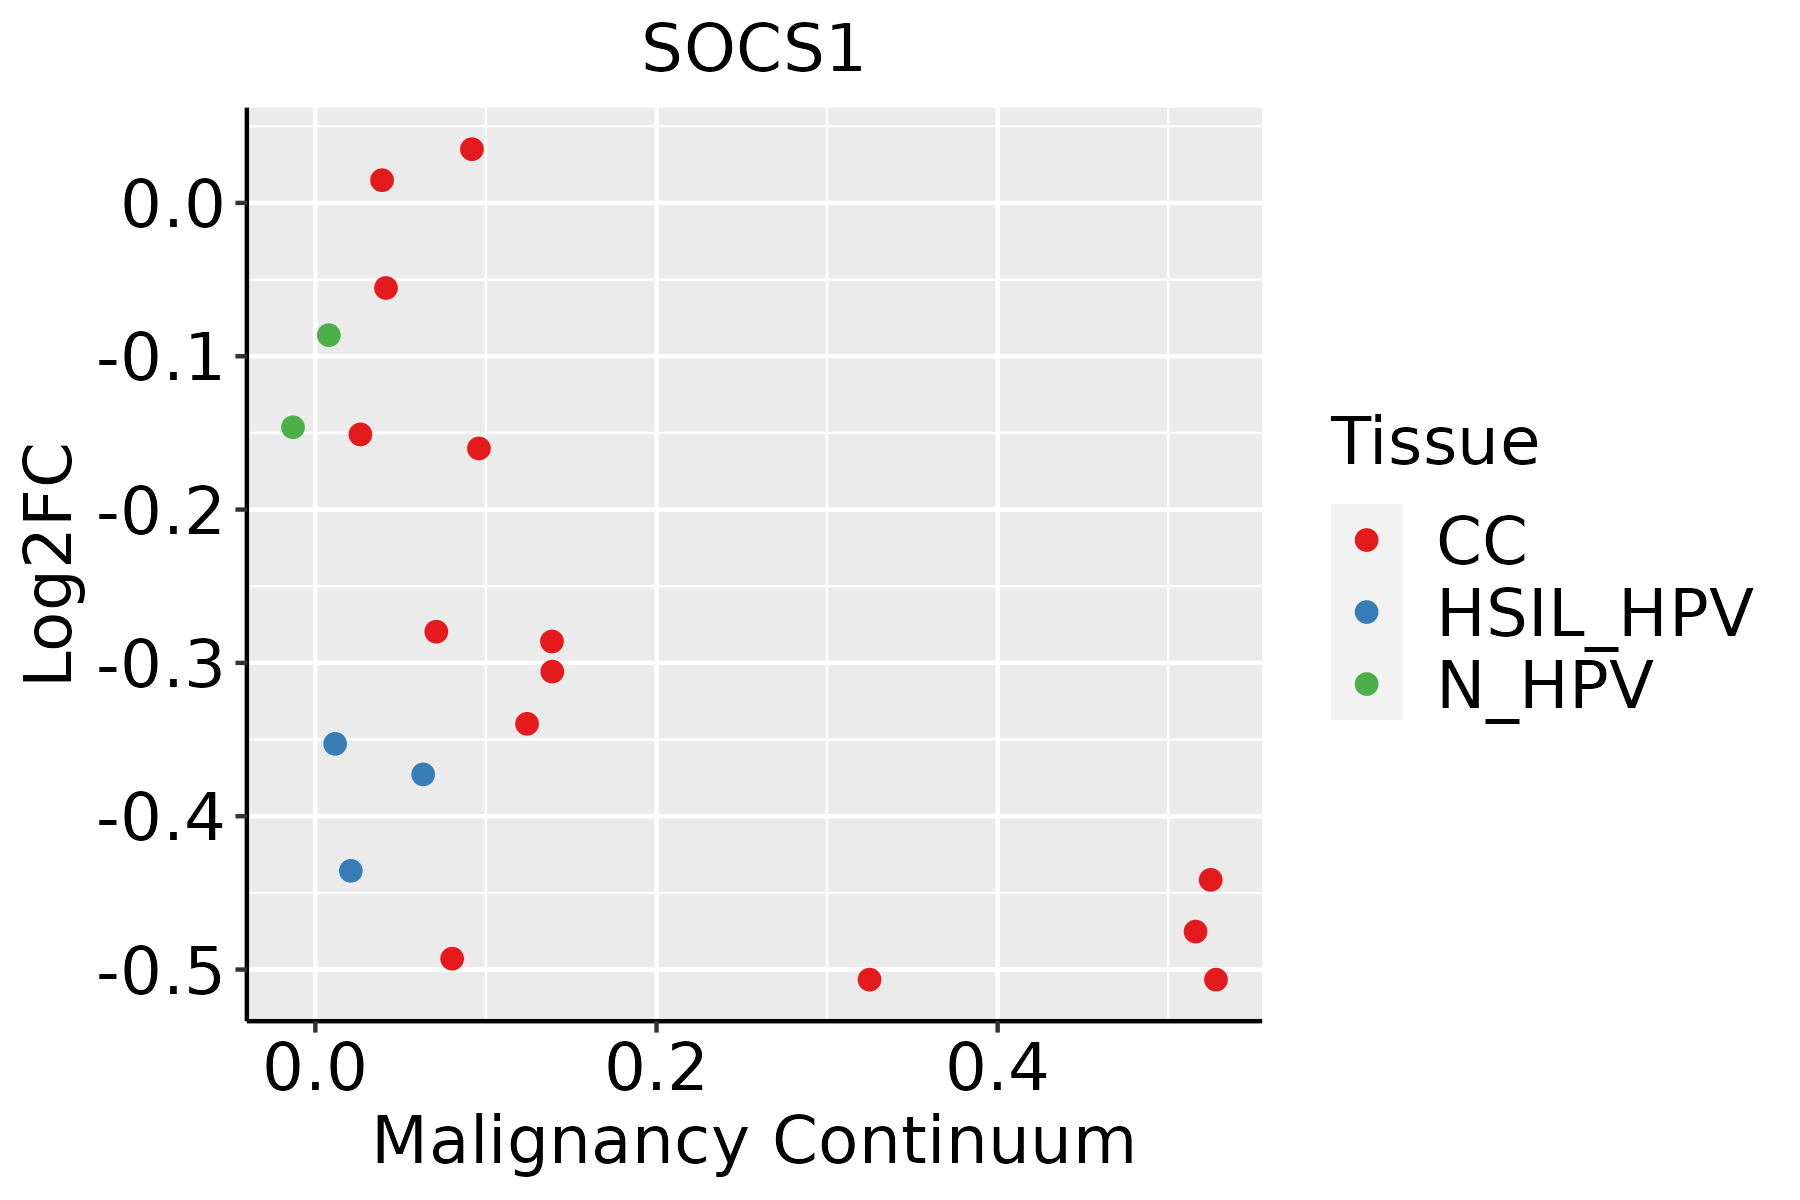 | CC: Cervix cancer |
| HSIL_HPV: HPV-infected high-grade squamous intraepithelial lesions | ||
| N_HPV: HPV-infected normal cervix | ||
| Esophagus | 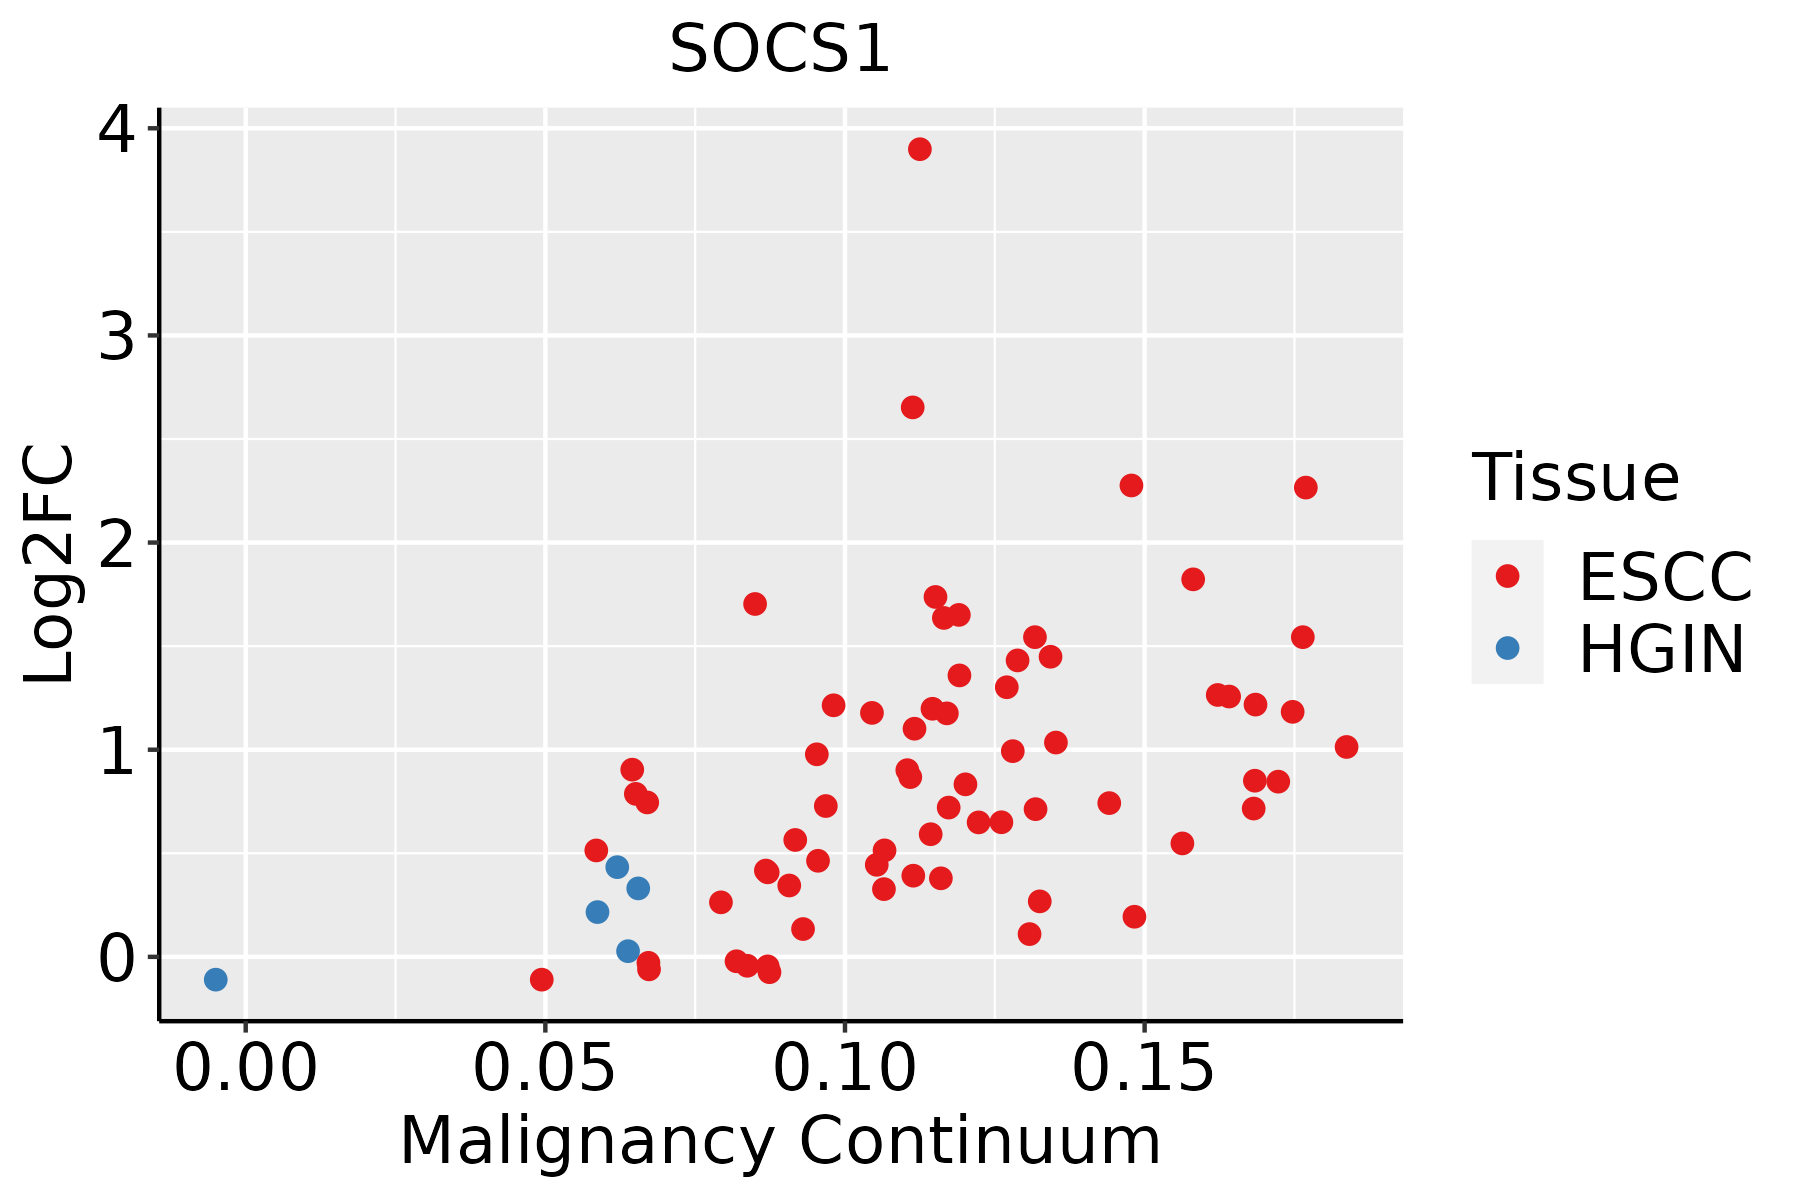 | ESCC: Esophageal squamous cell carcinoma |
| HGIN: High-grade intraepithelial neoplasias | ||
| LGIN: Low-grade intraepithelial neoplasias | ||
| Liver | 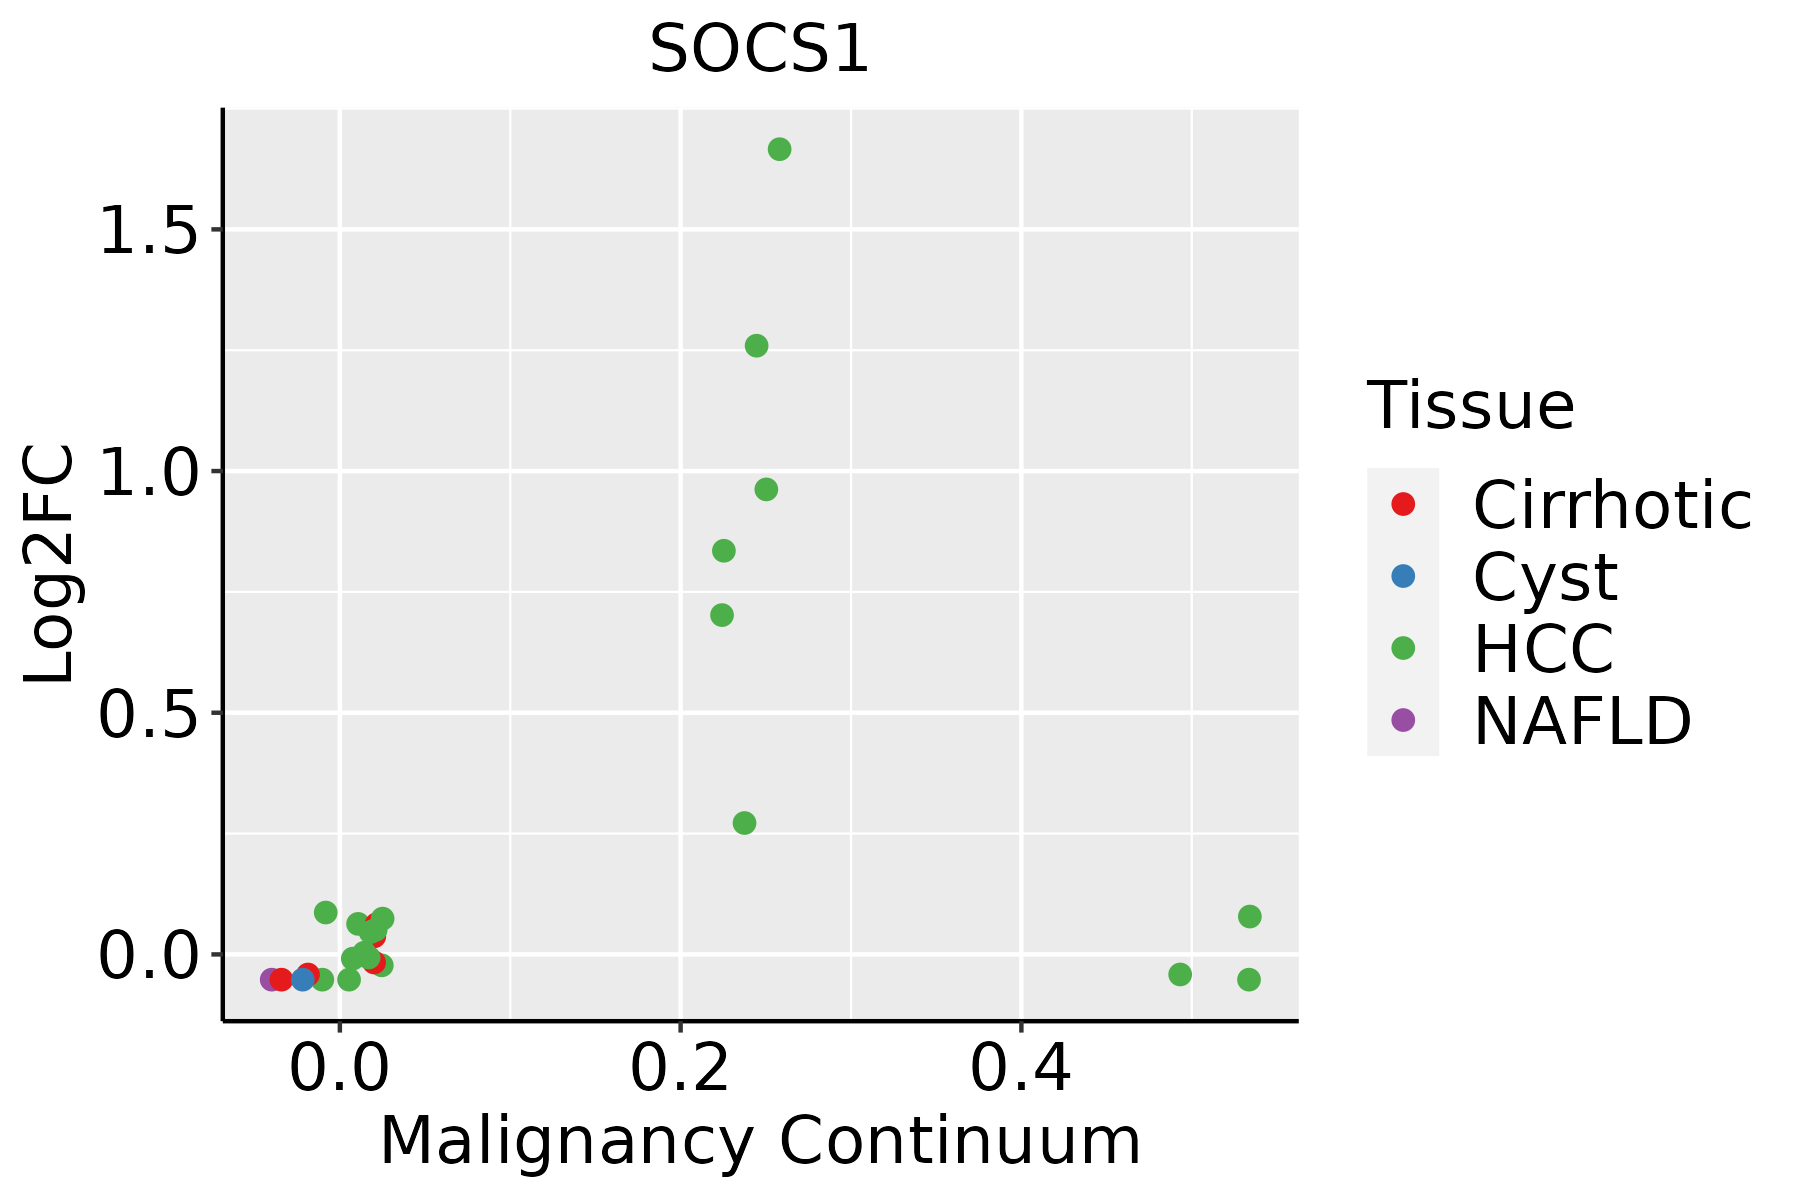 | HCC: Hepatocellular carcinoma |
| NAFLD: Non-alcoholic fatty liver disease | ||
| Oral Cavity | 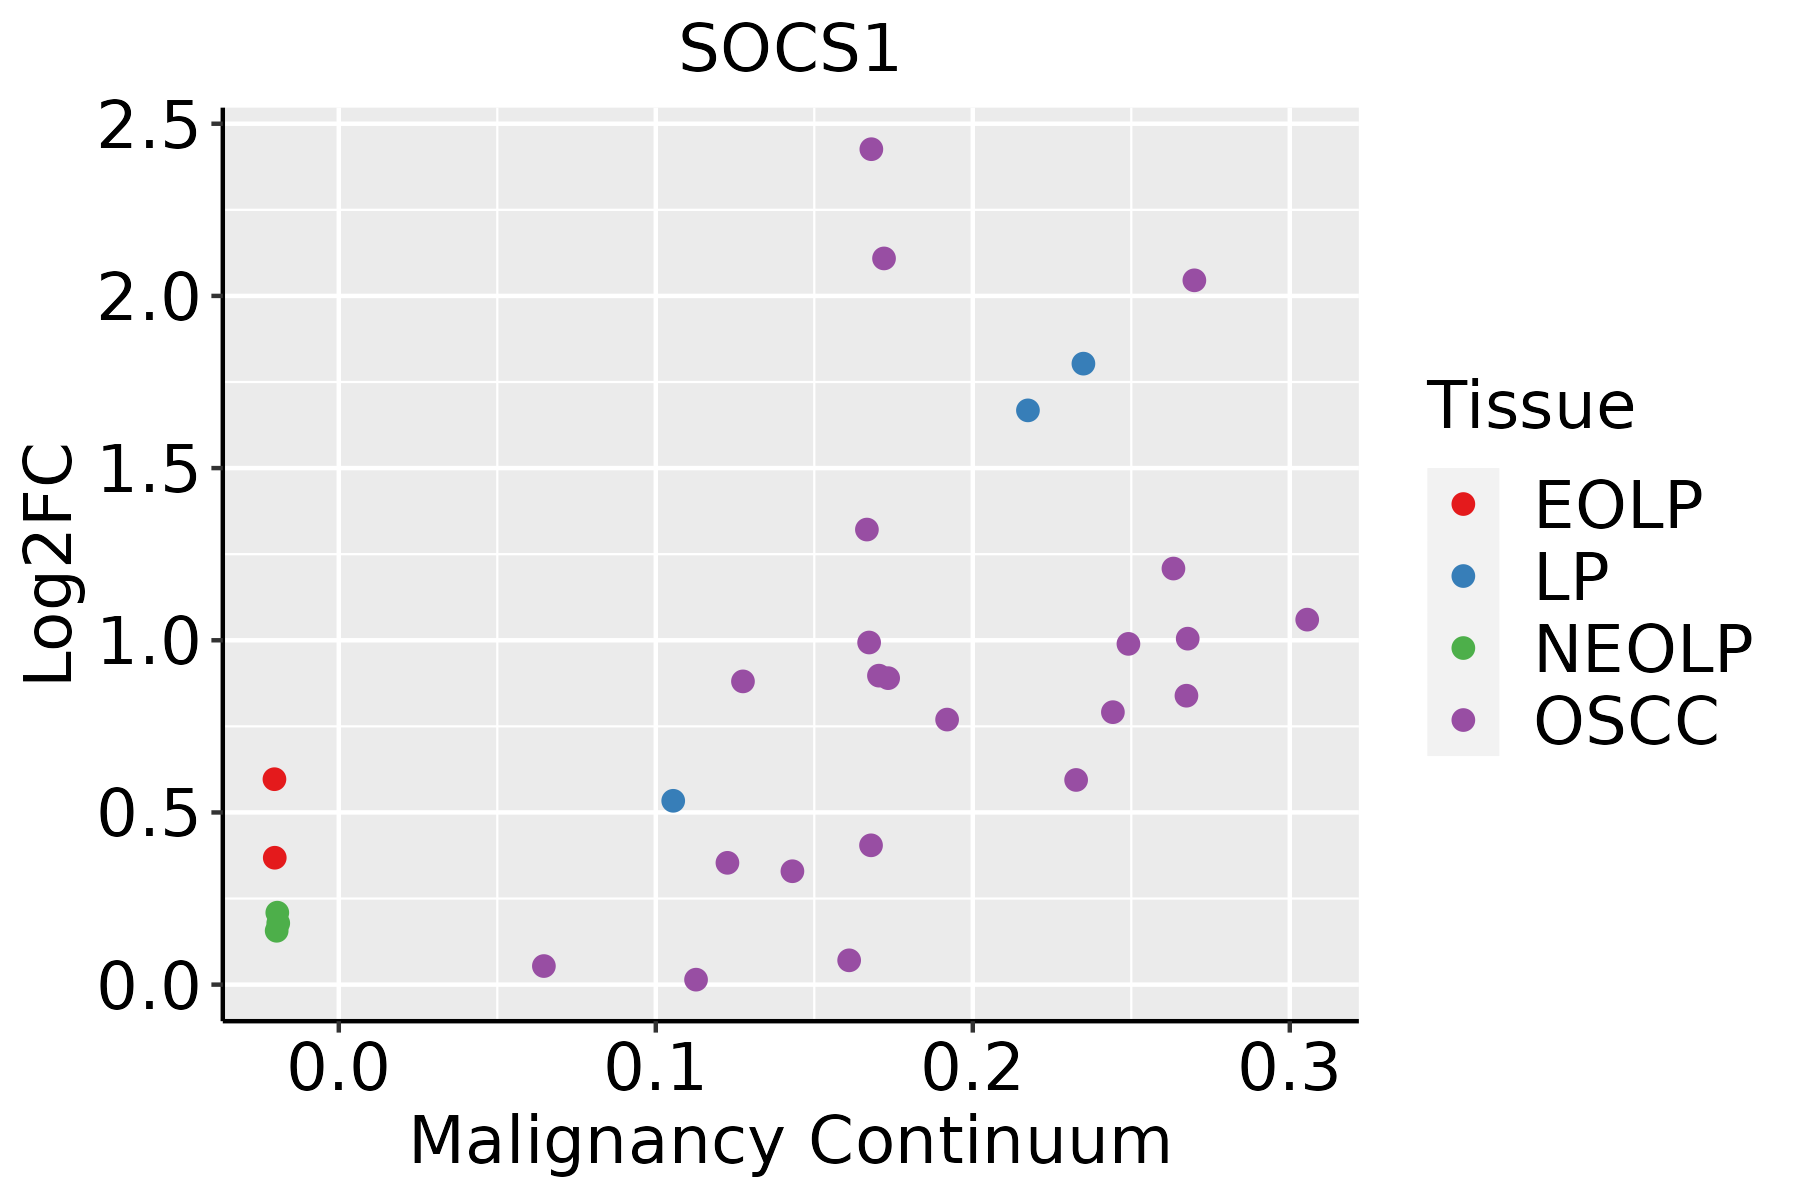 | EOLP: Erosive Oral lichen planus |
| LP: leukoplakia | ||
| NEOLP: Non-erosive oral lichen planus | ||
| OSCC: Oral squamous cell carcinoma | ||
| Skin | 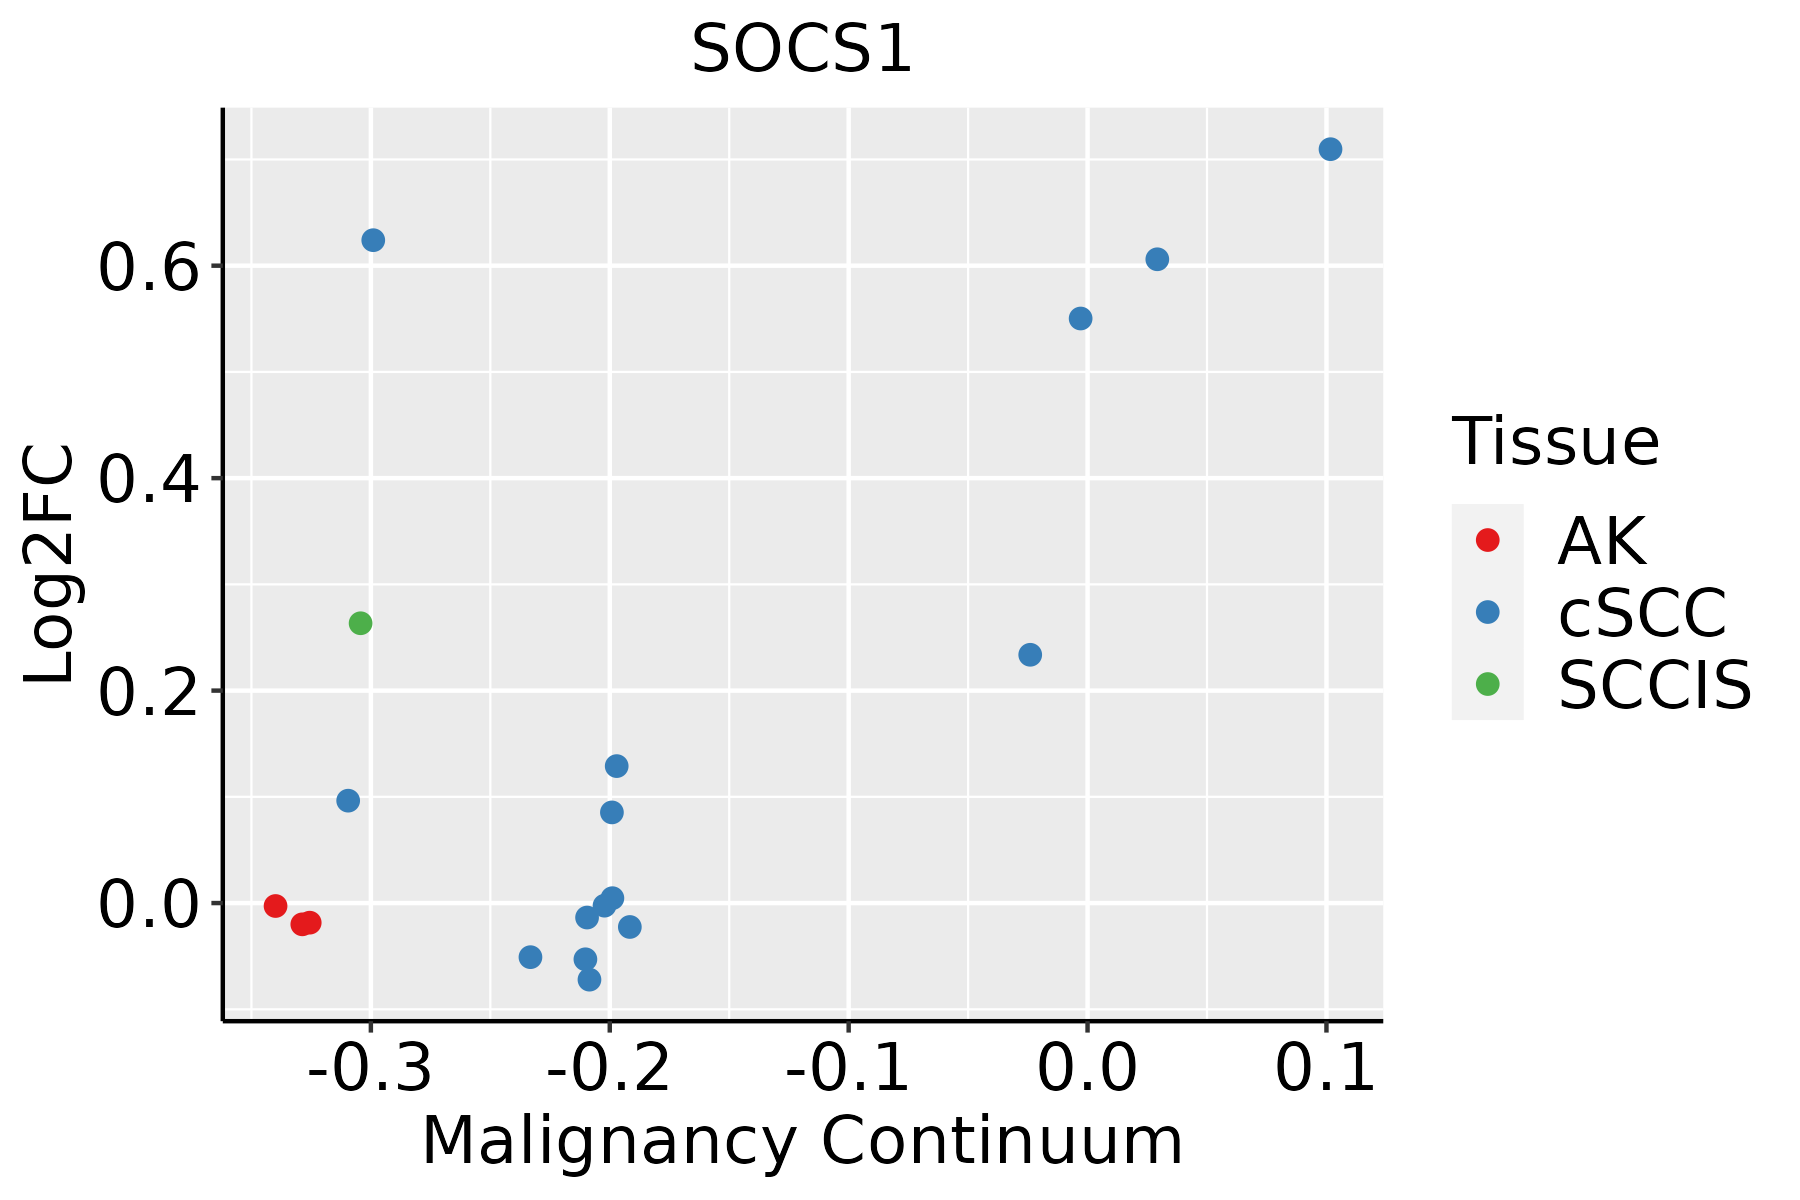 | AK: Actinic keratosis |
| cSCC: Cutaneous squamous cell carcinoma | ||
| SCCIS:squamous cell carcinoma in situ | ||
| Thyroid | 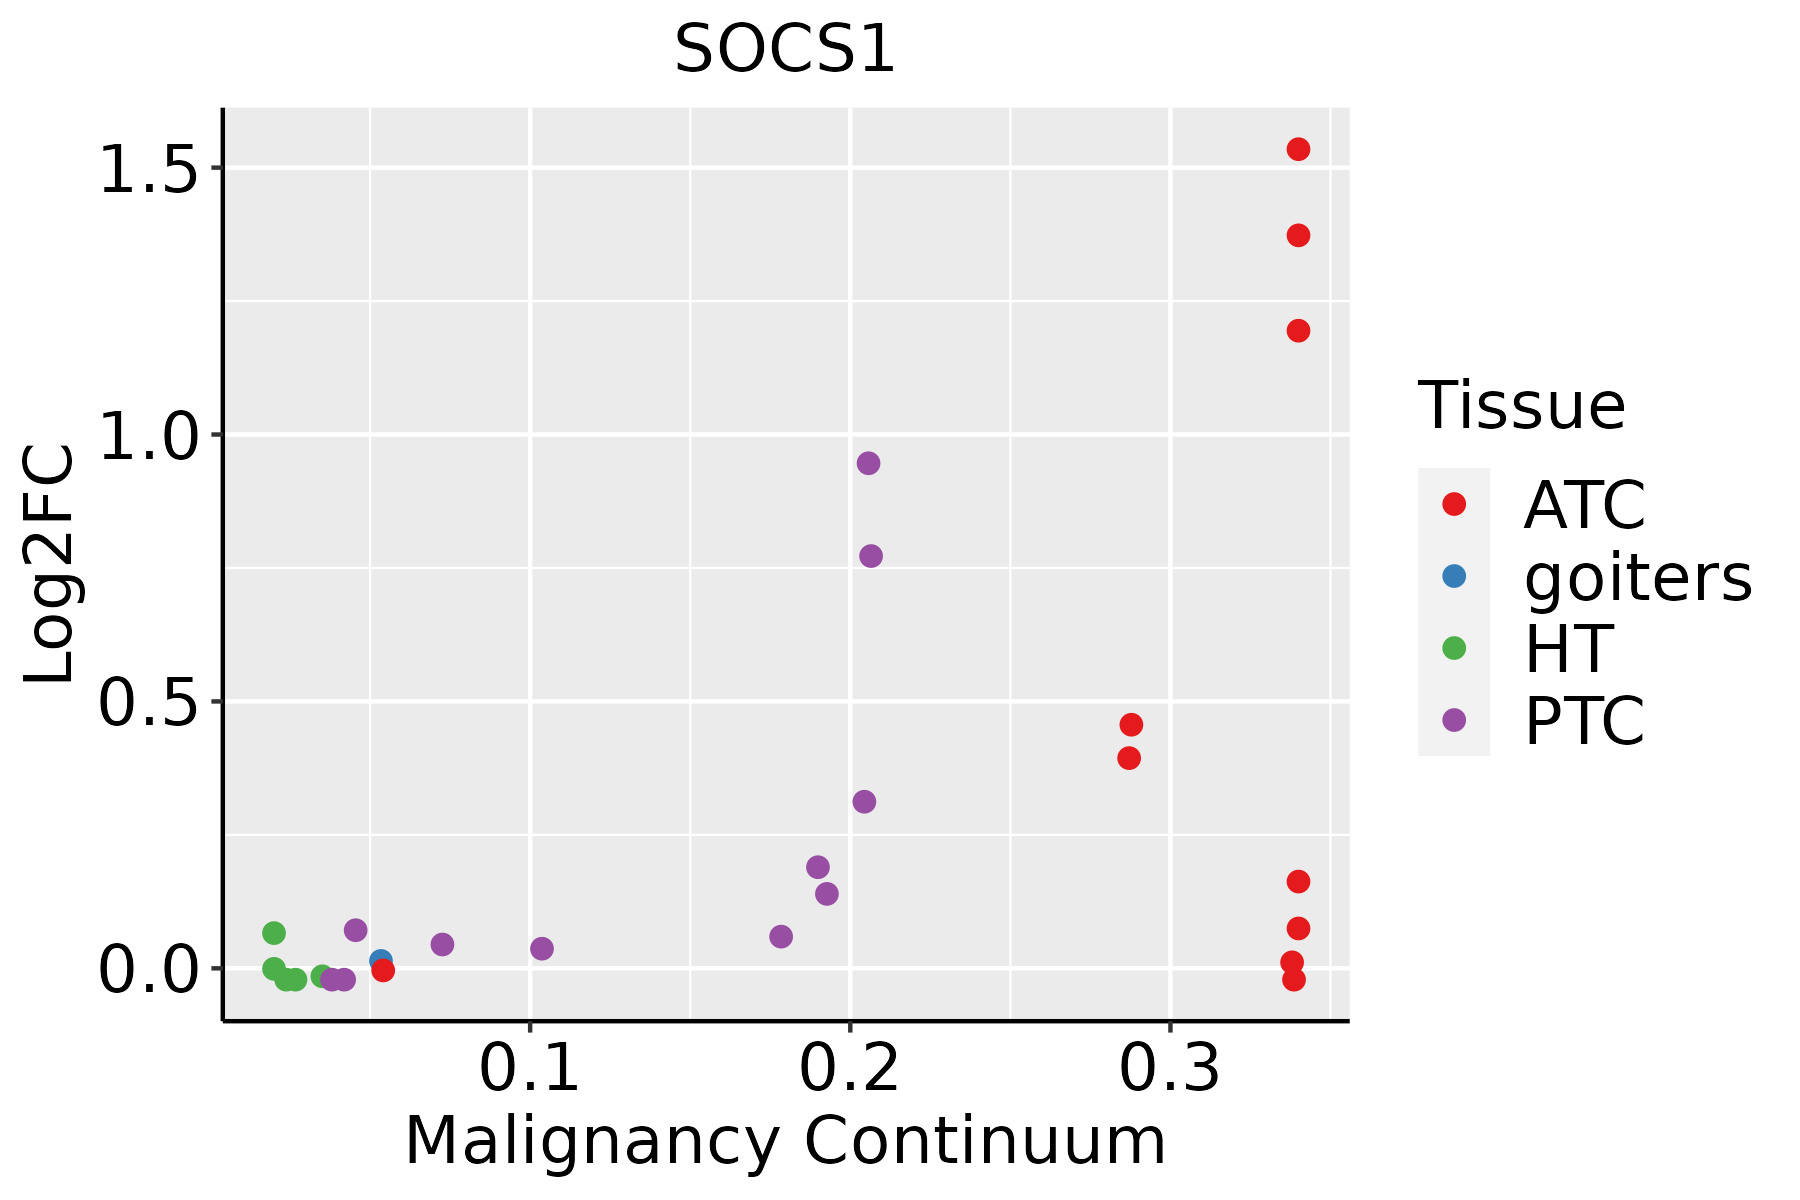 | ATC: Anaplastic thyroid cancer |
| HT: Hashimoto's thyroiditis | ||
| PTC: Papillary thyroid cancer |
| ∗log2FC in expression of this searched gene in stem-like cells from each diseased tissue sample relative to stem-like cells in normal samples in each tissue plotted against the malignancy continuum. Samples are colored based on if they are from different disease stage. |
Top |
Malignant transformation related pathway analysis |
| Find out the enriched GO biological processes and KEGG pathways involved in transition from healthy to precancer to cancer |
| Tissue | Disease Stage | Enriched GO biological Processes |
| Colorectum | AD |  |
| Colorectum | SER |  |
| Colorectum | MSS |  |
| Colorectum | MSI-H |  |
| Colorectum | FAP |  |
| ∗Top 15 enriched GO BP terms are showed in the bar plot of each disease state in each tissue. Each row represents a significant GO biological process which is colored according to the -log10(p.adjust). |
| Page: 1 2 3 4 5 6 7 8 9 |
| GO ID | Tissue | Disease Stage | Description | Gene Ratio | Bg Ratio | pvalue | p.adjust | Count |
| GO:00450884 | Oral cavity | OSCC | regulation of innate immune response | 116/7305 | 218/18723 | 1.36e-05 | 1.37e-04 | 116 |
| GO:002240718 | Oral cavity | OSCC | regulation of cell-cell adhesion | 218/7305 | 448/18723 | 1.71e-05 | 1.68e-04 | 218 |
| GO:00454448 | Oral cavity | OSCC | fat cell differentiation | 120/7305 | 229/18723 | 2.48e-05 | 2.32e-04 | 120 |
| GO:00082868 | Oral cavity | OSCC | insulin receptor signaling pathway | 67/7305 | 116/18723 | 3.23e-05 | 2.91e-04 | 67 |
| GO:00086543 | Oral cavity | OSCC | phospholipid biosynthetic process | 130/7305 | 253/18723 | 3.96e-05 | 3.46e-04 | 130 |
| GO:190370618 | Oral cavity | OSCC | regulation of hemopoiesis | 180/7305 | 367/18723 | 5.16e-05 | 4.30e-04 | 180 |
| GO:00011019 | Oral cavity | OSCC | response to acid chemical | 74/7305 | 135/18723 | 1.38e-04 | 9.76e-04 | 74 |
| GO:005086315 | Oral cavity | OSCC | regulation of T cell activation | 161/7305 | 329/18723 | 1.44e-04 | 1.02e-03 | 161 |
| GO:00192214 | Oral cavity | OSCC | cytokine-mediated signaling pathway | 222/7305 | 472/18723 | 2.02e-04 | 1.35e-03 | 222 |
| GO:000715916 | Oral cavity | OSCC | leukocyte cell-cell adhesion | 178/7305 | 371/18723 | 2.44e-04 | 1.57e-03 | 178 |
| GO:00300983 | Oral cavity | OSCC | lymphocyte differentiation | 179/7305 | 374/18723 | 2.74e-04 | 1.74e-03 | 179 |
| GO:00713465 | Oral cavity | OSCC | cellular response to interferon-gamma | 65/7305 | 118/18723 | 2.83e-04 | 1.79e-03 | 65 |
| GO:00432006 | Oral cavity | OSCC | response to amino acid | 64/7305 | 116/18723 | 2.96e-04 | 1.86e-03 | 64 |
| GO:190303715 | Oral cavity | OSCC | regulation of leukocyte cell-cell adhesion | 162/7305 | 336/18723 | 3.39e-04 | 2.08e-03 | 162 |
| GO:00182123 | Oral cavity | OSCC | peptidyl-tyrosine modification | 180/7305 | 378/18723 | 3.63e-04 | 2.22e-03 | 180 |
| GO:000268310 | Oral cavity | OSCC | negative regulation of immune system process | 204/7305 | 434/18723 | 3.72e-04 | 2.27e-03 | 204 |
| GO:00712304 | Oral cavity | OSCC | cellular response to amino acid stimulus | 42/7305 | 71/18723 | 4.59e-04 | 2.76e-03 | 42 |
| GO:19021059 | Oral cavity | OSCC | regulation of leukocyte differentiation | 136/7305 | 279/18723 | 5.53e-04 | 3.21e-03 | 136 |
| GO:00712295 | Oral cavity | OSCC | cellular response to acid chemical | 46/7305 | 80/18723 | 6.08e-04 | 3.44e-03 | 46 |
| GO:00302175 | Oral cavity | OSCC | T cell differentiation | 126/7305 | 257/18723 | 6.51e-04 | 3.66e-03 | 126 |
| Page: 1 2 3 4 5 6 7 8 9 10 11 12 13 14 15 16 17 18 19 20 21 22 23 24 25 26 |
| Pathway ID | Tissue | Disease Stage | Description | Gene Ratio | Bg Ratio | pvalue | p.adjust | qvalue | Count |
| hsa0412014 | Cervix | CC | Ubiquitin mediated proteolysis | 49/1267 | 142/8465 | 4.26e-09 | 7.68e-08 | 4.54e-08 | 49 |
| hsa0514514 | Cervix | CC | Toxoplasmosis | 34/1267 | 112/8465 | 2.42e-05 | 1.82e-04 | 1.08e-04 | 34 |
| hsa049172 | Cervix | CC | Prolactin signaling pathway | 18/1267 | 70/8465 | 1.29e-02 | 3.87e-02 | 2.29e-02 | 18 |
| hsa0412015 | Cervix | CC | Ubiquitin mediated proteolysis | 49/1267 | 142/8465 | 4.26e-09 | 7.68e-08 | 4.54e-08 | 49 |
| hsa0514515 | Cervix | CC | Toxoplasmosis | 34/1267 | 112/8465 | 2.42e-05 | 1.82e-04 | 1.08e-04 | 34 |
| hsa0491711 | Cervix | CC | Prolactin signaling pathway | 18/1267 | 70/8465 | 1.29e-02 | 3.87e-02 | 2.29e-02 | 18 |
| hsa0514522 | Cervix | HSIL_HPV | Toxoplasmosis | 22/459 | 112/8465 | 1.07e-07 | 3.14e-06 | 2.54e-06 | 22 |
| hsa0514532 | Cervix | HSIL_HPV | Toxoplasmosis | 22/459 | 112/8465 | 1.07e-07 | 3.14e-06 | 2.54e-06 | 22 |
| hsa0412027 | Esophagus | ESCC | Ubiquitin mediated proteolysis | 122/4205 | 142/8465 | 6.53e-20 | 7.29e-18 | 3.74e-18 | 122 |
| hsa0514525 | Esophagus | ESCC | Toxoplasmosis | 76/4205 | 112/8465 | 6.83e-05 | 2.90e-04 | 1.48e-04 | 76 |
| hsa049109 | Esophagus | ESCC | Insulin signaling pathway | 89/4205 | 137/8465 | 1.97e-04 | 7.32e-04 | 3.75e-04 | 89 |
| hsa0412036 | Esophagus | ESCC | Ubiquitin mediated proteolysis | 122/4205 | 142/8465 | 6.53e-20 | 7.29e-18 | 3.74e-18 | 122 |
| hsa05145111 | Esophagus | ESCC | Toxoplasmosis | 76/4205 | 112/8465 | 6.83e-05 | 2.90e-04 | 1.48e-04 | 76 |
| hsa0491014 | Esophagus | ESCC | Insulin signaling pathway | 89/4205 | 137/8465 | 1.97e-04 | 7.32e-04 | 3.75e-04 | 89 |
| hsa0412041 | Liver | HCC | Ubiquitin mediated proteolysis | 110/4020 | 142/8465 | 1.67e-13 | 3.74e-12 | 2.08e-12 | 110 |
| hsa0491041 | Liver | HCC | Insulin signaling pathway | 95/4020 | 137/8465 | 1.53e-07 | 1.97e-06 | 1.10e-06 | 95 |
| hsa0514521 | Liver | HCC | Toxoplasmosis | 70/4020 | 112/8465 | 9.25e-04 | 3.52e-03 | 1.96e-03 | 70 |
| hsa04917 | Liver | HCC | Prolactin signaling pathway | 43/4020 | 70/8465 | 1.30e-02 | 3.19e-02 | 1.78e-02 | 43 |
| hsa0412051 | Liver | HCC | Ubiquitin mediated proteolysis | 110/4020 | 142/8465 | 1.67e-13 | 3.74e-12 | 2.08e-12 | 110 |
| hsa0491051 | Liver | HCC | Insulin signaling pathway | 95/4020 | 137/8465 | 1.53e-07 | 1.97e-06 | 1.10e-06 | 95 |
| Page: 1 2 3 |
Top |
Cell-cell communication analysis |
| Identification of potential cell-cell interactions between two cell types and their ligand-receptor pairs for different disease states |
| Ligand | Receptor | LRpair | Pathway | Tissue | Disease Stage |
| Page: 1 |
Top |
Single-cell gene regulatory network inference analysis |
| Find out the significant the regulons (TFs) and the target genes of each regulon across cell types for different disease states |
| TF | Cell Type | Tissue | Disease Stage | Target Gene | RSS | Regulon Activity |
| ∗The dot plots of a searched regulon are shown for all cell subpopulations in each disease state of each tissue based on the regulon specific score inferred using pySCENIC and by calculating the average expression. |
| Page: 1 |
Top |
Somatic mutation of malignant transformation related genes |
| Annotation of somatic variants for genes involved in malignant transformation |
| Hugo Symbol | Variant Class | Variant Classification | dbSNP RS | HGVSc | HGVSp | HGVSp Short | SWISSPROT | BIOTYPE | SIFT | PolyPhen | Tumor Sample Barcode | Tissue | Histology | Sex | Age | Stage | Therapy Types | Drugs | Outcome |
| SOCS1 | SNV | Missense_Mutation | c.445G>A | p.Glu149Lys | p.E149K | O15524 | protein_coding | tolerated(1) | benign(0.001) | TCGA-AD-6895-01 | Colorectum | colon adenocarcinoma | Male | >=65 | III/IV | Unknown | Unknown | SD | |
| SOCS1 | SNV | Missense_Mutation | c.467C>T | p.Ala156Val | p.A156V | O15524 | protein_coding | tolerated(0.25) | benign(0.042) | TCGA-CK-4951-01 | Colorectum | colon adenocarcinoma | Female | >=65 | I/II | Unknown | Unknown | PD | |
| SOCS1 | deletion | Frame_Shift_Del | novel | c.586delN | p.Leu196SerfsTer9 | p.L196Sfs*9 | O15524 | protein_coding | TCGA-AA-3877-01 | Colorectum | colon adenocarcinoma | Female | >=65 | I/II | Unknown | Unknown | SD | ||
| SOCS1 | SNV | Missense_Mutation | novel | c.581N>C | p.Ile194Thr | p.I194T | O15524 | protein_coding | deleterious(0) | benign(0.143) | TCGA-AP-A059-01 | Endometrium | uterine corpus endometrioid carcinoma | Female | >=65 | I/II | Unknown | Unknown | SD |
| SOCS1 | SNV | Missense_Mutation | novel | c.601N>T | p.Arg201Cys | p.R201C | O15524 | protein_coding | deleterious(0) | probably_damaging(0.939) | TCGA-DF-A2KN-01 | Endometrium | uterine corpus endometrioid carcinoma | Female | Unknown | I/II | Unknown | Unknown | SD |
| SOCS1 | SNV | Missense_Mutation | novel | c.329A>T | p.Asn110Ile | p.N110I | O15524 | protein_coding | deleterious(0) | probably_damaging(0.953) | TCGA-EO-A22R-01 | Endometrium | uterine corpus endometrioid carcinoma | Female | <65 | I/II | Unknown | Unknown | SD |
| SOCS1 | SNV | Missense_Mutation | novel | c.370N>G | p.Thr124Ala | p.T124A | O15524 | protein_coding | tolerated(0.18) | possibly_damaging(0.525) | TCGA-EO-A3B0-01 | Endometrium | uterine corpus endometrioid carcinoma | Female | <65 | III/IV | Unknown | Unknown | SD |
| SOCS1 | deletion | Frame_Shift_Del | novel | c.594delC | p.Val199SerfsTer6 | p.V199Sfs*6 | O15524 | protein_coding | TCGA-DI-A1BU-01 | Endometrium | uterine corpus endometrioid carcinoma | Female | <65 | I/II | Chemotherapy | paclitaxel | SD | ||
| SOCS1 | SNV | Missense_Mutation | novel | c.271G>A | p.Glu91Lys | p.E91K | O15524 | protein_coding | tolerated(0.47) | benign(0.112) | TCGA-IQ-A61H-01 | Oral cavity | head & neck squamous cell carcinoma | Male | >=65 | I/II | Unknown | Unknown | SD |
| SOCS1 | SNV | Missense_Mutation | c.379N>T | p.Arg127Cys | p.R127C | O15524 | protein_coding | deleterious(0) | probably_damaging(1) | TCGA-CG-5721-01 | Stomach | stomach adenocarcinoma | Male | <65 | III/IV | Unknown | Unknown | SD |
| Page: 1 |
Top |
Related drugs of malignant transformation related genes |
| Identification of chemicals and drugs interact with genes involved in malignant transfromation |
| (DGIdb 4.0) |
| Entrez ID | Symbol | Category | Interaction Types | Drug Claim Name | Drug Name | PMIDs |
| 8651 | SOCS1 | CLINICALLY ACTIONABLE, KINASE | INSULIN | INSULIN | 18171911 | |
| 8651 | SOCS1 | CLINICALLY ACTIONABLE, KINASE | IL-2 | ALDESLEUKIN | 12928391 |
| Page: 1 |

Copyright 2023-Present -The University of Texas Health Science Center at Houston |