
|
|||||
|
 | |
| |
| |
| |
| |
| |
|
Gene: SHC2 |
Gene summary for SHC2 |
| Gene information | Species | Human | Gene symbol | SHC2 | Gene ID | 25759 |
| Gene name | SHC adaptor protein 2 | |
| Gene Alias | SCK | |
| Cytomap | 19p13.3 | |
| Gene Type | protein-coding | GO ID | GO:0000165 | UniProtAcc | P98077 |
Top |
Malignant transformation analysis |
| Identification of the aberrant gene expression in precancerous and cancerous lesions by comparing the gene expression of stem-like cells in diseased tissues with normal stem cells |
| Entrez ID | Symbol | Replicates | Species | Organ | Tissue | Adj P-value | Log2FC | Malignancy |
| 25759 | SHC2 | HCC1_Meng | Human | Liver | HCC | 1.57e-25 | -2.04e-02 | 0.0246 |
| 25759 | SHC2 | HCC2_Meng | Human | Liver | HCC | 2.91e-13 | 1.53e-01 | 0.0107 |
| 25759 | SHC2 | HCC2 | Human | Liver | HCC | 8.40e-11 | 3.76e+00 | 0.5341 |
| 25759 | SHC2 | S015 | Human | Liver | HCC | 1.64e-02 | 2.83e-01 | 0.2375 |
| 25759 | SHC2 | S027 | Human | Liver | HCC | 5.97e-10 | 9.47e-01 | 0.2446 |
| 25759 | SHC2 | S028 | Human | Liver | HCC | 2.94e-19 | 8.99e-01 | 0.2503 |
| 25759 | SHC2 | S029 | Human | Liver | HCC | 7.77e-10 | 5.44e-01 | 0.2581 |
| 25759 | SHC2 | male-WTA | Human | Thyroid | PTC | 1.22e-18 | 2.16e-01 | 0.1037 |
| 25759 | SHC2 | PTC04 | Human | Thyroid | PTC | 1.98e-05 | 2.23e-01 | 0.1927 |
| 25759 | SHC2 | PTC05 | Human | Thyroid | PTC | 1.72e-06 | 3.20e-01 | 0.2065 |
| 25759 | SHC2 | PTC06 | Human | Thyroid | PTC | 9.06e-03 | 6.02e-02 | 0.2057 |
| 25759 | SHC2 | PTC07 | Human | Thyroid | PTC | 7.83e-16 | 2.67e-01 | 0.2044 |
| 25759 | SHC2 | ATC13 | Human | Thyroid | ATC | 2.13e-55 | 1.00e+00 | 0.34 |
| 25759 | SHC2 | ATC3 | Human | Thyroid | ATC | 2.41e-02 | 1.80e-01 | 0.338 |
| 25759 | SHC2 | ATC5 | Human | Thyroid | ATC | 3.18e-56 | 1.07e+00 | 0.34 |
| Page: 1 |
| Tissue | Expression Dynamics | Abbreviation |
| Liver | 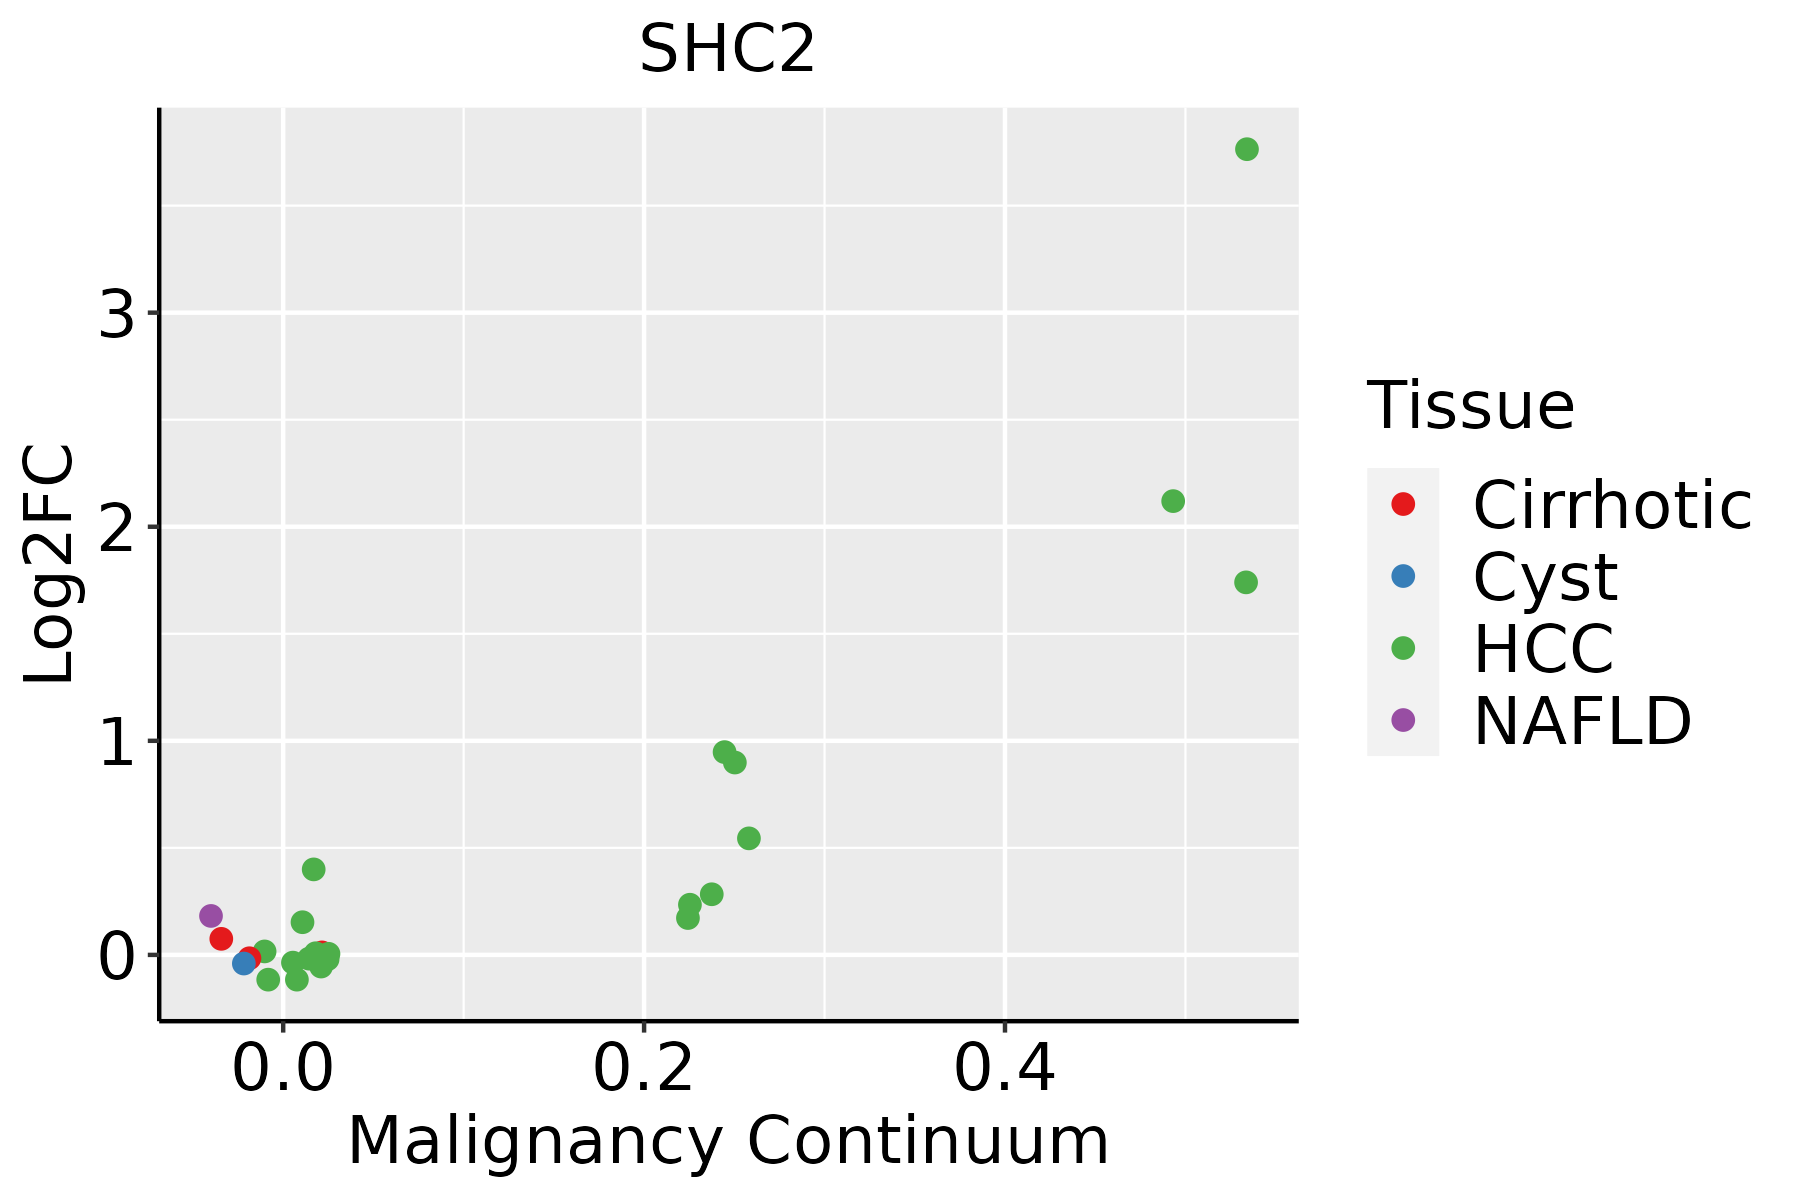 | HCC: Hepatocellular carcinoma |
| NAFLD: Non-alcoholic fatty liver disease | ||
| Thyroid | 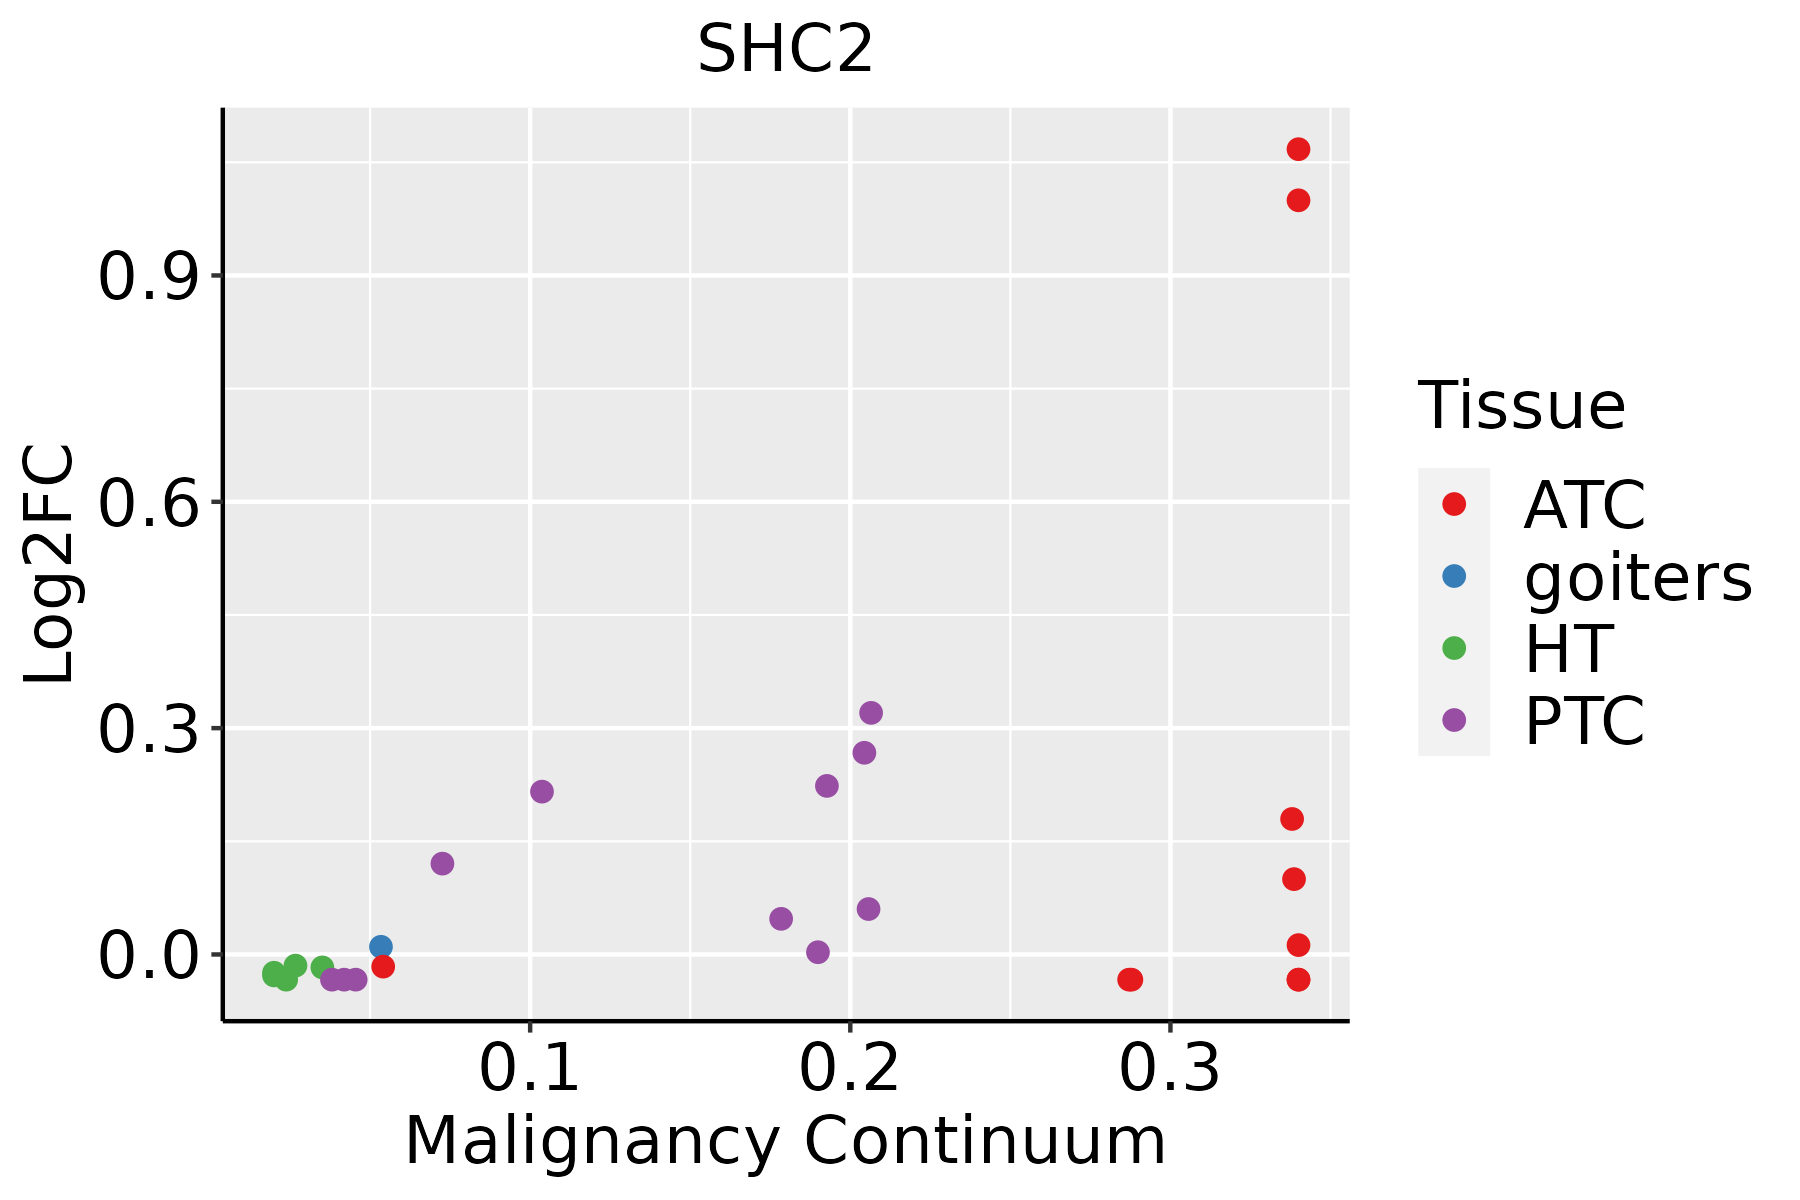 | ATC: Anaplastic thyroid cancer |
| HT: Hashimoto's thyroiditis | ||
| PTC: Papillary thyroid cancer |
| ∗log2FC in expression of this searched gene in stem-like cells from each diseased tissue sample relative to stem-like cells in normal samples in each tissue plotted against the malignancy continuum. Samples are colored based on if they are from different disease stage. |
Top |
Malignant transformation related pathway analysis |
| Find out the enriched GO biological processes and KEGG pathways involved in transition from healthy to precancer to cancer |
| Tissue | Disease Stage | Enriched GO biological Processes |
| Colorectum | AD |  |
| Colorectum | SER |  |
| Colorectum | MSS |  |
| Colorectum | MSI-H |  |
| Colorectum | FAP |  |
| ∗Top 15 enriched GO BP terms are showed in the bar plot of each disease state in each tissue. Each row represents a significant GO biological process which is colored according to the -log10(p.adjust). |
| Page: 1 2 3 4 5 6 7 8 9 |
| GO ID | Tissue | Disease Stage | Description | Gene Ratio | Bg Ratio | pvalue | p.adjust | Count |
| GO:003158922 | Liver | HCC | cell-substrate adhesion | 188/7958 | 363/18723 | 2.00e-04 | 1.55e-03 | 188 |
| GO:00360103 | Liver | HCC | protein localization to endosome | 19/7958 | 24/18723 | 2.80e-04 | 2.02e-03 | 19 |
| GO:190290412 | Liver | HCC | negative regulation of supramolecular fiber organization | 90/7958 | 167/18723 | 1.90e-03 | 9.69e-03 | 90 |
| GO:003227212 | Liver | HCC | negative regulation of protein polymerization | 46/7958 | 80/18723 | 4.81e-03 | 2.03e-02 | 46 |
| GO:00432444 | Liver | HCC | regulation of protein-containing complex disassembly | 66/7958 | 121/18723 | 4.94e-03 | 2.07e-02 | 66 |
| GO:005101612 | Liver | HCC | barbed-end actin filament capping | 18/7958 | 26/18723 | 5.37e-03 | 2.24e-02 | 18 |
| GO:00514946 | Liver | HCC | negative regulation of cytoskeleton organization | 84/7958 | 163/18723 | 1.22e-02 | 4.43e-02 | 84 |
| GO:003083712 | Liver | HCC | negative regulation of actin filament polymerization | 37/7958 | 65/18723 | 1.33e-02 | 4.77e-02 | 37 |
| GO:00436242 | Liver | HCC | cellular protein complex disassembly | 71/7958 | 136/18723 | 1.39e-02 | 4.95e-02 | 71 |
| Page: 1 2 3 4 5 6 7 8 9 10 11 12 |
| Pathway ID | Tissue | Disease Stage | Description | Gene Ratio | Bg Ratio | pvalue | p.adjust | qvalue | Count |
| hsa0491041 | Liver | HCC | Insulin signaling pathway | 95/4020 | 137/8465 | 1.53e-07 | 1.97e-06 | 1.10e-06 | 95 |
| hsa0522021 | Liver | HCC | Chronic myeloid leukemia | 55/4020 | 76/8465 | 8.67e-06 | 6.91e-05 | 3.84e-05 | 55 |
| hsa052258 | Liver | HCC | Hepatocellular carcinoma | 106/4020 | 168/8465 | 2.87e-05 | 1.85e-04 | 1.03e-04 | 106 |
| hsa0451041 | Liver | HCC | Focal adhesion | 125/4020 | 203/8465 | 3.12e-05 | 1.88e-04 | 1.04e-04 | 125 |
| hsa0510022 | Liver | HCC | Bacterial invasion of epithelial cells | 51/4020 | 77/8465 | 6.67e-04 | 2.72e-03 | 1.52e-03 | 51 |
| hsa0472210 | Liver | HCC | Neurotrophin signaling pathway | 74/4020 | 119/8465 | 8.27e-04 | 3.26e-03 | 1.81e-03 | 74 |
| hsa040128 | Liver | HCC | ErbB signaling pathway | 54/4020 | 85/8465 | 2.02e-03 | 7.07e-03 | 3.93e-03 | 54 |
| hsa052142 | Liver | HCC | Glioma | 47/4020 | 75/8465 | 5.67e-03 | 1.62e-02 | 9.02e-03 | 47 |
| hsa049262 | Liver | HCC | Relaxin signaling pathway | 75/4020 | 129/8465 | 9.33e-03 | 2.46e-02 | 1.37e-02 | 75 |
| hsa0152121 | Liver | HCC | EGFR tyrosine kinase inhibitor resistance | 48/4020 | 79/8465 | 1.19e-02 | 2.99e-02 | 1.66e-02 | 48 |
| hsa01522 | Liver | HCC | Endocrine resistance | 58/4020 | 98/8465 | 1.28e-02 | 3.19e-02 | 1.78e-02 | 58 |
| hsa04917 | Liver | HCC | Prolactin signaling pathway | 43/4020 | 70/8465 | 1.30e-02 | 3.19e-02 | 1.78e-02 | 43 |
| hsa0491051 | Liver | HCC | Insulin signaling pathway | 95/4020 | 137/8465 | 1.53e-07 | 1.97e-06 | 1.10e-06 | 95 |
| hsa0522031 | Liver | HCC | Chronic myeloid leukemia | 55/4020 | 76/8465 | 8.67e-06 | 6.91e-05 | 3.84e-05 | 55 |
| hsa0522511 | Liver | HCC | Hepatocellular carcinoma | 106/4020 | 168/8465 | 2.87e-05 | 1.85e-04 | 1.03e-04 | 106 |
| hsa0451051 | Liver | HCC | Focal adhesion | 125/4020 | 203/8465 | 3.12e-05 | 1.88e-04 | 1.04e-04 | 125 |
| hsa0510032 | Liver | HCC | Bacterial invasion of epithelial cells | 51/4020 | 77/8465 | 6.67e-04 | 2.72e-03 | 1.52e-03 | 51 |
| hsa0472211 | Liver | HCC | Neurotrophin signaling pathway | 74/4020 | 119/8465 | 8.27e-04 | 3.26e-03 | 1.81e-03 | 74 |
| hsa0401211 | Liver | HCC | ErbB signaling pathway | 54/4020 | 85/8465 | 2.02e-03 | 7.07e-03 | 3.93e-03 | 54 |
| hsa0521411 | Liver | HCC | Glioma | 47/4020 | 75/8465 | 5.67e-03 | 1.62e-02 | 9.02e-03 | 47 |
| Page: 1 2 |
Top |
Cell-cell communication analysis |
| Identification of potential cell-cell interactions between two cell types and their ligand-receptor pairs for different disease states |
| Ligand | Receptor | LRpair | Pathway | Tissue | Disease Stage |
| Page: 1 |
Top |
Single-cell gene regulatory network inference analysis |
| Find out the significant the regulons (TFs) and the target genes of each regulon across cell types for different disease states |
| TF | Cell Type | Tissue | Disease Stage | Target Gene | RSS | Regulon Activity |
| ∗The dot plots of a searched regulon are shown for all cell subpopulations in each disease state of each tissue based on the regulon specific score inferred using pySCENIC and by calculating the average expression. |
| Page: 1 |
Top |
Somatic mutation of malignant transformation related genes |
| Annotation of somatic variants for genes involved in malignant transformation |
| Hugo Symbol | Variant Class | Variant Classification | dbSNP RS | HGVSc | HGVSp | HGVSp Short | SWISSPROT | BIOTYPE | SIFT | PolyPhen | Tumor Sample Barcode | Tissue | Histology | Sex | Age | Stage | Therapy Types | Drugs | Outcome |
| SHC2 | SNV | Missense_Mutation | c.620N>A | p.Ala207Glu | p.A207E | P98077 | protein_coding | deleterious(0.02) | possibly_damaging(0.474) | TCGA-BH-A0BP-01 | Breast | breast invasive carcinoma | Female | >=65 | I/II | Unknown | Unknown | SD | |
| SHC2 | SNV | Missense_Mutation | c.816N>G | p.Ile272Met | p.I272M | P98077 | protein_coding | deleterious(0) | probably_damaging(0.927) | TCGA-C8-A26Y-01 | Breast | breast invasive carcinoma | Female | >=65 | I/II | Unknown | Unknown | SD | |
| SHC2 | SNV | Missense_Mutation | novel | c.1636N>A | p.Val546Met | p.V546M | P98077 | protein_coding | tolerated(0.31) | benign(0.174) | TCGA-2W-A8YY-01 | Cervix | cervical & endocervical cancer | Female | <65 | I/II | Chemotherapy | cisplatin | CR |
| SHC2 | SNV | Missense_Mutation | rs746427249 | c.1360N>A | p.Val454Met | p.V454M | P98077 | protein_coding | tolerated(0.21) | benign(0.011) | TCGA-2W-A8YY-01 | Cervix | cervical & endocervical cancer | Female | <65 | I/II | Chemotherapy | cisplatin | CR |
| SHC2 | SNV | Missense_Mutation | rs200040363 | c.766G>A | p.Gly256Arg | p.G256R | P98077 | protein_coding | deleterious(0) | probably_damaging(1) | TCGA-C5-A2LX-01 | Cervix | cervical & endocervical cancer | Female | <65 | I/II | Chemotherapy | cisplatin | SD |
| SHC2 | SNV | Missense_Mutation | rs773645712 | c.1549G>A | p.Gly517Arg | p.G517R | P98077 | protein_coding | deleterious(0) | probably_damaging(0.991) | TCGA-EA-A3HU-01 | Cervix | cervical & endocervical cancer | Female | <65 | I/II | Unknown | Unknown | SD |
| SHC2 | SNV | Missense_Mutation | novel | c.632G>A | p.Gly211Asp | p.G211D | P98077 | protein_coding | deleterious(0) | possibly_damaging(0.881) | TCGA-EA-A3HU-01 | Cervix | cervical & endocervical cancer | Female | <65 | I/II | Unknown | Unknown | SD |
| SHC2 | SNV | Missense_Mutation | c.716N>A | p.Arg239His | p.R239H | P98077 | protein_coding | deleterious(0.01) | benign(0.189) | TCGA-IR-A3LL-01 | Cervix | cervical & endocervical cancer | Female | <65 | I/II | Chemotherapy | cisplatin | CR | |
| SHC2 | SNV | Missense_Mutation | rs746427249 | c.1360N>A | p.Val454Met | p.V454M | P98077 | protein_coding | tolerated(0.21) | benign(0.011) | TCGA-A6-5661-01 | Colorectum | colon adenocarcinoma | Female | >=65 | I/II | Unknown | Unknown | SD |
| SHC2 | SNV | Missense_Mutation | rs528045997 | c.1040N>T | p.Pro347Leu | p.P347L | P98077 | protein_coding | deleterious(0.02) | possibly_damaging(0.648) | TCGA-AA-3877-01 | Colorectum | colon adenocarcinoma | Female | >=65 | I/II | Unknown | Unknown | SD |
| Page: 1 2 3 4 5 |
Top |
Related drugs of malignant transformation related genes |
| Identification of chemicals and drugs interact with genes involved in malignant transfromation |
| (DGIdb 4.0) |
| Entrez ID | Symbol | Category | Interaction Types | Drug Claim Name | Drug Name | PMIDs |
| Page: 1 |

Copyright 2023-Present -The University of Texas Health Science Center at Houston |