
|
|||||
|
 | |
| |
| |
| |
| |
| |
|
Gene: RYK |
Gene summary for RYK |
| Gene information | Species | Human | Gene symbol | RYK | Gene ID | 6259 |
| Gene name | receptor like tyrosine kinase | |
| Gene Alias | D3S3195 | |
| Cytomap | 3q22.2 | |
| Gene Type | protein-coding | GO ID | GO:0000165 | UniProtAcc | A0A087WUK1 |
Top |
Malignant transformation analysis |
| Identification of the aberrant gene expression in precancerous and cancerous lesions by comparing the gene expression of stem-like cells in diseased tissues with normal stem cells |
| Entrez ID | Symbol | Replicates | Species | Organ | Tissue | Adj P-value | Log2FC | Malignancy |
| 6259 | RYK | CA_HPV_1 | Human | Cervix | CC | 5.02e-07 | -2.22e-01 | 0.0264 |
| 6259 | RYK | CA_HPV_3 | Human | Cervix | CC | 3.09e-03 | 2.18e-01 | 0.0414 |
| 6259 | RYK | CCI_2 | Human | Cervix | CC | 1.38e-09 | 1.27e+00 | 0.5249 |
| 6259 | RYK | CCI_3 | Human | Cervix | CC | 1.06e-14 | 1.16e+00 | 0.516 |
| 6259 | RYK | HTA11_3410_2000001011 | Human | Colorectum | AD | 3.48e-09 | -4.32e-01 | 0.0155 |
| 6259 | RYK | HTA11_696_2000001011 | Human | Colorectum | AD | 5.79e-08 | -3.92e-01 | -0.1464 |
| 6259 | RYK | HTA11_866_2000001011 | Human | Colorectum | AD | 3.09e-05 | -3.02e-01 | -0.1001 |
| 6259 | RYK | HTA11_7696_3000711011 | Human | Colorectum | AD | 3.95e-04 | -2.81e-01 | 0.0674 |
| 6259 | RYK | HTA11_99999974143_84620 | Human | Colorectum | MSS | 2.92e-05 | -3.21e-01 | 0.3005 |
| 6259 | RYK | A001-C-207 | Human | Colorectum | FAP | 5.74e-08 | -2.87e-01 | 0.1278 |
| 6259 | RYK | A015-C-203 | Human | Colorectum | FAP | 6.65e-30 | -3.76e-01 | -0.1294 |
| 6259 | RYK | A015-C-204 | Human | Colorectum | FAP | 1.56e-05 | -1.59e-01 | -0.0228 |
| 6259 | RYK | A014-C-040 | Human | Colorectum | FAP | 2.36e-05 | -4.34e-01 | -0.1184 |
| 6259 | RYK | A002-C-201 | Human | Colorectum | FAP | 3.65e-16 | -2.89e-01 | 0.0324 |
| 6259 | RYK | A002-C-203 | Human | Colorectum | FAP | 2.32e-04 | -1.67e-01 | 0.2786 |
| 6259 | RYK | A001-C-119 | Human | Colorectum | FAP | 1.15e-15 | -5.43e-01 | -0.1557 |
| 6259 | RYK | A001-C-108 | Human | Colorectum | FAP | 4.77e-22 | -3.72e-01 | -0.0272 |
| 6259 | RYK | A002-C-205 | Human | Colorectum | FAP | 6.70e-24 | -4.52e-01 | -0.1236 |
| 6259 | RYK | A001-C-104 | Human | Colorectum | FAP | 1.43e-07 | -3.01e-01 | 0.0184 |
| 6259 | RYK | A015-C-005 | Human | Colorectum | FAP | 9.23e-07 | -2.93e-01 | -0.0336 |
| Page: 1 2 3 4 5 6 7 8 |
| Tissue | Expression Dynamics | Abbreviation |
| Cervix | 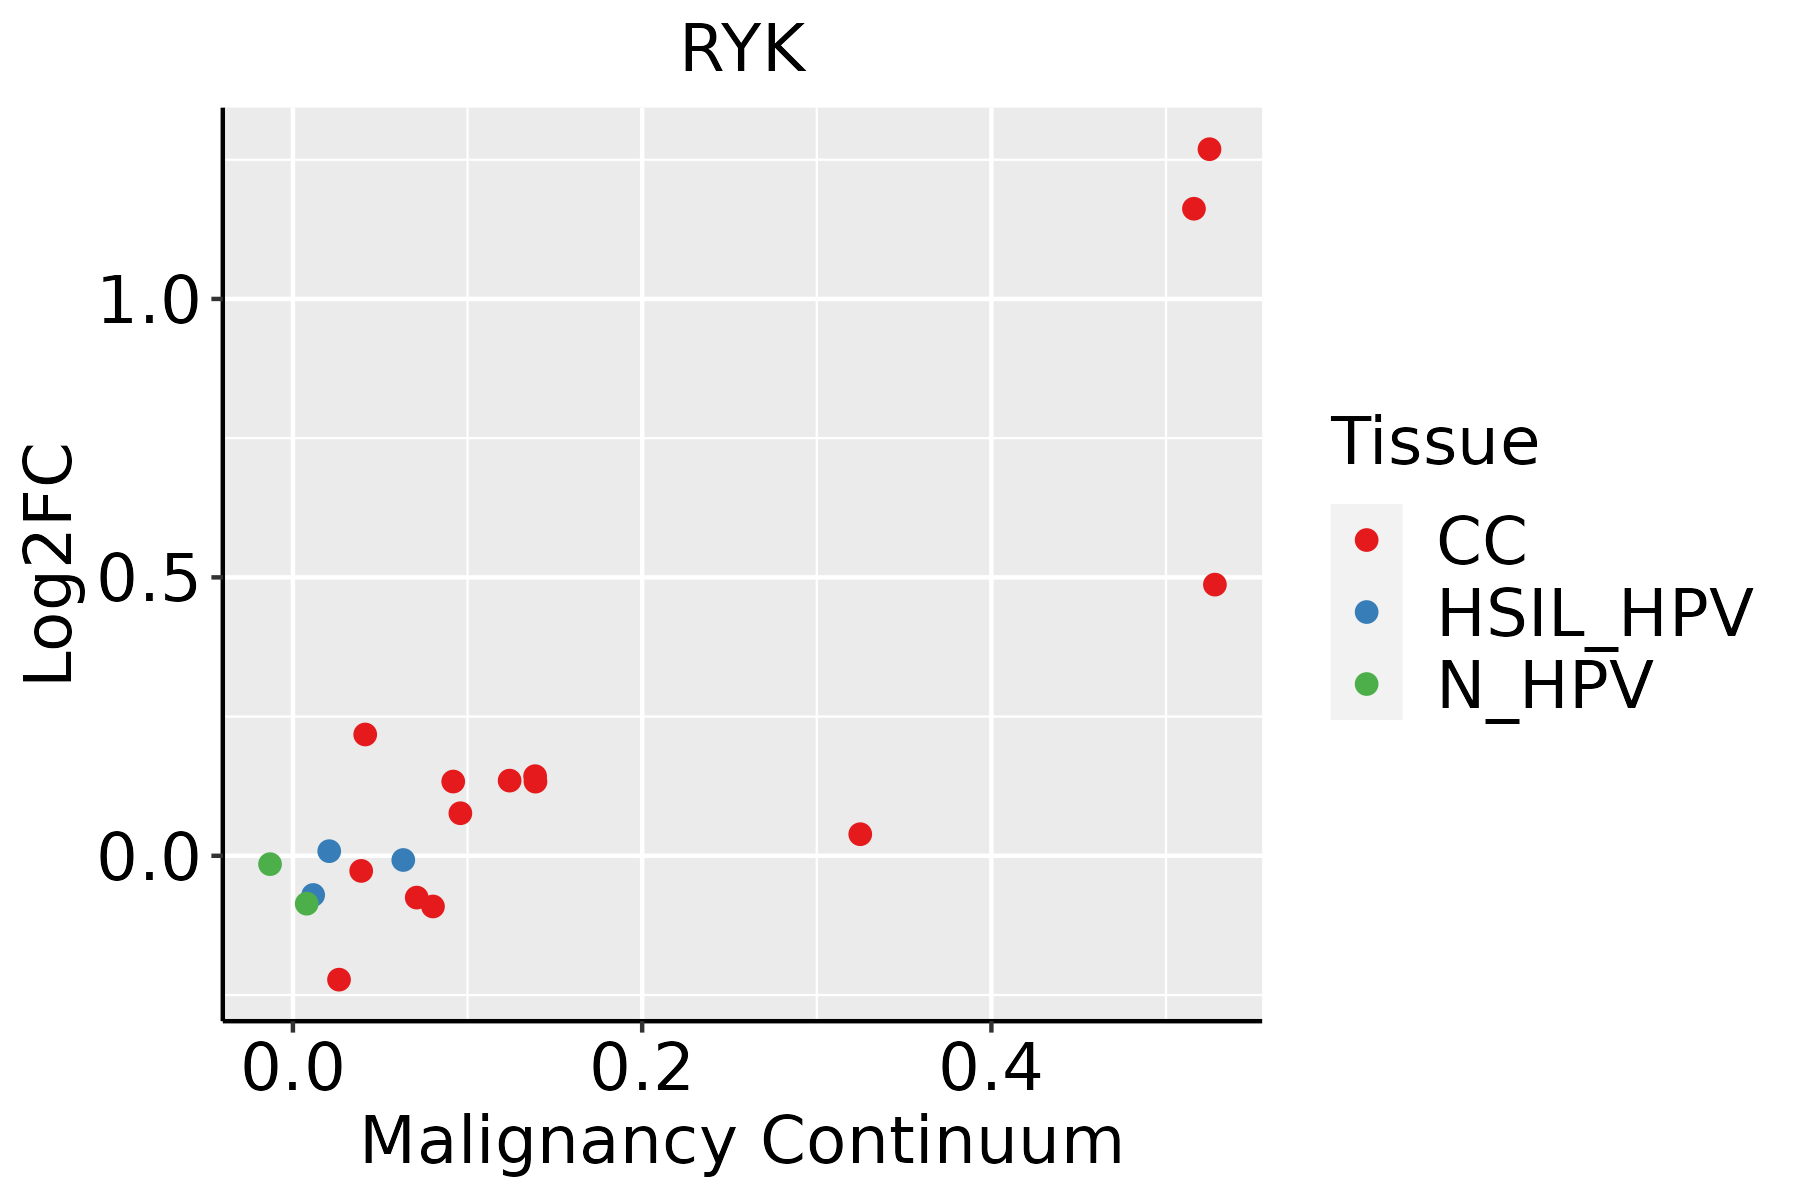 | CC: Cervix cancer |
| HSIL_HPV: HPV-infected high-grade squamous intraepithelial lesions | ||
| N_HPV: HPV-infected normal cervix | ||
| Colorectum (GSE201348) |  | FAP: Familial adenomatous polyposis |
| CRC: Colorectal cancer | ||
| Colorectum (HTA11) |  | AD: Adenomas |
| SER: Sessile serrated lesions | ||
| MSI-H: Microsatellite-high colorectal cancer | ||
| MSS: Microsatellite stable colorectal cancer | ||
| Esophagus | 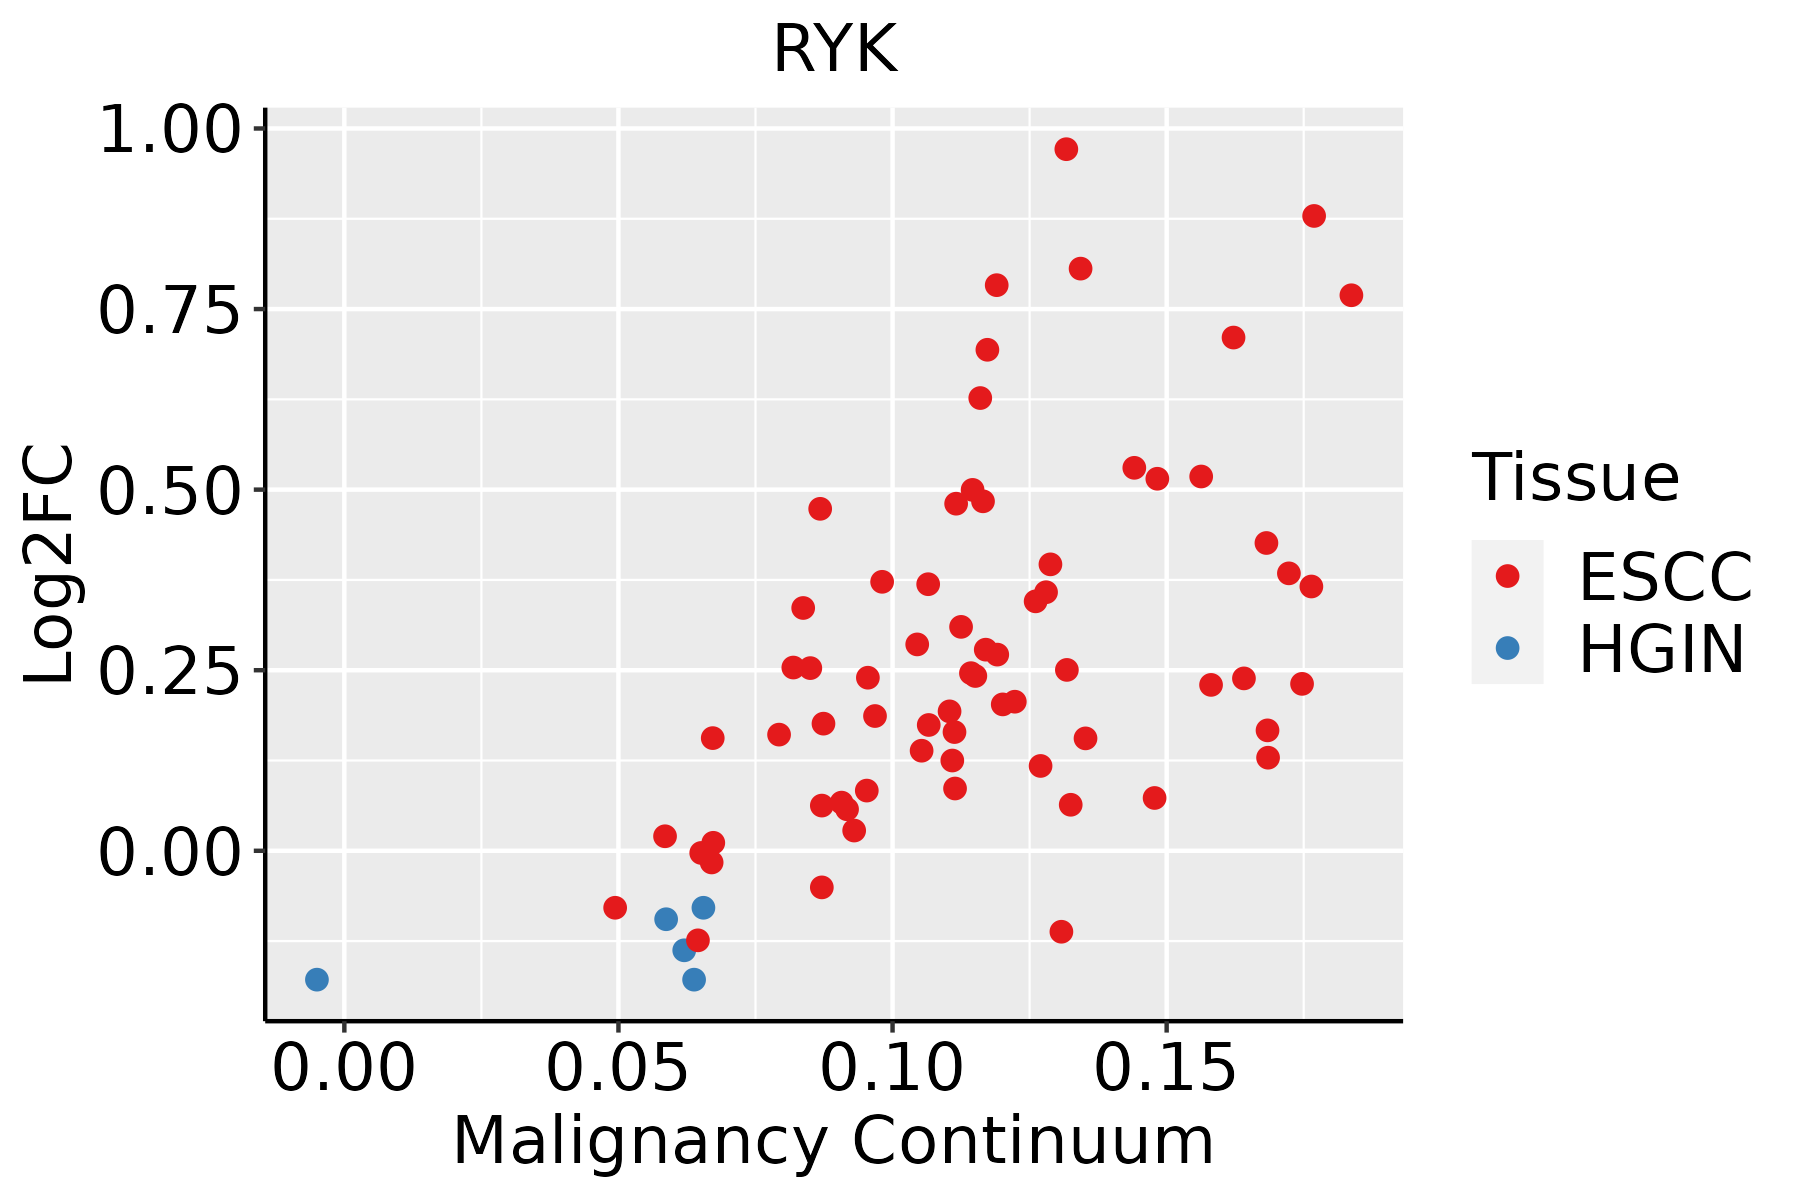 | ESCC: Esophageal squamous cell carcinoma |
| HGIN: High-grade intraepithelial neoplasias | ||
| LGIN: Low-grade intraepithelial neoplasias | ||
| Liver | 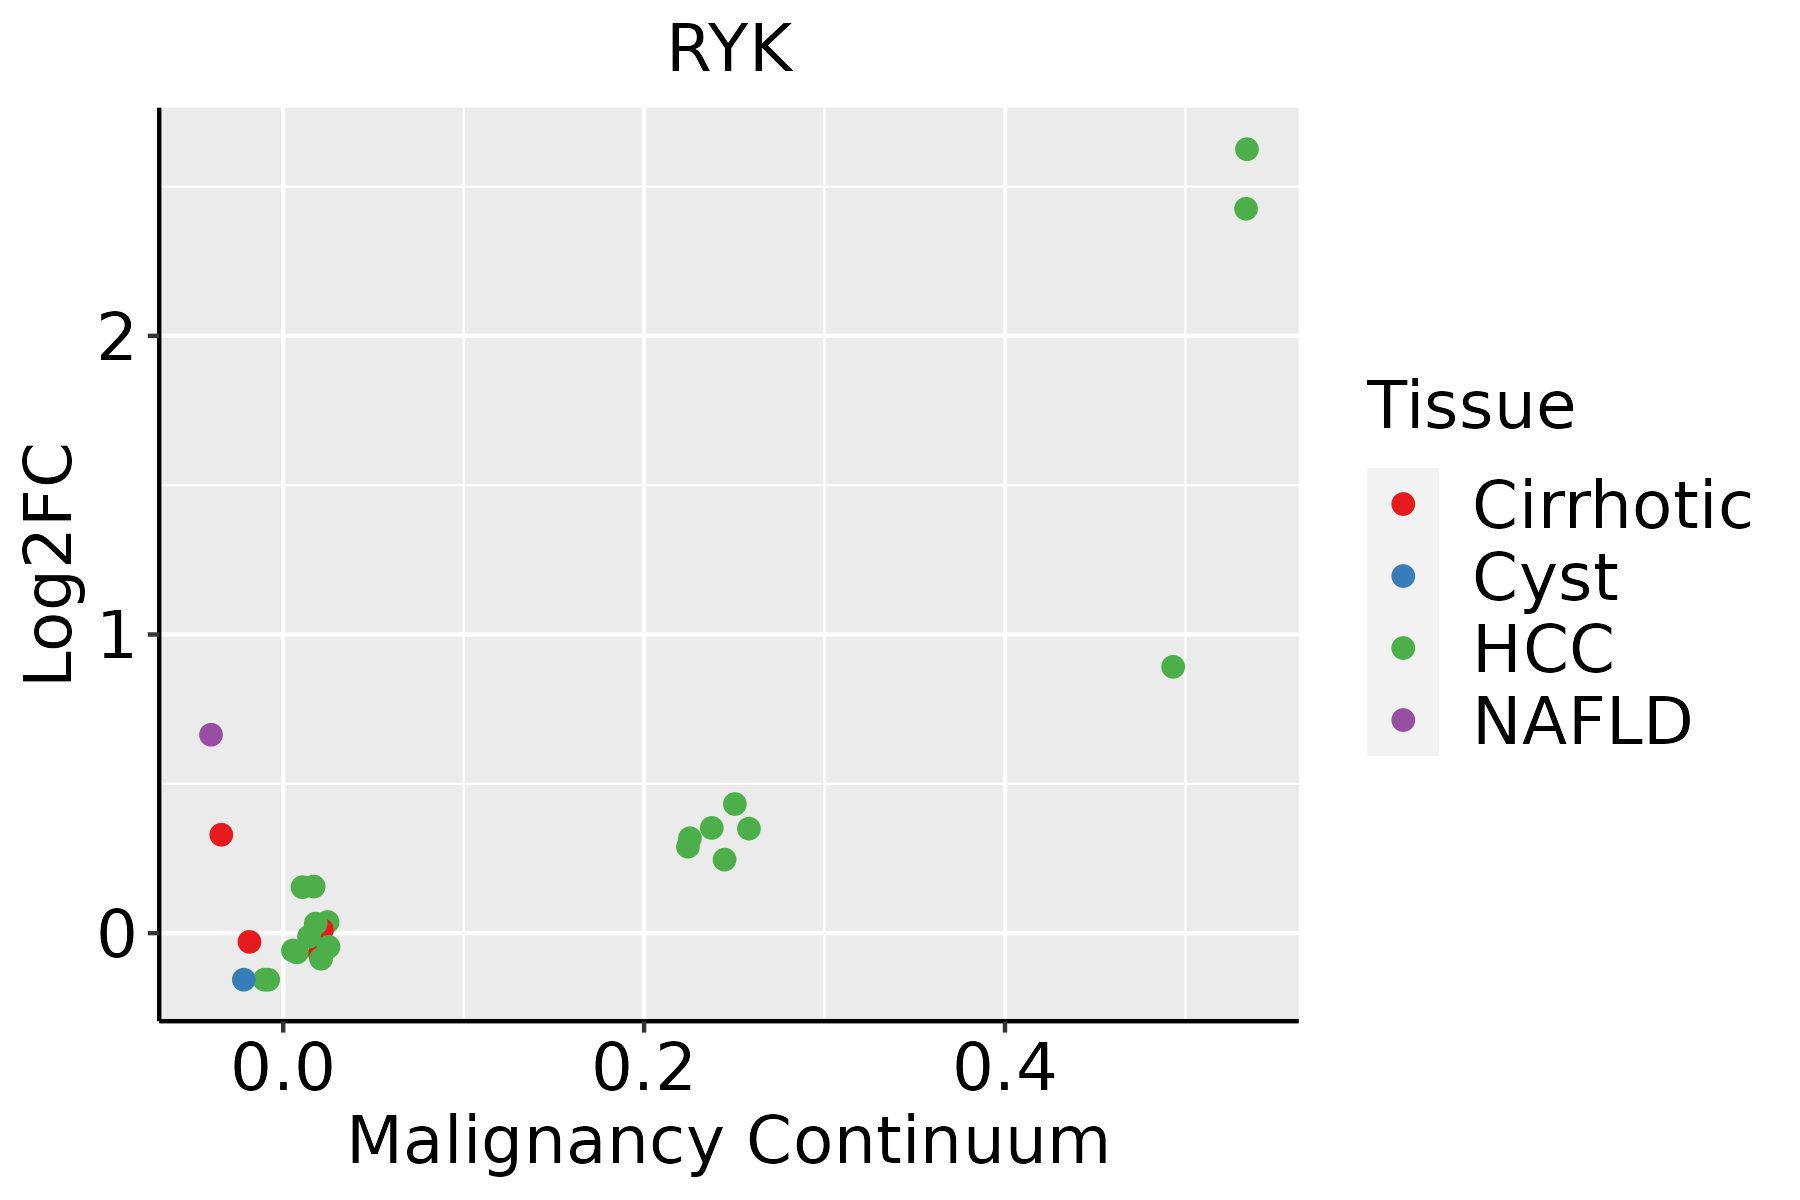 | HCC: Hepatocellular carcinoma |
| NAFLD: Non-alcoholic fatty liver disease | ||
| Oral Cavity | 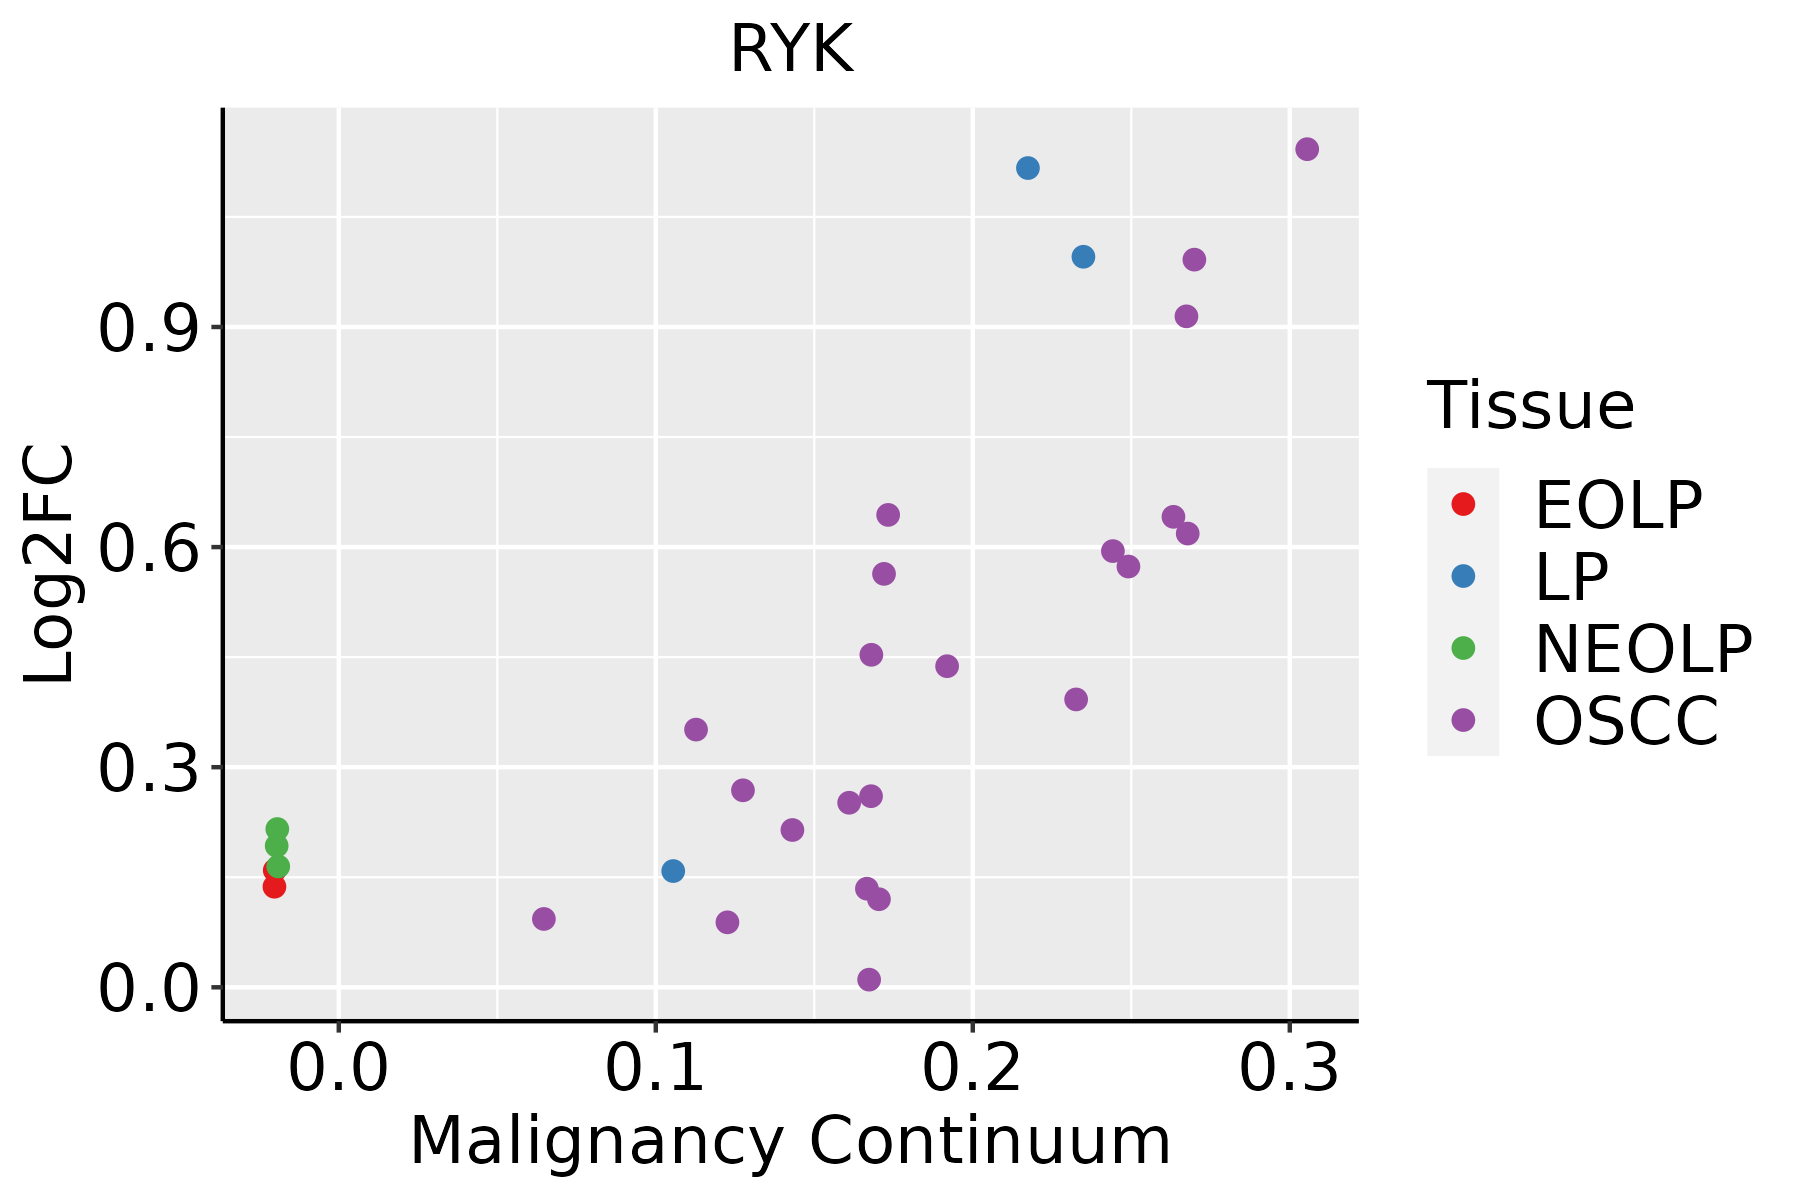 | EOLP: Erosive Oral lichen planus |
| LP: leukoplakia | ||
| NEOLP: Non-erosive oral lichen planus | ||
| OSCC: Oral squamous cell carcinoma | ||
| Prostate |  | BPH: Benign Prostatic Hyperplasia |
| Skin |  | AK: Actinic keratosis |
| cSCC: Cutaneous squamous cell carcinoma | ||
| SCCIS:squamous cell carcinoma in situ | ||
| Thyroid |  | ATC: Anaplastic thyroid cancer |
| HT: Hashimoto's thyroiditis | ||
| PTC: Papillary thyroid cancer |
| ∗log2FC in expression of this searched gene in stem-like cells from each diseased tissue sample relative to stem-like cells in normal samples in each tissue plotted against the malignancy continuum. Samples are colored based on if they are from different disease stage. |
Top |
Malignant transformation related pathway analysis |
| Find out the enriched GO biological processes and KEGG pathways involved in transition from healthy to precancer to cancer |
| Tissue | Disease Stage | Enriched GO biological Processes |
| Colorectum | AD |  |
| Colorectum | SER |  |
| Colorectum | MSS |  |
| Colorectum | MSI-H |  |
| Colorectum | FAP |  |
| ∗Top 15 enriched GO BP terms are showed in the bar plot of each disease state in each tissue. Each row represents a significant GO biological process which is colored according to the -log10(p.adjust). |
| Page: 1 2 3 4 5 6 7 8 9 |
| GO ID | Tissue | Disease Stage | Description | Gene Ratio | Bg Ratio | pvalue | p.adjust | Count |
| GO:00303084 | Oral cavity | OSCC | negative regulation of cell growth | 101/7305 | 188/18723 | 2.85e-05 | 2.63e-04 | 101 |
| GO:00507679 | Oral cavity | OSCC | regulation of neurogenesis | 179/7305 | 364/18723 | 4.49e-05 | 3.84e-04 | 179 |
| GO:001097510 | Oral cavity | OSCC | regulation of neuron projection development | 210/7305 | 445/18723 | 2.35e-04 | 1.52e-03 | 210 |
| GO:006007010 | Oral cavity | OSCC | canonical Wnt signaling pathway | 148/7305 | 303/18723 | 2.89e-04 | 1.82e-03 | 148 |
| GO:00485889 | Oral cavity | OSCC | developmental cell growth | 116/7305 | 234/18723 | 6.20e-04 | 3.50e-03 | 116 |
| GO:00605609 | Oral cavity | OSCC | developmental growth involved in morphogenesis | 116/7305 | 234/18723 | 6.20e-04 | 3.50e-03 | 116 |
| GO:00083618 | Oral cavity | OSCC | regulation of cell size | 92/7305 | 181/18723 | 7.86e-04 | 4.26e-03 | 92 |
| GO:00519605 | Oral cavity | OSCC | regulation of nervous system development | 205/7305 | 443/18723 | 9.80e-04 | 5.11e-03 | 205 |
| GO:19901388 | Oral cavity | OSCC | neuron projection extension | 86/7305 | 172/18723 | 2.13e-03 | 9.80e-03 | 86 |
| GO:003432916 | Oral cavity | OSCC | cell junction assembly | 190/7305 | 420/18723 | 4.99e-03 | 1.96e-02 | 190 |
| GO:00486759 | Oral cavity | OSCC | axon extension | 61/7305 | 120/18723 | 5.52e-03 | 2.14e-02 | 61 |
| GO:00509204 | Oral cavity | OSCC | regulation of chemotaxis | 105/7305 | 223/18723 | 8.27e-03 | 3.01e-02 | 105 |
| GO:00313458 | Oral cavity | OSCC | negative regulation of cell projection organization | 89/7305 | 186/18723 | 8.51e-03 | 3.09e-02 | 89 |
| GO:00434107 | Oral cavity | OSCC | positive regulation of MAPK cascade | 213/7305 | 480/18723 | 8.71e-03 | 3.16e-02 | 213 |
| GO:006156410 | Oral cavity | OSCC | axon development | 207/7305 | 467/18723 | 1.01e-02 | 3.51e-02 | 207 |
| GO:003090116 | Oral cavity | OSCC | midbrain development | 46/7305 | 90/18723 | 1.30e-02 | 4.33e-02 | 46 |
| GO:0022038 | Oral cavity | OSCC | corpus callosum development | 10/7305 | 14/18723 | 1.44e-02 | 4.69e-02 | 10 |
| GO:0032535110 | Oral cavity | LP | regulation of cellular component size | 128/4623 | 383/18723 | 6.56e-05 | 8.80e-04 | 128 |
| GO:001604918 | Oral cavity | LP | cell growth | 155/4623 | 482/18723 | 1.08e-04 | 1.31e-03 | 155 |
| GO:000155817 | Oral cavity | LP | regulation of cell growth | 134/4623 | 414/18723 | 2.25e-04 | 2.41e-03 | 134 |
| Page: 1 2 3 4 5 6 7 8 9 10 11 12 13 14 15 16 17 18 19 20 21 22 23 24 25 26 27 |
| Pathway ID | Tissue | Disease Stage | Description | Gene Ratio | Bg Ratio | pvalue | p.adjust | qvalue | Count |
| hsa043609 | Cervix | CC | Axon guidance | 47/1267 | 182/8465 | 8.13e-05 | 5.38e-04 | 3.18e-04 | 47 |
| hsa043109 | Cervix | CC | Wnt signaling pathway | 43/1267 | 171/8465 | 3.03e-04 | 1.64e-03 | 9.68e-04 | 43 |
| hsa0436012 | Cervix | CC | Axon guidance | 47/1267 | 182/8465 | 8.13e-05 | 5.38e-04 | 3.18e-04 | 47 |
| hsa0431012 | Cervix | CC | Wnt signaling pathway | 43/1267 | 171/8465 | 3.03e-04 | 1.64e-03 | 9.68e-04 | 43 |
| hsa04360 | Colorectum | AD | Axon guidance | 61/2092 | 182/8465 | 4.36e-03 | 2.17e-02 | 1.38e-02 | 61 |
| hsa04310 | Colorectum | AD | Wnt signaling pathway | 56/2092 | 171/8465 | 1.03e-02 | 3.93e-02 | 2.51e-02 | 56 |
| hsa043601 | Colorectum | AD | Axon guidance | 61/2092 | 182/8465 | 4.36e-03 | 2.17e-02 | 1.38e-02 | 61 |
| hsa043101 | Colorectum | AD | Wnt signaling pathway | 56/2092 | 171/8465 | 1.03e-02 | 3.93e-02 | 2.51e-02 | 56 |
| hsa043104 | Colorectum | FAP | Wnt signaling pathway | 46/1404 | 171/8465 | 3.94e-04 | 3.06e-03 | 1.86e-03 | 46 |
| hsa043604 | Colorectum | FAP | Axon guidance | 47/1404 | 182/8465 | 9.09e-04 | 5.20e-03 | 3.16e-03 | 47 |
| hsa043105 | Colorectum | FAP | Wnt signaling pathway | 46/1404 | 171/8465 | 3.94e-04 | 3.06e-03 | 1.86e-03 | 46 |
| hsa043605 | Colorectum | FAP | Axon guidance | 47/1404 | 182/8465 | 9.09e-04 | 5.20e-03 | 3.16e-03 | 47 |
| hsa043606 | Colorectum | CRC | Axon guidance | 43/1091 | 182/8465 | 4.38e-05 | 8.70e-04 | 5.90e-04 | 43 |
| hsa043106 | Colorectum | CRC | Wnt signaling pathway | 40/1091 | 171/8465 | 1.01e-04 | 1.57e-03 | 1.07e-03 | 40 |
| hsa043607 | Colorectum | CRC | Axon guidance | 43/1091 | 182/8465 | 4.38e-05 | 8.70e-04 | 5.90e-04 | 43 |
| hsa043107 | Colorectum | CRC | Wnt signaling pathway | 40/1091 | 171/8465 | 1.01e-04 | 1.57e-03 | 1.07e-03 | 40 |
| hsa0436016 | Esophagus | ESCC | Axon guidance | 108/4205 | 182/8465 | 5.13e-03 | 1.30e-02 | 6.67e-03 | 108 |
| hsa0436017 | Esophagus | ESCC | Axon guidance | 108/4205 | 182/8465 | 5.13e-03 | 1.30e-02 | 6.67e-03 | 108 |
| hsa0436014 | Oral cavity | OSCC | Axon guidance | 97/3704 | 182/8465 | 5.59e-03 | 1.33e-02 | 6.76e-03 | 97 |
| hsa0436015 | Oral cavity | OSCC | Axon guidance | 97/3704 | 182/8465 | 5.59e-03 | 1.33e-02 | 6.76e-03 | 97 |
| Page: 1 2 |
Top |
Cell-cell communication analysis |
| Identification of potential cell-cell interactions between two cell types and their ligand-receptor pairs for different disease states |
| Ligand | Receptor | LRpair | Pathway | Tissue | Disease Stage |
| Page: 1 |
Top |
Single-cell gene regulatory network inference analysis |
| Find out the significant the regulons (TFs) and the target genes of each regulon across cell types for different disease states |
| TF | Cell Type | Tissue | Disease Stage | Target Gene | RSS | Regulon Activity |
| ∗The dot plots of a searched regulon are shown for all cell subpopulations in each disease state of each tissue based on the regulon specific score inferred using pySCENIC and by calculating the average expression. |
| Page: 1 |
Top |
Somatic mutation of malignant transformation related genes |
| Annotation of somatic variants for genes involved in malignant transformation |
| Hugo Symbol | Variant Class | Variant Classification | dbSNP RS | HGVSc | HGVSp | HGVSp Short | SWISSPROT | BIOTYPE | SIFT | PolyPhen | Tumor Sample Barcode | Tissue | Histology | Sex | Age | Stage | Therapy Types | Drugs | Outcome |
| RYK | SNV | Missense_Mutation | novel | c.677N>T | p.Thr226Met | p.T226M | protein_coding | deleterious(0.02) | probably_damaging(0.975) | TCGA-AN-A0AK-01 | Breast | breast invasive carcinoma | Female | >=65 | I/II | Unknown | Unknown | SD | |
| RYK | insertion | Frame_Shift_Ins | novel | c.1524dupA | p.Val509SerfsTer7 | p.V509Sfs*7 | protein_coding | TCGA-AO-A0JB-01 | Breast | breast invasive carcinoma | Female | <65 | III/IV | Chemotherapy | cyclophosphamide | SD | |||
| RYK | insertion | Frame_Shift_Ins | novel | c.1522_1523insATTTCCCCTGCTCACACTCACTCCATCCTGC | p.Pro508HisfsTer18 | p.P508Hfs*18 | protein_coding | TCGA-AO-A0JB-01 | Breast | breast invasive carcinoma | Female | <65 | III/IV | Chemotherapy | cyclophosphamide | SD | |||
| RYK | SNV | Missense_Mutation | novel | c.246A>C | p.Glu82Asp | p.E82D | protein_coding | deleterious(0.03) | probably_damaging(0.919) | TCGA-2W-A8YY-01 | Cervix | cervical & endocervical cancer | Female | <65 | I/II | Chemotherapy | cisplatin | CR | |
| RYK | SNV | Missense_Mutation | novel | c.1698N>T | p.Gln566His | p.Q566H | protein_coding | deleterious(0.03) | probably_damaging(0.924) | TCGA-AA-3821-01 | Colorectum | colon adenocarcinoma | Female | >=65 | I/II | Unknown | Unknown | SD | |
| RYK | SNV | Missense_Mutation | novel | c.1031T>A | p.Phe344Tyr | p.F344Y | protein_coding | deleterious(0.04) | benign(0.433) | TCGA-AA-3870-01 | Colorectum | colon adenocarcinoma | Female | >=65 | III/IV | Chemotherapy | folinic | CR | |
| RYK | SNV | Missense_Mutation | novel | c.1378N>A | p.Ala460Thr | p.A460T | protein_coding | tolerated(0.14) | benign(0.098) | TCGA-AA-3977-01 | Colorectum | colon adenocarcinoma | Male | >=65 | I/II | Unknown | Unknown | SD | |
| RYK | SNV | Missense_Mutation | novel | c.1083N>C | p.Glu361Asp | p.E361D | protein_coding | tolerated(0.22) | benign(0.137) | TCGA-AA-3977-01 | Colorectum | colon adenocarcinoma | Male | >=65 | I/II | Unknown | Unknown | SD | |
| RYK | SNV | Missense_Mutation | novel | c.1064N>G | p.Glu355Gly | p.E355G | protein_coding | deleterious(0.04) | benign(0.007) | TCGA-AD-6889-01 | Colorectum | colon adenocarcinoma | Male | >=65 | I/II | Chemotherapy | xeloda | PD | |
| RYK | SNV | Missense_Mutation | novel | c.394N>A | p.Ala132Thr | p.A132T | protein_coding | deleterious(0.03) | benign(0.331) | TCGA-AD-6964-01 | Colorectum | colon adenocarcinoma | Male | <65 | III/IV | Chemotherapy | folfox | PD |
| Page: 1 2 3 4 5 6 |
Top |
Related drugs of malignant transformation related genes |
| Identification of chemicals and drugs interact with genes involved in malignant transfromation |
| (DGIdb 4.0) |
| Entrez ID | Symbol | Category | Interaction Types | Drug Claim Name | Drug Name | PMIDs |
| Page: 1 |

Copyright 2023-Present -The University of Texas Health Science Center at Houston |