Schematic overview of the cellular and molecular mechanisms involved in the cancer progression, including the proposed cellular and molecular mechanisms in cancer cells trajectory. AT1: alveolar type 1 cells; AT2: alveolar type 2 cells; AAH: atypical adenomatous hyperplasia; AIS: adenocarcinoma in situ; MIA: minimally invasive adenocarcinoma; IA: invasive adenocarcinoma; EMT: epithelial-mesenchymal transition

Home

Download

Statistics

Help

Contact

Center for Computational Systems Medicine
leaf

Gene summary

leaf

Malignant transformation analysis

leaf

Malignant transformation related pathway analysis

leaf

Cell-cell communication analysis

leaf

Single-cell gene regulatory network inference analysis

leaf

Somatic mutation of malignant transformation related genes

leaf

Related drugs of malignant transformation related genes

Gene: RIN1

Gene summary for RIN1

check button Gene summary.

Gene informationSpeciesHuman
Gene symbol

RIN1

Gene ID

9610

Gene nameRas and Rab interactor 1
Gene AliasRIN1
Cytomap11q13.2
Gene Typeprotein-coding
GO ID

GO:0006810

UniProtAcc

A0A0S2Z4U0


Top

Malignant transformation analysis

check button Identification of the aberrant gene expression in precancerous and cancerous lesions by comparing the gene expression of stem-like cells in diseased tissues with normal stem cells
check button Malignant transformation involving gene list.
Entrez IDSymbolReplicatesSpeciesOrganTissueAdj P-valueLog2FCMalignancy
9610RIN1P2T-EHumanEsophagusESCC5.72e-056.96e-020.1177
9610RIN1P4T-EHumanEsophagusESCC1.34e-052.19e-010.1323
9610RIN1P5T-EHumanEsophagusESCC9.64e-132.60e-010.1327
9610RIN1P8T-EHumanEsophagusESCC1.34e-047.71e-020.0889
9610RIN1P11T-EHumanEsophagusESCC3.46e-075.08e-010.1426
9610RIN1P15T-EHumanEsophagusESCC6.52e-062.51e-010.1149
9610RIN1P16T-EHumanEsophagusESCC2.01e-121.62e-010.1153
9610RIN1P17T-EHumanEsophagusESCC5.49e-105.31e-010.1278
9610RIN1P20T-EHumanEsophagusESCC4.34e-123.10e-010.1124
9610RIN1P21T-EHumanEsophagusESCC1.52e-255.19e-010.1617
9610RIN1P22T-EHumanEsophagusESCC1.59e-111.28e-010.1236
9610RIN1P23T-EHumanEsophagusESCC6.60e-082.23e-010.108
9610RIN1P24T-EHumanEsophagusESCC3.05e-122.07e-010.1287
9610RIN1P26T-EHumanEsophagusESCC1.80e-102.27e-010.1276
9610RIN1P27T-EHumanEsophagusESCC9.03e-141.74e-010.1055
9610RIN1P28T-EHumanEsophagusESCC1.09e-051.59e-010.1149
9610RIN1P31T-EHumanEsophagusESCC2.22e-081.56e-010.1251
9610RIN1P32T-EHumanEsophagusESCC2.88e-142.84e-010.1666
9610RIN1P36T-EHumanEsophagusESCC1.82e-082.11e-010.1187
9610RIN1P37T-EHumanEsophagusESCC1.84e-215.52e-010.1371
Page: 1 2 3 4 

check button Transcriptomic changes along malignancy continuum.
TissueExpression DynamicsAbbreviation
EsophagusThe image shows the transcriptomic changes along malignancy continuum.log2FC in expression of this searched gene in stem-like cells from each diseased tissue sample relative to stem-like cells in normal samples in each tissue plotted against the malignancy continuum. Samples are colored based on if they are from different disease stage.
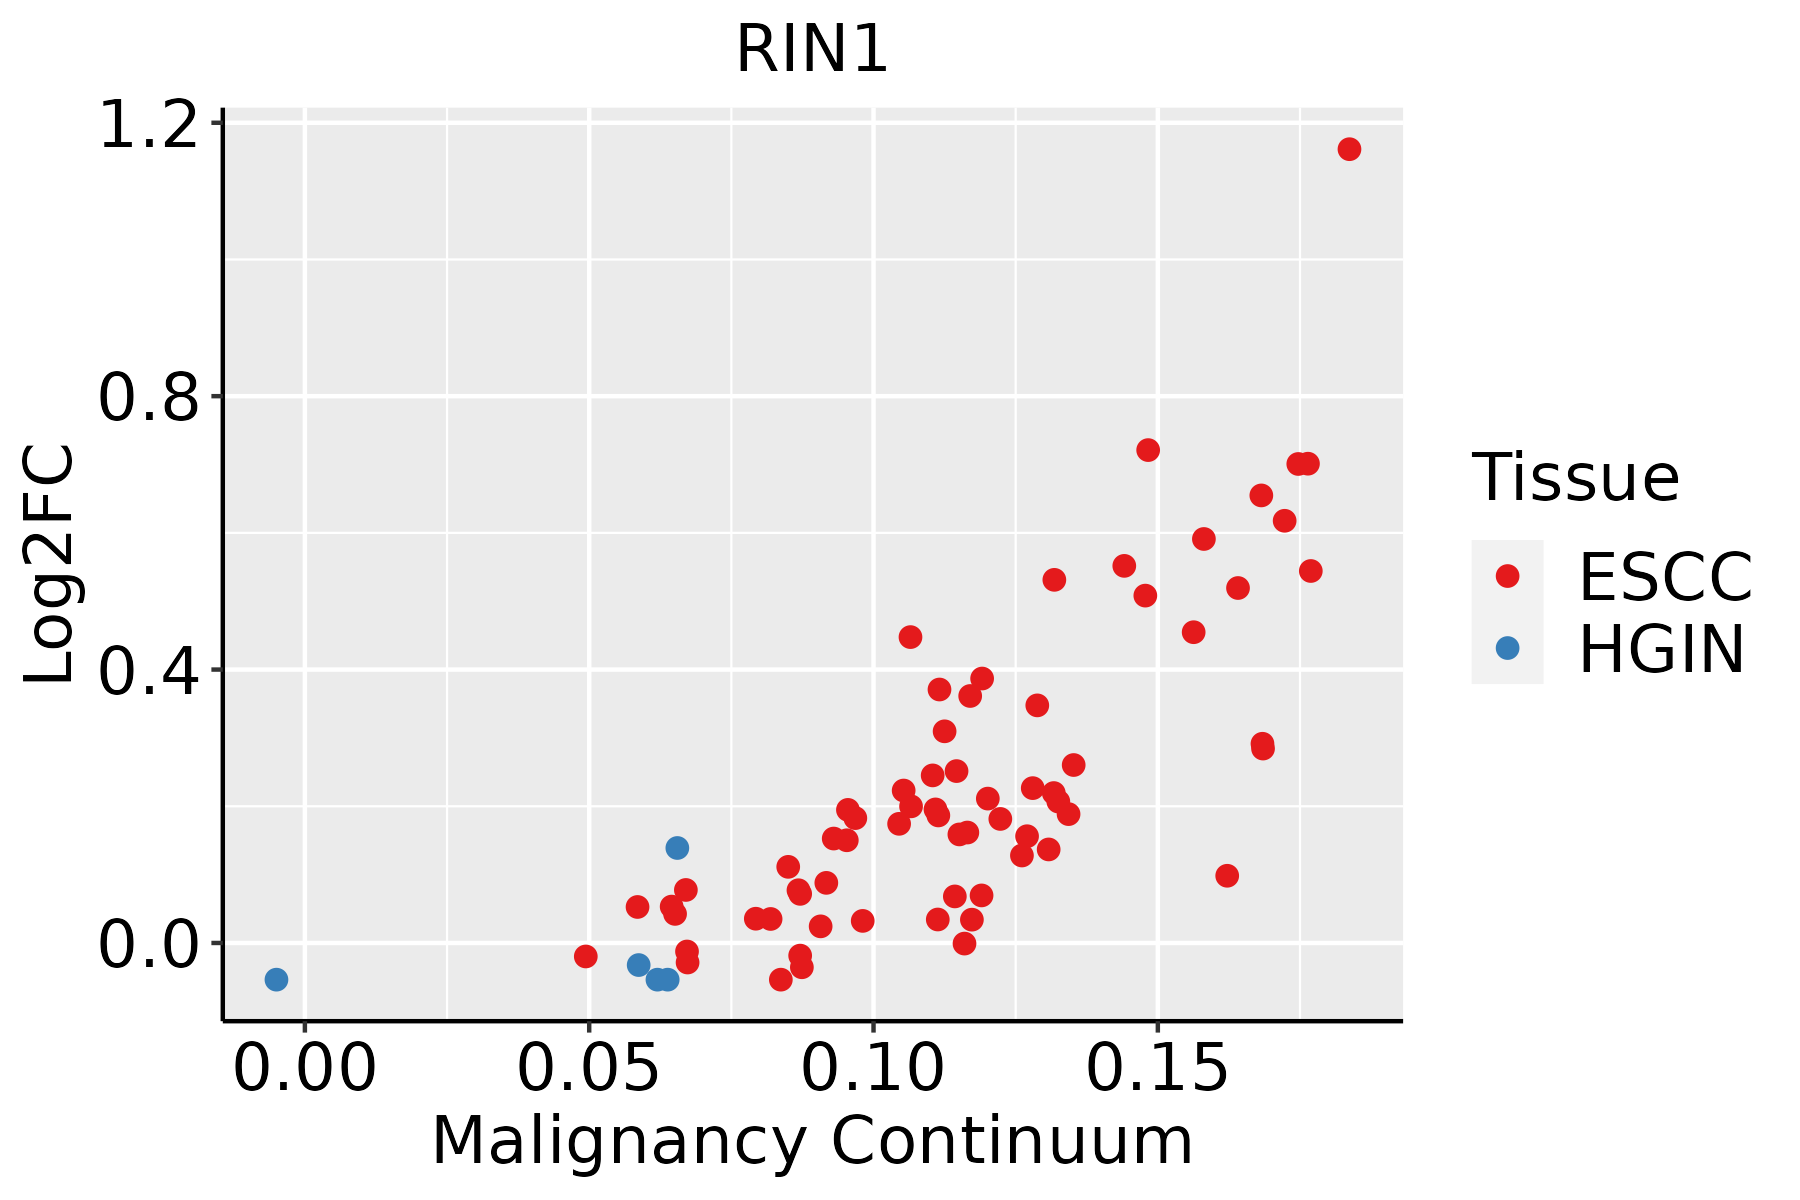
ESCC: Esophageal squamous cell carcinoma
HGIN: High-grade intraepithelial neoplasias
LGIN: Low-grade intraepithelial neoplasias
Oral CavityThe image shows the transcriptomic changes along malignancy continuum.log2FC in expression of this searched gene in stem-like cells from each diseased tissue sample relative to stem-like cells in normal samples in each tissue plotted against the malignancy continuum. Samples are colored based on if they are from different disease stage.
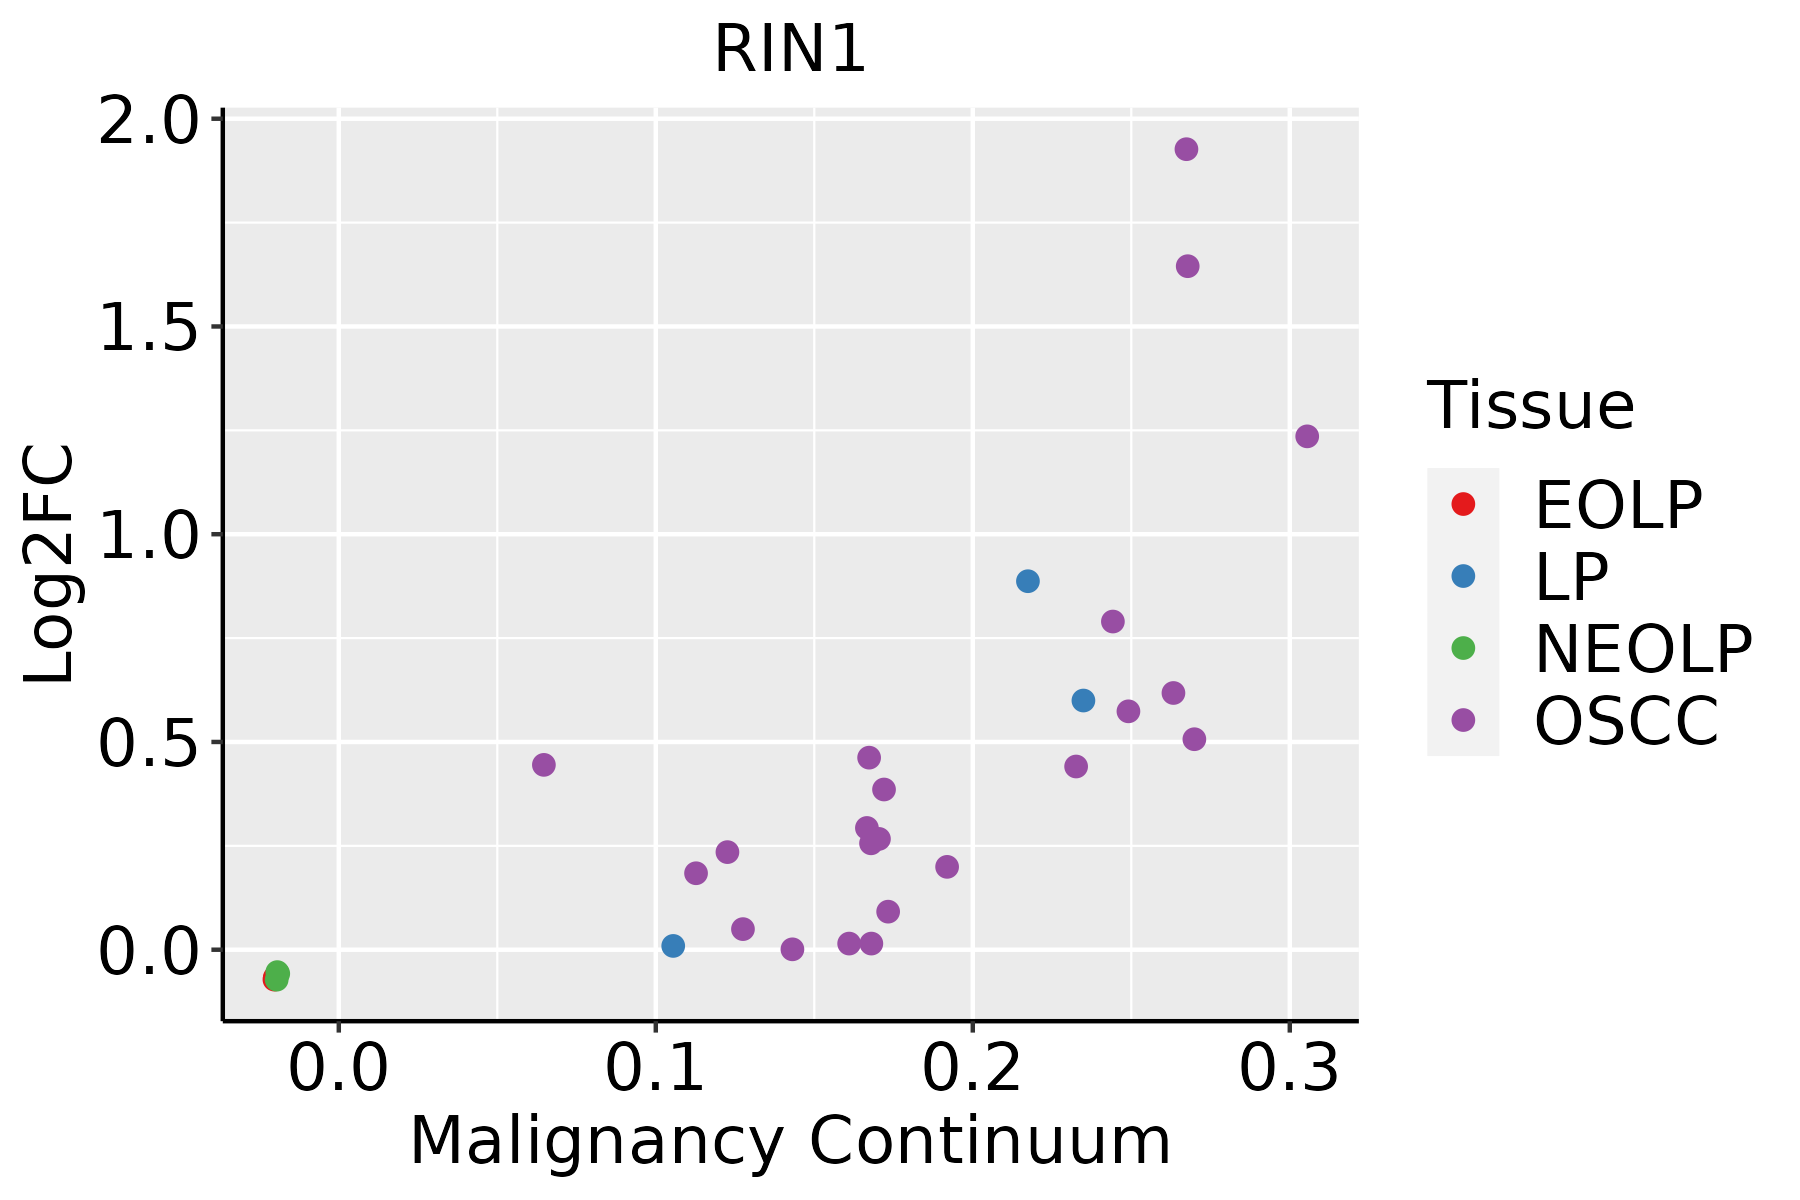
EOLP: Erosive Oral lichen planus
LP: leukoplakia
NEOLP: Non-erosive oral lichen planus
OSCC: Oral squamous cell carcinoma
SkinThe image shows the transcriptomic changes along malignancy continuum.log2FC in expression of this searched gene in stem-like cells from each diseased tissue sample relative to stem-like cells in normal samples in each tissue plotted against the malignancy continuum. Samples are colored based on if they are from different disease stage.
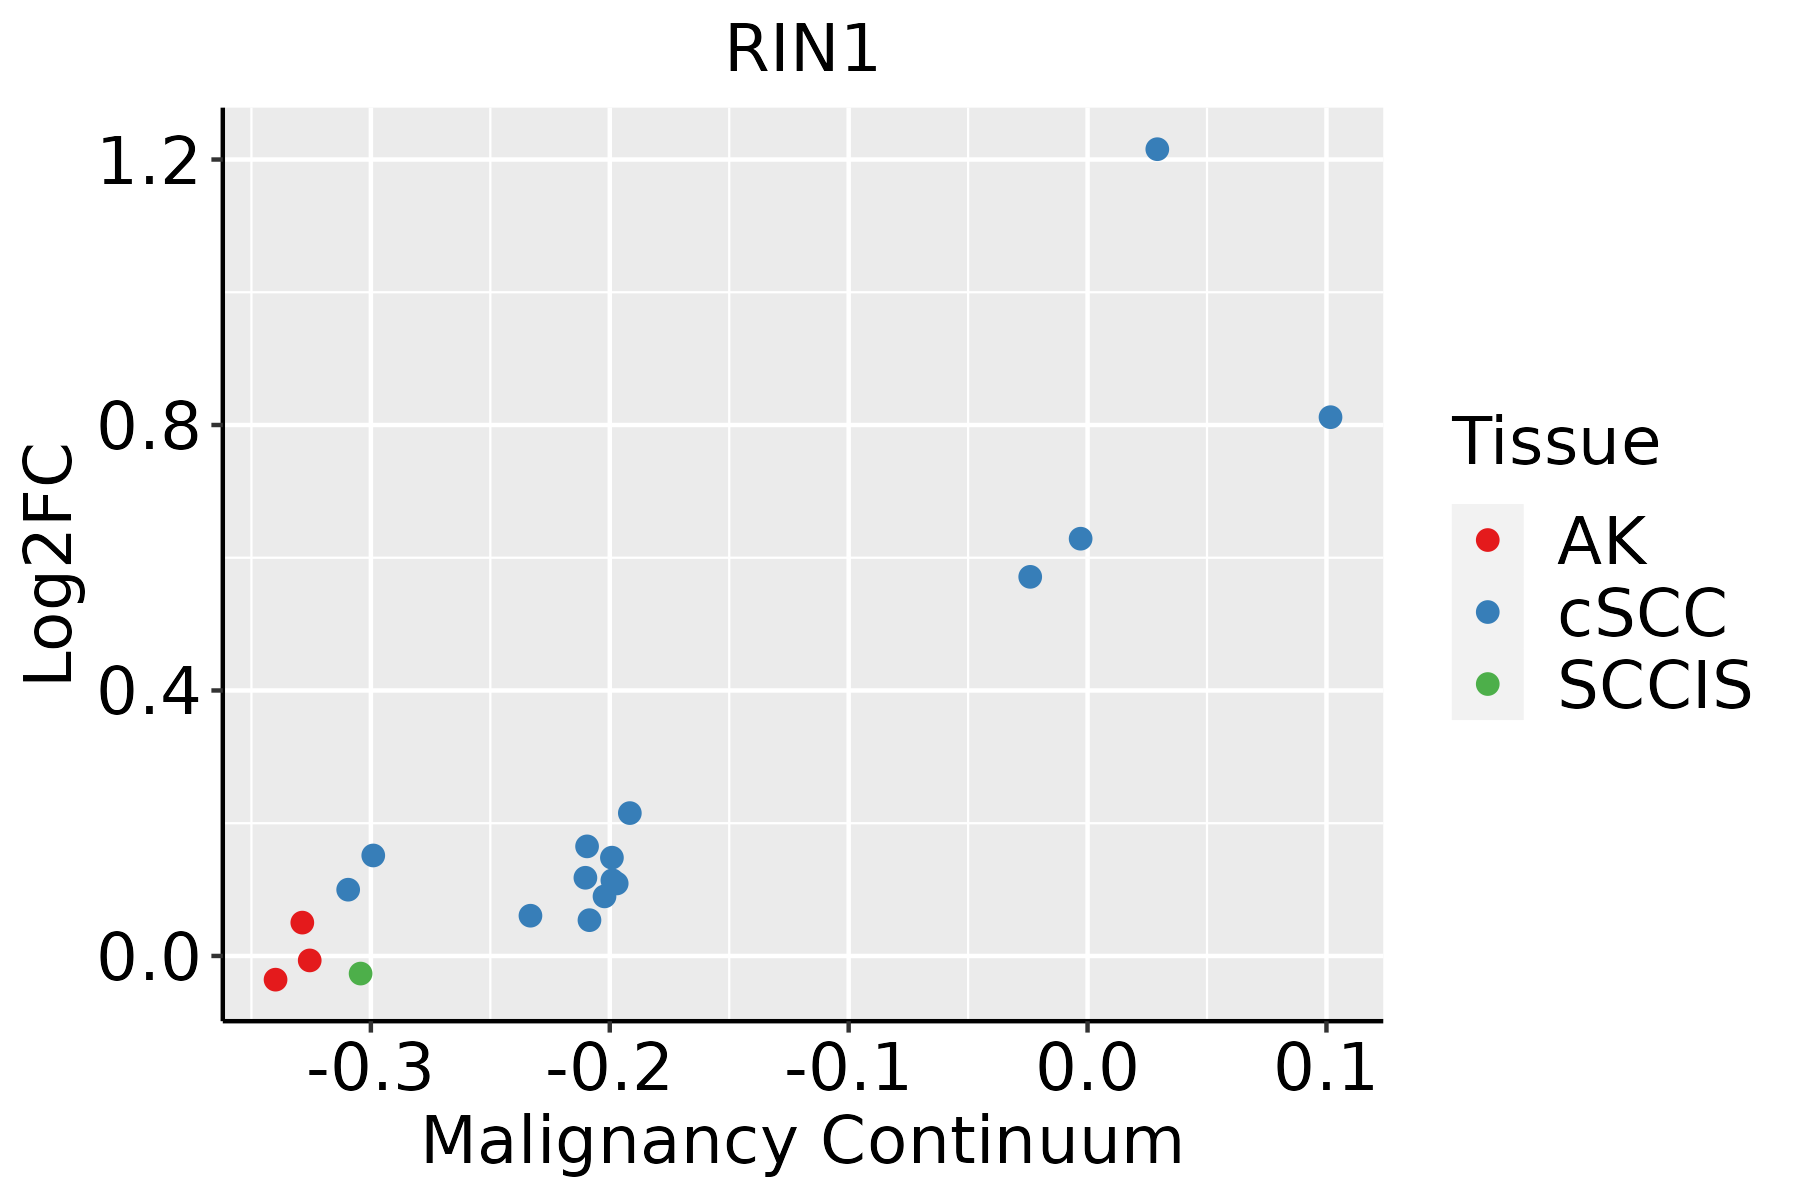
AK: Actinic keratosis
cSCC: Cutaneous squamous cell carcinoma
SCCIS:squamous cell carcinoma in situ
ThyroidThe image shows the transcriptomic changes along malignancy continuum.log2FC in expression of this searched gene in stem-like cells from each diseased tissue sample relative to stem-like cells in normal samples in each tissue plotted against the malignancy continuum. Samples are colored based on if they are from different disease stage.
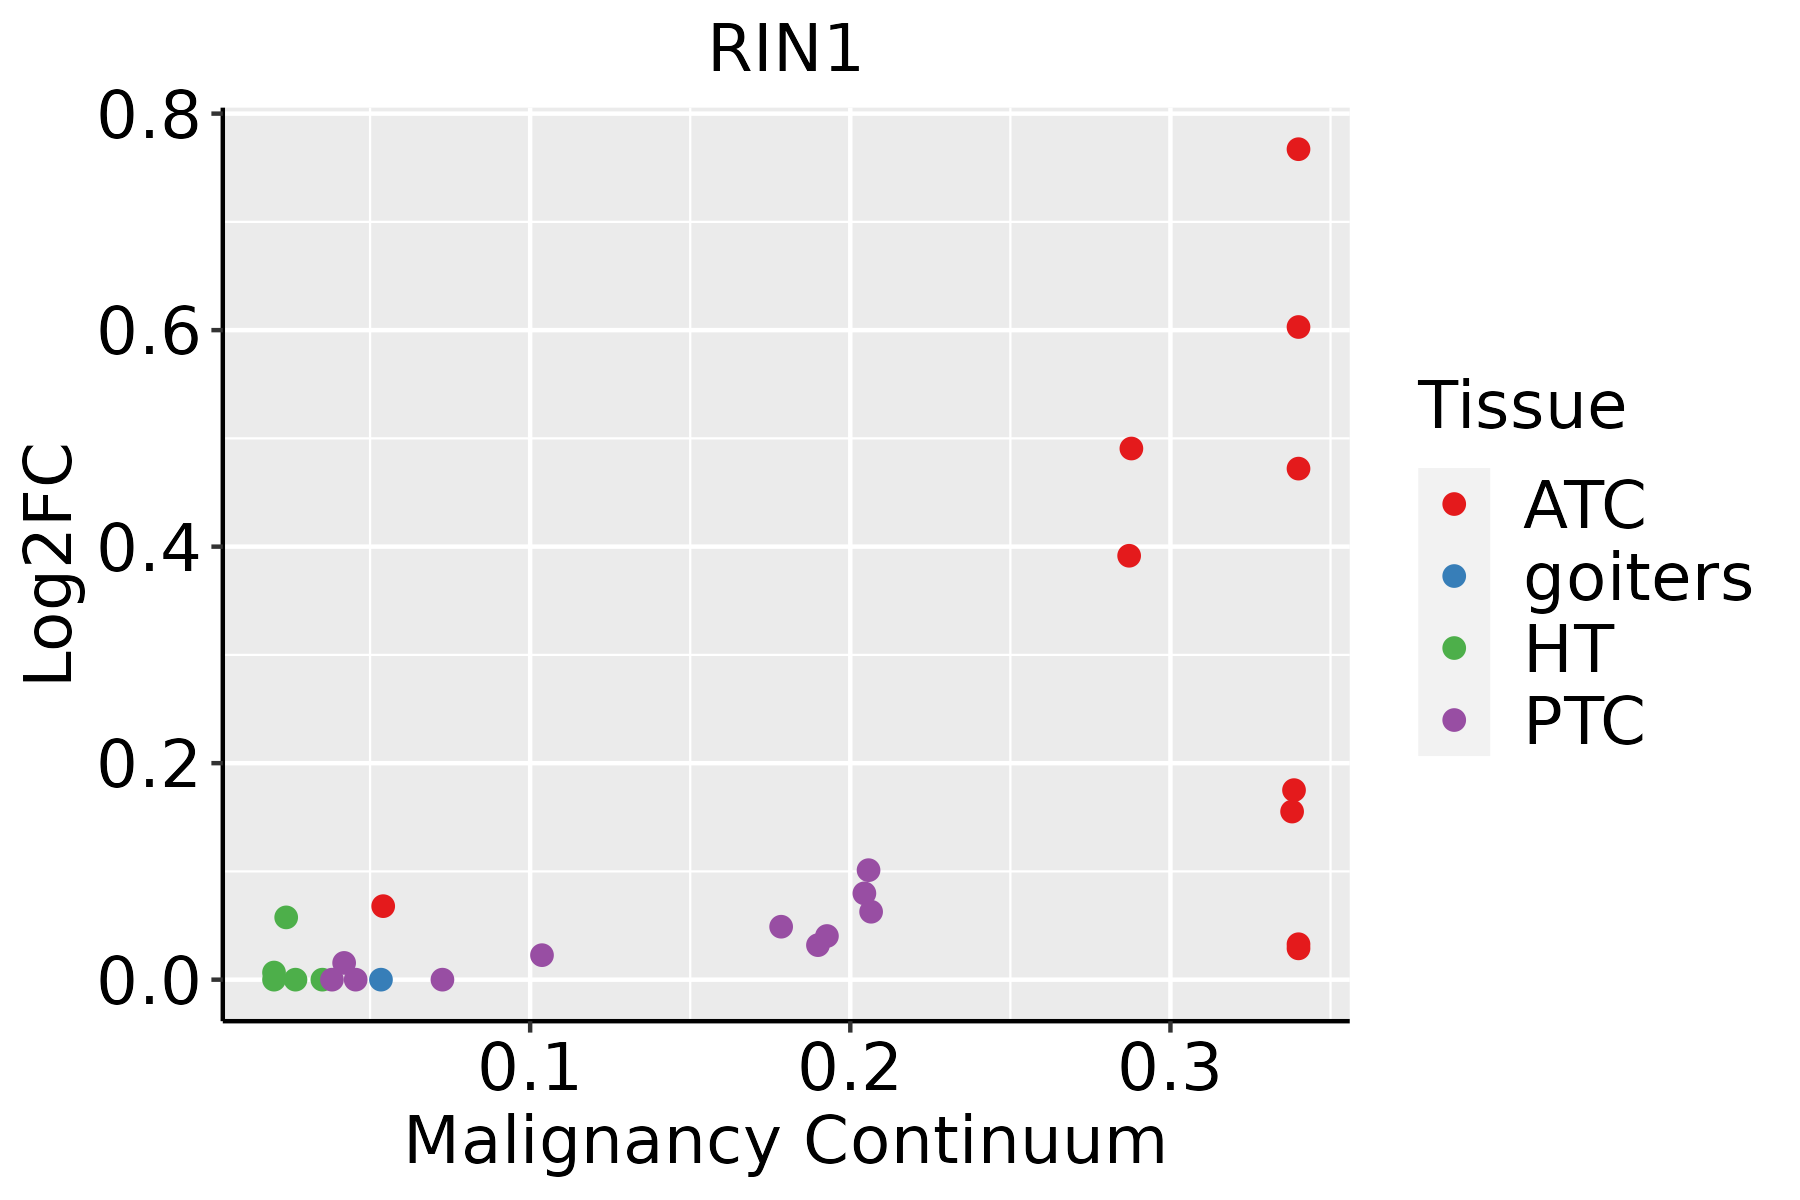
ATC: Anaplastic thyroid cancer
HT: Hashimoto's thyroiditis
PTC: Papillary thyroid cancer
∗log2FC in expression of this searched gene in stem-like cells from each diseased tissue sample relative to stem-like cells in normal samples in each tissue plotted against the malignancy continuum. Samples are colored based on if they are from different disease stage.

Top

Malignant transformation related pathway analysis

check buttonFind out the enriched GO biological processes and KEGG pathways involved in transition from healthy to precancer to cancer
check button Figure of enriched GO biological processes.
TissueDisease StageEnriched GO biological Processes
ColorectumADGO analysis - Figure of enriched GO biological processes: Top 15 enriched GO BP terms are showed in the bar plot of each disease state in each tissue. Each row represents a significant GO biological process which is colored according to the -log10(p.adjust).
ColorectumSERGO analysis - Figure of enriched GO biological processes: Top 15 enriched GO BP terms are showed in the bar plot of each disease state in each tissue. Each row represents a significant GO biological process which is colored according to the -log10(p.adjust).
ColorectumMSSGO analysis - Figure of enriched GO biological processes: Top 15 enriched GO BP terms are showed in the bar plot of each disease state in each tissue. Each row represents a significant GO biological process which is colored according to the -log10(p.adjust).
ColorectumMSI-HGO analysis - Figure of enriched GO biological processes: Top 15 enriched GO BP terms are showed in the bar plot of each disease state in each tissue. Each row represents a significant GO biological process which is colored according to the -log10(p.adjust).
ColorectumFAPGO analysis - Figure of enriched GO biological processes: Top 15 enriched GO BP terms are showed in the bar plot of each disease state in each tissue. Each row represents a significant GO biological process which is colored according to the -log10(p.adjust).
∗Top 15 enriched GO BP terms are showed in the bar plot of each disease state in each tissue. Each row represents a significant GO biological process which is colored according to the -log10(p.adjust).
Page: 1 2 3 4 5 6 7 8 9 

check button Enriched GO biological processes.
GO IDTissueDisease StageDescriptionGene RatioBg Ratiopvaluep.adjustCount
GO:001076919Oral cavityLPregulation of cell morphogenesis involved in differentiation35/462396/187236.68e-033.89e-0235
GO:000641726Oral cavityEOLPregulation of translation108/2218468/187234.04e-127.34e-10108
GO:002260425Oral cavityEOLPregulation of cell morphogenesis69/2218309/187231.21e-074.01e-0669
GO:003134621Oral cavityEOLPpositive regulation of cell projection organization74/2218353/187236.00e-071.56e-0574
GO:001635815Oral cavityEOLPdendrite development55/2218243/187231.43e-063.42e-0555
GO:001097515Oral cavityEOLPregulation of neuron projection development86/2218445/187232.75e-066.05e-0586
GO:001714813Oral cavityEOLPnegative regulation of translation54/2218245/187234.15e-068.72e-0554
GO:003424913Oral cavityEOLPnegative regulation of cellular amide metabolic process58/2218273/187236.23e-061.22e-0458
GO:006099614Oral cavityEOLPdendritic spine development27/221899/187232.21e-053.37e-0427
GO:001072021Oral cavityEOLPpositive regulation of cell development59/2218298/187234.72e-056.25e-0459
GO:00488137Oral cavityEOLPdendrite morphogenesis34/2218146/187237.56e-059.19e-0434
GO:00609986Oral cavityEOLPregulation of dendritic spine development18/221861/187231.69e-041.78e-0318
GO:001076923Oral cavityEOLPregulation of cell morphogenesis involved in differentiation24/221896/187232.68e-042.58e-0324
GO:001097621Oral cavityEOLPpositive regulation of neuron projection development35/2218163/187233.25e-043.03e-0335
GO:01060279Oral cavityEOLPneuron projection organization23/221893/187234.20e-043.72e-0323
GO:001077016Oral cavityEOLPpositive regulation of cell morphogenesis involved in differentiation20/221879/187237.07e-045.78e-0320
GO:00609993Oral cavityEOLPpositive regulation of dendritic spine development13/221842/187238.03e-046.31e-0313
GO:00970618Oral cavityEOLPdendritic spine organization20/221884/187231.60e-031.07e-0220
GO:005076912Oral cavityEOLPpositive regulation of neurogenesis42/2218225/187231.83e-031.19e-0242
GO:005076712Oral cavityEOLPregulation of neurogenesis61/2218364/187233.20e-031.86e-0261
Page: 1 2 3 4 5 6 7 8 9 10 11 12 13 14 15 16 17 18 19 20 21 22 23 24 25 

check button Enriched KEGG pathways.
Pathway IDTissueDisease StageDescriptionGene RatioBg Ratiopvaluep.adjustqvalueCount
Page: 1 

Top

Cell-cell communication analysis

check buttonIdentification of potential cell-cell interactions between two cell types and their ligand-receptor pairs for different disease states
LigandReceptorLRpairPathwayTissueDisease Stage
Page: 1 

Top

Single-cell gene regulatory network inference analysis

check buttonFind out the significant the regulons (TFs) and the target genes of each regulon across cell types for different disease states
TFCell TypeTissueDisease StageTarget GeneRSSRegulon Activity
∗The dot plots of a searched regulon are shown for all cell subpopulations in each disease state of each tissue based on the regulon specific score inferred using pySCENIC and by calculating the average expression.
Page: 1 

Top

Somatic mutation of malignant transformation related genes

check buttonAnnotation of somatic variants for genes involved in malignant transformation
Hugo SymbolVariant ClassVariant ClassificationdbSNP RSHGVScHGVSpHGVSp ShortSWISSPROTBIOTYPESIFTPolyPhenTumor Sample BarcodeTissueHistologySexAgeStageTherapy TypesDrugsOutcome
RIN1SNVMissense_Mutationnovelc.1624N>Gp.Leu542Valp.L542VQ13671protein_codingtolerated(0.46)benign(0.19)TCGA-5L-AAT1-01Breastbreast invasive carcinomaFemale<65III/IVHormone TherapyletrozolSD
RIN1SNVMissense_Mutationnovelc.2022N>Ap.Phe674Leup.F674LQ13671protein_codingdeleterious(0)probably_damaging(0.93)TCGA-A1-A0SE-01Breastbreast invasive carcinomaFemale<65I/IIUnknownUnknownSD
RIN1SNVMissense_Mutationc.73C>Gp.Leu25Valp.L25VQ13671protein_codingtolerated_low_confidence(0.1)benign(0.069)TCGA-A7-A0DA-01Breastbreast invasive carcinomaFemale<65I/IIChemotherapyadriamycinSD
RIN1SNVMissense_Mutationnovelc.1291G>Ap.Val431Ilep.V431IQ13671protein_codingtolerated(0.24)benign(0.005)TCGA-AO-A03V-01Breastbreast invasive carcinomaFemale<65I/IIChemotherapyfluorouracilSD
RIN1SNVMissense_Mutationc.803N>Gp.Pro268Argp.P268RQ13671protein_codingdeleterious(0.02)probably_damaging(0.999)TCGA-D8-A27T-01Breastbreast invasive carcinomaFemale<65III/IVChemotherapydoxorubicine+cyclophosphamideSD
RIN1SNVMissense_Mutationrs62619978c.2245N>Tp.Arg749Trpp.R749WQ13671protein_codingdeleterious_low_confidence(0.03)benign(0.183)TCGA-E9-A1RF-01Breastbreast invasive carcinomaFemale>=65III/IVHormone TherapytamoxiphenSD
RIN1insertionNonsense_Mutationnovelc.1822_1823insCATAGCTGCATCCAAAAGAGGCCCAGGTCATCTAACCTAAGGAGAATp.Arg608ProfsTer2p.R608Pfs*2Q13671protein_codingTCGA-A2-A0CP-01Breastbreast invasive carcinomaFemale<65I/IIChemotherapycytoxanSD
RIN1insertionFrame_Shift_Insnovelc.1770_1771insACTTGTTTTTGCTTCTCCTCCTGCATAGCACCTCCTCCGAGTAGp.Gly591ThrfsTer25p.G591Tfs*25Q13671protein_codingTCGA-A8-A07R-01Breastbreast invasive carcinomaFemale>=65III/IVAncillaryzoledronicSD
RIN1insertionNonsense_Mutationnovelc.1770_1771insAATAGGACCTACCTCCTGGGGTTGAGGTGAAGATTAAATGp.Gly591AsnfsTer10p.G591Nfs*10Q13671protein_codingTCGA-AQ-A04J-01Breastbreast invasive carcinomaFemale<65I/IIChemotherapycytoxanSD
RIN1SNVMissense_Mutationnovelc.1922N>Tp.Ser641Phep.S641FQ13671protein_codingdeleterious(0)probably_damaging(0.978)TCGA-C5-A7X5-01Cervixcervical & endocervical cancerFemale>=65I/IIChemotherapycarboplatinPD
Page: 1 2 3 4 5 

Top

Related drugs of malignant transformation related genes

check buttonIdentification of chemicals and drugs interact with genes involved in malignant transfromation
(DGIdb 4.0)
Entrez IDSymbolCategoryInteraction TypesDrug Claim NameDrug NamePMIDs
Page: 1