
|
|||||
|
 | |
| |
| |
| |
| |
| |
|
Gene: RAD50 |
Gene summary for RAD50 |
| Gene information | Species | Human | Gene symbol | RAD50 | Gene ID | 10111 |
| Gene name | RAD50 double strand break repair protein | |
| Gene Alias | NBSLD | |
| Cytomap | 5q31.1 | |
| Gene Type | protein-coding | GO ID | GO:0000003 | UniProtAcc | A5D6Y3 |
Top |
Malignant transformation analysis |
| Identification of the aberrant gene expression in precancerous and cancerous lesions by comparing the gene expression of stem-like cells in diseased tissues with normal stem cells |
| Entrez ID | Symbol | Replicates | Species | Organ | Tissue | Adj P-value | Log2FC | Malignancy |
| 10111 | RAD50 | HTA11_3410_2000001011 | Human | Colorectum | AD | 2.04e-18 | 3.61e-01 | 0.0155 |
| 10111 | RAD50 | HTA11_2487_2000001011 | Human | Colorectum | SER | 2.11e-13 | 4.23e-01 | -0.1808 |
| 10111 | RAD50 | HTA11_2951_2000001011 | Human | Colorectum | AD | 2.77e-05 | 4.13e-01 | 0.0216 |
| 10111 | RAD50 | HTA11_1938_2000001011 | Human | Colorectum | AD | 2.17e-18 | 6.22e-01 | -0.0811 |
| 10111 | RAD50 | HTA11_78_2000001011 | Human | Colorectum | AD | 3.35e-35 | 8.36e-01 | -0.1088 |
| 10111 | RAD50 | HTA11_347_2000001011 | Human | Colorectum | AD | 2.77e-44 | 8.35e-01 | -0.1954 |
| 10111 | RAD50 | HTA11_411_2000001011 | Human | Colorectum | SER | 1.06e-05 | 5.03e-01 | -0.2602 |
| 10111 | RAD50 | HTA11_2112_2000001011 | Human | Colorectum | SER | 6.10e-04 | 3.35e-01 | -0.2196 |
| 10111 | RAD50 | HTA11_3361_2000001011 | Human | Colorectum | AD | 1.12e-11 | 3.57e-01 | -0.1207 |
| 10111 | RAD50 | HTA11_83_2000001011 | Human | Colorectum | SER | 1.56e-13 | 4.74e-01 | -0.1526 |
| 10111 | RAD50 | HTA11_696_2000001011 | Human | Colorectum | AD | 2.11e-21 | 4.42e-01 | -0.1464 |
| 10111 | RAD50 | HTA11_866_2000001011 | Human | Colorectum | AD | 6.91e-23 | 3.92e-01 | -0.1001 |
| 10111 | RAD50 | HTA11_1391_2000001011 | Human | Colorectum | AD | 2.78e-15 | 4.34e-01 | -0.059 |
| 10111 | RAD50 | HTA11_2992_2000001011 | Human | Colorectum | SER | 2.92e-05 | 6.21e-01 | -0.1706 |
| 10111 | RAD50 | HTA11_5212_2000001011 | Human | Colorectum | AD | 3.35e-04 | 2.78e-01 | -0.2061 |
| 10111 | RAD50 | HTA11_5216_2000001011 | Human | Colorectum | SER | 1.66e-04 | 3.33e-01 | -0.1462 |
| 10111 | RAD50 | HTA11_546_2000001011 | Human | Colorectum | AD | 4.12e-15 | 5.03e-01 | -0.0842 |
| 10111 | RAD50 | HTA11_9341_2000001011 | Human | Colorectum | SER | 1.32e-03 | 3.29e-01 | -0.00410000000000005 |
| 10111 | RAD50 | HTA11_7862_2000001011 | Human | Colorectum | AD | 4.90e-08 | 3.53e-01 | -0.0179 |
| 10111 | RAD50 | HTA11_866_3004761011 | Human | Colorectum | AD | 9.15e-12 | 3.32e-01 | 0.096 |
| Page: 1 2 3 4 5 6 7 8 9 |
| Tissue | Expression Dynamics | Abbreviation |
| Colorectum (GSE201348) |  | FAP: Familial adenomatous polyposis |
| CRC: Colorectal cancer | ||
| Colorectum (HTA11) |  | AD: Adenomas |
| SER: Sessile serrated lesions | ||
| MSI-H: Microsatellite-high colorectal cancer | ||
| MSS: Microsatellite stable colorectal cancer | ||
| Esophagus | 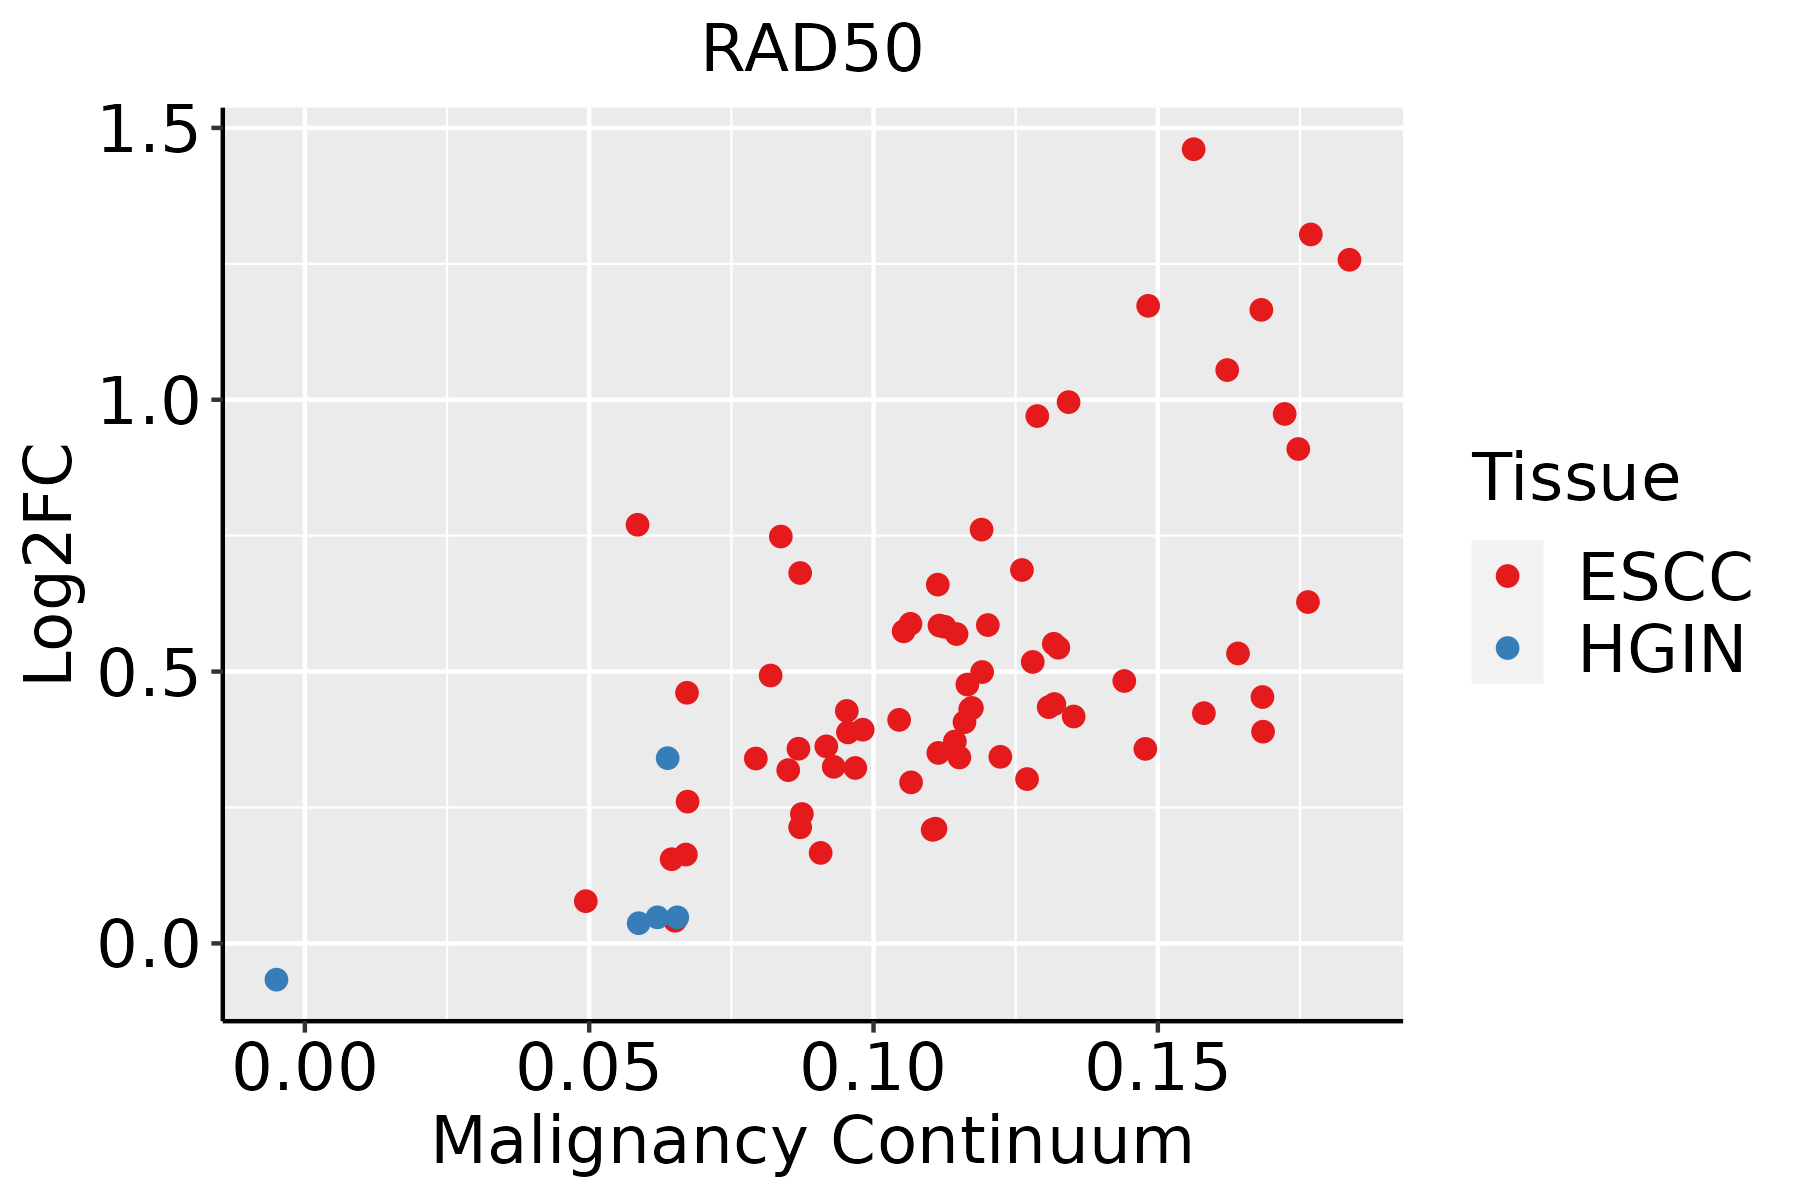 | ESCC: Esophageal squamous cell carcinoma |
| HGIN: High-grade intraepithelial neoplasias | ||
| LGIN: Low-grade intraepithelial neoplasias | ||
| Liver | 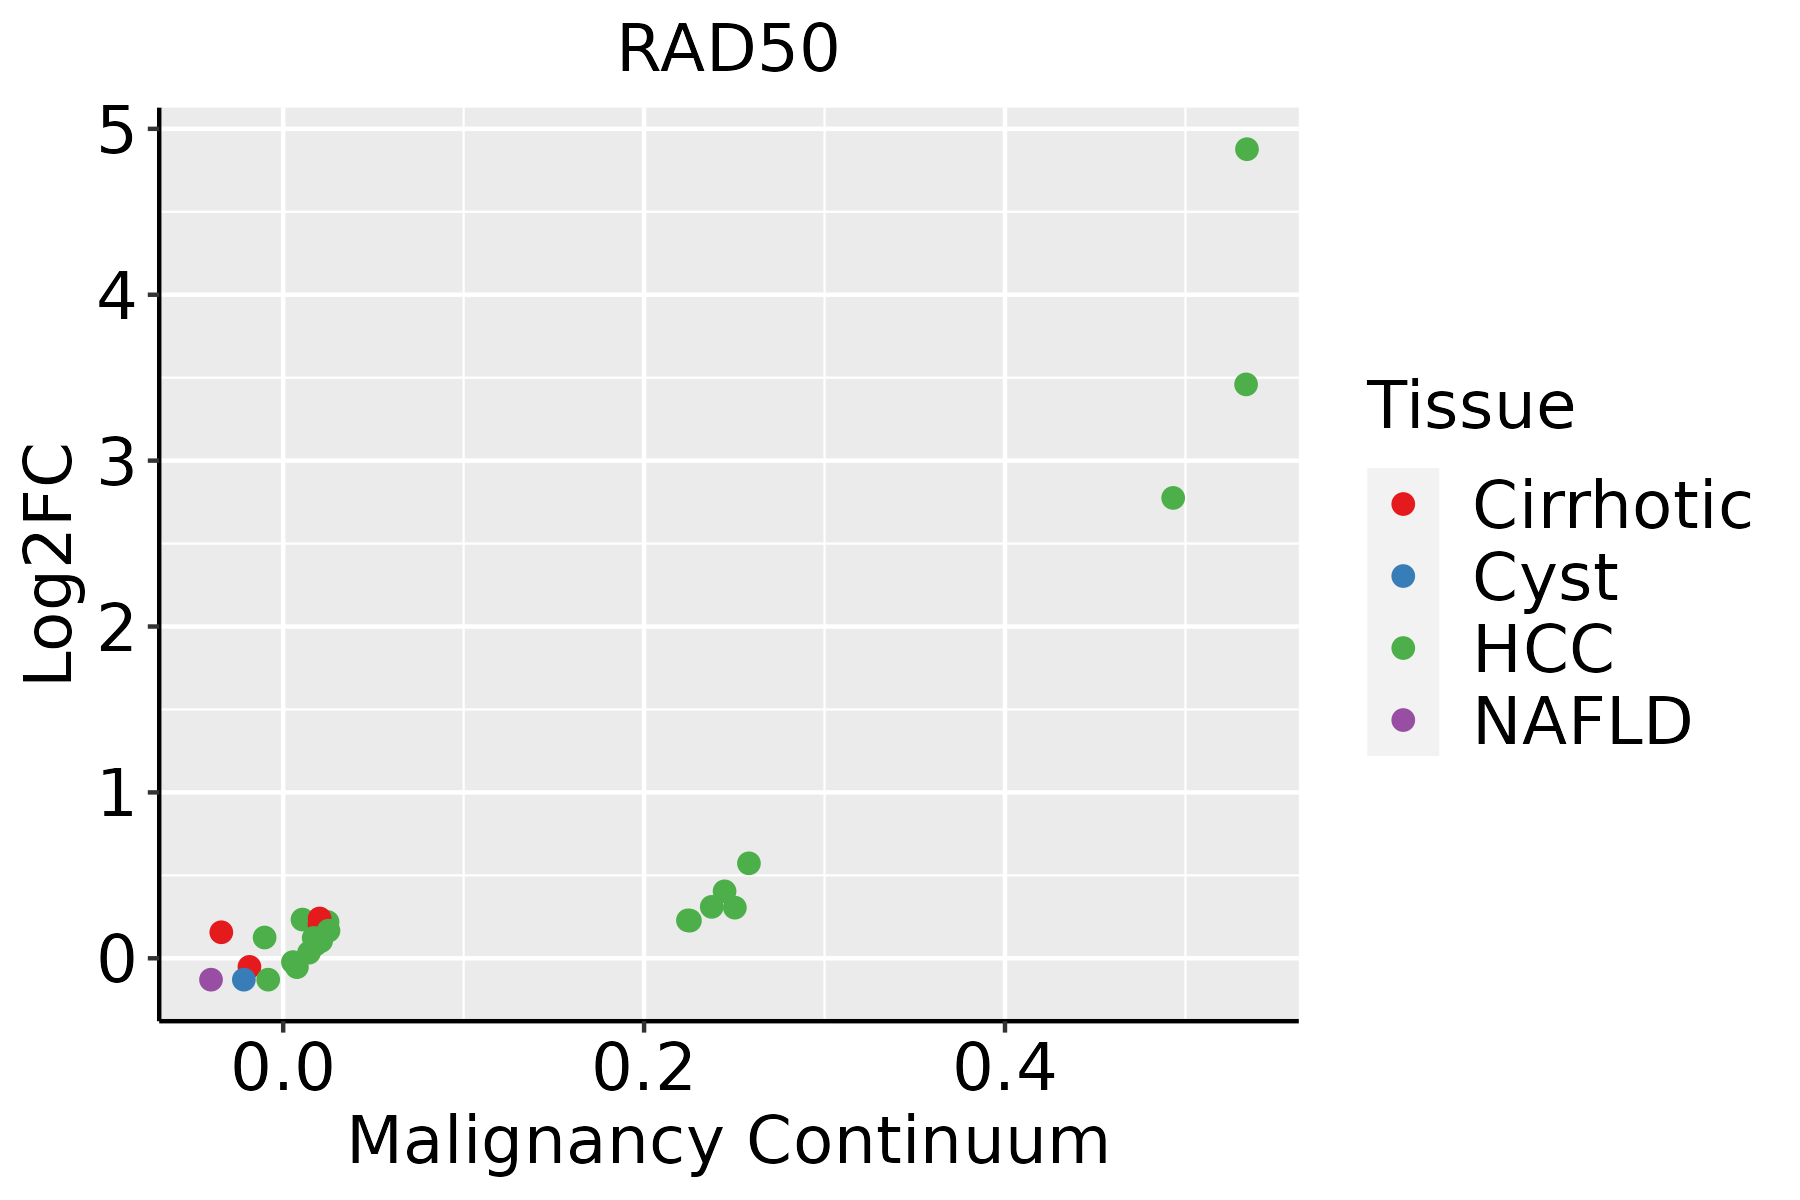 | HCC: Hepatocellular carcinoma |
| NAFLD: Non-alcoholic fatty liver disease | ||
| Oral Cavity | 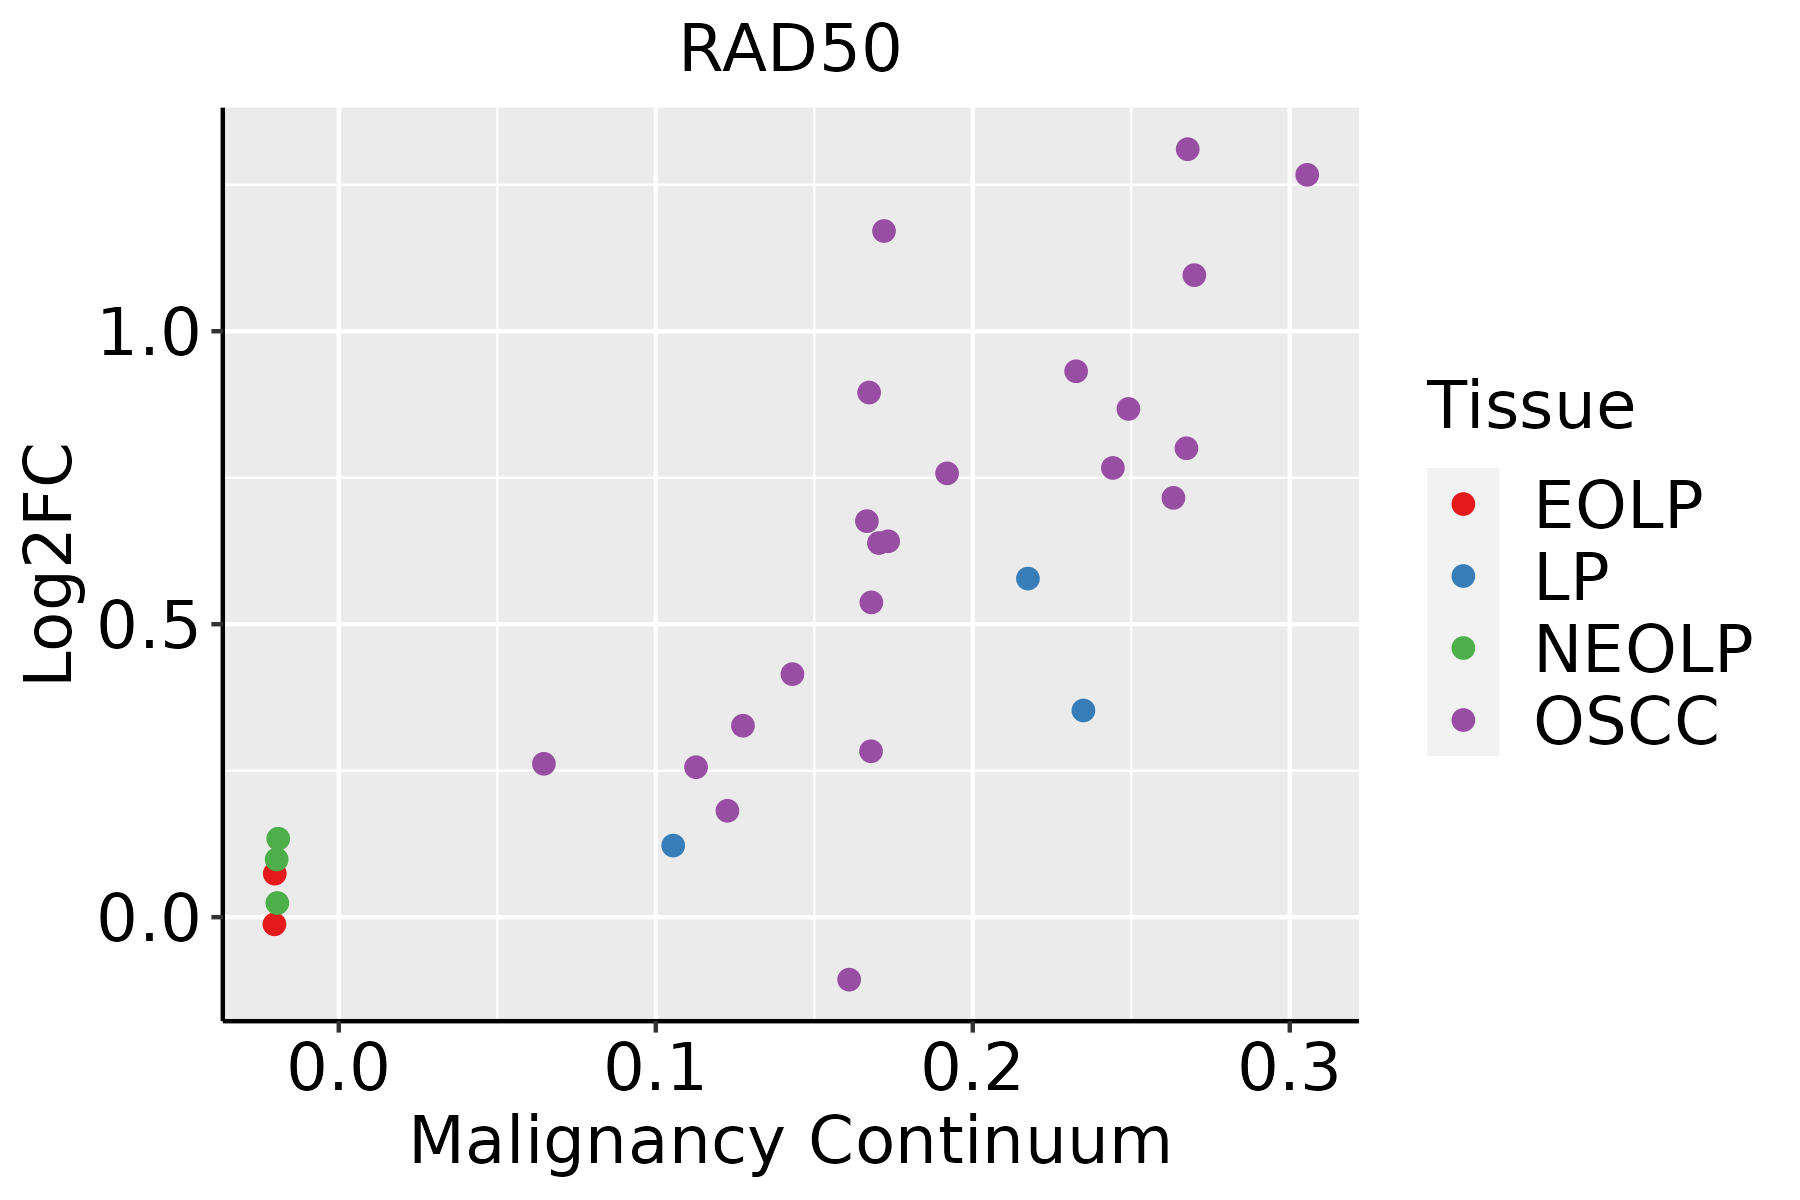 | EOLP: Erosive Oral lichen planus |
| LP: leukoplakia | ||
| NEOLP: Non-erosive oral lichen planus | ||
| OSCC: Oral squamous cell carcinoma | ||
| Prostate |  | BPH: Benign Prostatic Hyperplasia |
| Skin |  | AK: Actinic keratosis |
| cSCC: Cutaneous squamous cell carcinoma | ||
| SCCIS:squamous cell carcinoma in situ |
| ∗log2FC in expression of this searched gene in stem-like cells from each diseased tissue sample relative to stem-like cells in normal samples in each tissue plotted against the malignancy continuum. Samples are colored based on if they are from different disease stage. |
Top |
Malignant transformation related pathway analysis |
| Find out the enriched GO biological processes and KEGG pathways involved in transition from healthy to precancer to cancer |
| Tissue | Disease Stage | Enriched GO biological Processes |
| Colorectum | AD |  |
| Colorectum | SER |  |
| Colorectum | MSS |  |
| Colorectum | MSI-H |  |
| Colorectum | FAP |  |
| ∗Top 15 enriched GO BP terms are showed in the bar plot of each disease state in each tissue. Each row represents a significant GO biological process which is colored according to the -log10(p.adjust). |
| Page: 1 2 3 4 5 6 7 8 9 |
| GO ID | Tissue | Disease Stage | Description | Gene Ratio | Bg Ratio | pvalue | p.adjust | Count |
| GO:0010639111 | Skin | cSCC | negative regulation of organelle organization | 140/4864 | 348/18723 | 3.35e-09 | 1.15e-07 | 140 |
| GO:003220419 | Skin | cSCC | regulation of telomere maintenance | 45/4864 | 80/18723 | 8.82e-09 | 2.76e-07 | 45 |
| GO:0007004110 | Skin | cSCC | telomere maintenance via telomerase | 40/4864 | 69/18723 | 1.83e-08 | 5.45e-07 | 40 |
| GO:2001252110 | Skin | cSCC | positive regulation of chromosome organization | 45/4864 | 82/18723 | 2.47e-08 | 6.89e-07 | 45 |
| GO:0010833110 | Skin | cSCC | telomere maintenance via telomere lengthening | 43/4864 | 81/18723 | 1.79e-07 | 3.94e-06 | 43 |
| GO:0032206110 | Skin | cSCC | positive regulation of telomere maintenance | 31/4864 | 52/18723 | 3.06e-07 | 6.21e-06 | 31 |
| GO:005105217 | Skin | cSCC | regulation of DNA metabolic process | 136/4864 | 359/18723 | 3.83e-07 | 7.58e-06 | 136 |
| GO:000627818 | Skin | cSCC | RNA-dependent DNA biosynthetic process | 40/4864 | 75/18723 | 4.04e-07 | 7.92e-06 | 40 |
| GO:20012514 | Skin | cSCC | negative regulation of chromosome organization | 43/4864 | 86/18723 | 1.53e-06 | 2.61e-05 | 43 |
| GO:003239215 | Skin | cSCC | DNA geometric change | 44/4864 | 90/18723 | 2.53e-06 | 4.06e-05 | 44 |
| GO:003220015 | Skin | cSCC | telomere organization | 68/4864 | 159/18723 | 2.94e-06 | 4.62e-05 | 68 |
| GO:007189718 | Skin | cSCC | DNA biosynthetic process | 74/4864 | 180/18723 | 6.33e-06 | 8.92e-05 | 74 |
| GO:005105419 | Skin | cSCC | positive regulation of DNA metabolic process | 80/4864 | 201/18723 | 1.16e-05 | 1.50e-04 | 80 |
| GO:003250814 | Skin | cSCC | DNA duplex unwinding | 40/4864 | 84/18723 | 1.58e-05 | 1.94e-04 | 40 |
| GO:00903054 | Skin | cSCC | nucleic acid phosphodiester bond hydrolysis | 97/4864 | 261/18723 | 4.08e-05 | 4.34e-04 | 97 |
| GO:004677715 | Skin | cSCC | protein autophosphorylation | 84/4864 | 227/18723 | 1.53e-04 | 1.35e-03 | 84 |
| GO:00063025 | Skin | cSCC | double-strand break repair | 89/4864 | 251/18723 | 5.23e-04 | 3.92e-03 | 89 |
| GO:003367425 | Skin | cSCC | positive regulation of kinase activity | 148/4864 | 467/18723 | 3.00e-03 | 1.66e-02 | 148 |
| GO:00711031 | Skin | cSCC | DNA conformation change | 96/4864 | 290/18723 | 3.87e-03 | 2.07e-02 | 96 |
| GO:19043533 | Skin | cSCC | regulation of telomere capping | 13/4864 | 26/18723 | 7.35e-03 | 3.47e-02 | 13 |
| Page: 1 2 3 4 5 6 7 8 9 10 11 12 |
| Pathway ID | Tissue | Disease Stage | Description | Gene Ratio | Bg Ratio | pvalue | p.adjust | qvalue | Count |
| hsa04218 | Colorectum | AD | Cellular senescence | 53/2092 | 156/8465 | 5.55e-03 | 2.48e-02 | 1.58e-02 | 53 |
| hsa042181 | Colorectum | AD | Cellular senescence | 53/2092 | 156/8465 | 5.55e-03 | 2.48e-02 | 1.58e-02 | 53 |
| hsa042182 | Colorectum | MSS | Cellular senescence | 52/1875 | 156/8465 | 7.87e-04 | 5.07e-03 | 3.11e-03 | 52 |
| hsa042183 | Colorectum | MSS | Cellular senescence | 52/1875 | 156/8465 | 7.87e-04 | 5.07e-03 | 3.11e-03 | 52 |
| hsa0421828 | Esophagus | HGIN | Cellular senescence | 42/1383 | 156/8465 | 4.94e-04 | 5.03e-03 | 4.00e-03 | 42 |
| hsa04218111 | Esophagus | HGIN | Cellular senescence | 42/1383 | 156/8465 | 4.94e-04 | 5.03e-03 | 4.00e-03 | 42 |
| hsa0421829 | Esophagus | ESCC | Cellular senescence | 119/4205 | 156/8465 | 5.89e-12 | 9.40e-11 | 4.81e-11 | 119 |
| hsa0421838 | Esophagus | ESCC | Cellular senescence | 119/4205 | 156/8465 | 5.89e-12 | 9.40e-11 | 4.81e-11 | 119 |
| hsa042187 | Liver | Cirrhotic | Cellular senescence | 66/2530 | 156/8465 | 5.94e-04 | 3.60e-03 | 2.22e-03 | 66 |
| hsa0421812 | Liver | Cirrhotic | Cellular senescence | 66/2530 | 156/8465 | 5.94e-04 | 3.60e-03 | 2.22e-03 | 66 |
| hsa0421822 | Liver | HCC | Cellular senescence | 102/4020 | 156/8465 | 4.18e-06 | 3.59e-05 | 2.00e-05 | 102 |
| hsa0421832 | Liver | HCC | Cellular senescence | 102/4020 | 156/8465 | 4.18e-06 | 3.59e-05 | 2.00e-05 | 102 |
| hsa0421820 | Oral cavity | OSCC | Cellular senescence | 112/3704 | 156/8465 | 8.04e-13 | 1.42e-11 | 7.21e-12 | 112 |
| hsa04218110 | Oral cavity | OSCC | Cellular senescence | 112/3704 | 156/8465 | 8.04e-13 | 1.42e-11 | 7.21e-12 | 112 |
| hsa0421818 | Prostate | BPH | Cellular senescence | 60/1718 | 156/8465 | 1.07e-07 | 1.18e-06 | 7.32e-07 | 60 |
| hsa0421819 | Prostate | BPH | Cellular senescence | 60/1718 | 156/8465 | 1.07e-07 | 1.18e-06 | 7.32e-07 | 60 |
| hsa0421826 | Prostate | Tumor | Cellular senescence | 61/1791 | 156/8465 | 2.00e-07 | 2.14e-06 | 1.33e-06 | 61 |
| hsa0421836 | Prostate | Tumor | Cellular senescence | 61/1791 | 156/8465 | 2.00e-07 | 2.14e-06 | 1.33e-06 | 61 |
| Page: 1 |
Top |
Cell-cell communication analysis |
| Identification of potential cell-cell interactions between two cell types and their ligand-receptor pairs for different disease states |
| Ligand | Receptor | LRpair | Pathway | Tissue | Disease Stage |
| Page: 1 |
Top |
Single-cell gene regulatory network inference analysis |
| Find out the significant the regulons (TFs) and the target genes of each regulon across cell types for different disease states |
| TF | Cell Type | Tissue | Disease Stage | Target Gene | RSS | Regulon Activity |
| ∗The dot plots of a searched regulon are shown for all cell subpopulations in each disease state of each tissue based on the regulon specific score inferred using pySCENIC and by calculating the average expression. |
| Page: 1 |
Top |
Somatic mutation of malignant transformation related genes |
| Annotation of somatic variants for genes involved in malignant transformation |
| Hugo Symbol | Variant Class | Variant Classification | dbSNP RS | HGVSc | HGVSp | HGVSp Short | SWISSPROT | BIOTYPE | SIFT | PolyPhen | Tumor Sample Barcode | Tissue | Histology | Sex | Age | Stage | Therapy Types | Drugs | Outcome |
| RAD50 | SNV | Missense_Mutation | rs200548021 | c.1604N>A | p.Arg535His | p.R535H | Q92878 | protein_coding | tolerated(0.08) | possibly_damaging(0.847) | TCGA-A8-A09Z-01 | Breast | breast invasive carcinoma | Female | >=65 | I/II | Unknown | Unknown | SD |
| RAD50 | SNV | Missense_Mutation | c.873N>T | p.Glu291Asp | p.E291D | Q92878 | protein_coding | tolerated(0.36) | benign(0.026) | TCGA-AN-A046-01 | Breast | breast invasive carcinoma | Female | >=65 | I/II | Unknown | Unknown | SD | |
| RAD50 | SNV | Missense_Mutation | rs769003601 | c.3206N>T | p.Arg1069Ile | p.R1069I | Q92878 | protein_coding | deleterious(0.02) | benign(0.074) | TCGA-AN-A046-01 | Breast | breast invasive carcinoma | Female | >=65 | I/II | Unknown | Unknown | SD |
| RAD50 | SNV | Missense_Mutation | c.1330G>A | p.Glu444Lys | p.E444K | Q92878 | protein_coding | tolerated(0.51) | benign(0.05) | TCGA-AN-A0XW-01 | Breast | breast invasive carcinoma | Female | <65 | III/IV | Unknown | Unknown | SD | |
| RAD50 | SNV | Missense_Mutation | c.1490N>C | p.Val497Ala | p.V497A | Q92878 | protein_coding | tolerated(0.05) | benign(0.013) | TCGA-B6-A0IM-01 | Breast | breast invasive carcinoma | Female | >=65 | I/II | Unknown | Unknown | SD | |
| RAD50 | SNV | Missense_Mutation | c.1102N>C | p.Asp368His | p.D368H | Q92878 | protein_coding | tolerated(0.08) | probably_damaging(0.996) | TCGA-BH-A18P-01 | Breast | breast invasive carcinoma | Female | <65 | I/II | Unknown | Unknown | PD | |
| RAD50 | SNV | Missense_Mutation | c.1084N>C | p.Glu362Gln | p.E362Q | Q92878 | protein_coding | tolerated(0.52) | benign(0.007) | TCGA-D8-A1J8-01 | Breast | breast invasive carcinoma | Female | >=65 | I/II | Hormone Therapy | nolvadex | SD | |
| RAD50 | SNV | Missense_Mutation | c.2059G>T | p.Val687Phe | p.V687F | Q92878 | protein_coding | tolerated(0.06) | benign(0.3) | TCGA-D8-A1Y1-01 | Breast | breast invasive carcinoma | Female | >=65 | III/IV | Hormone Therapy | tamoxiphen | PD | |
| RAD50 | insertion | Nonsense_Mutation | novel | c.3734_3735insGCCAGCATAGTCCTTA | p.Ala1246ProfsTer3 | p.A1246Pfs*3 | Q92878 | protein_coding | TCGA-AO-A128-01 | Breast | breast invasive carcinoma | Female | <65 | I/II | Chemotherapy | doxorubicin | SD | ||
| RAD50 | deletion | Frame_Shift_Del | rs772667708 | c.2157delN | p.Lys722ArgfsTer14 | p.K722Rfs*14 | Q92878 | protein_coding | TCGA-D8-A1J8-01 | Breast | breast invasive carcinoma | Female | >=65 | I/II | Hormone Therapy | nolvadex | SD |
| Page: 1 2 3 4 5 6 7 8 9 10 11 12 13 14 15 16 17 18 19 20 21 |
Top |
Related drugs of malignant transformation related genes |
| Identification of chemicals and drugs interact with genes involved in malignant transfromation |
| (DGIdb 4.0) |
| Entrez ID | Symbol | Category | Interaction Types | Drug Claim Name | Drug Name | PMIDs |
| 10111 | RAD50 | CLINICALLY ACTIONABLE, KINASE, DNA REPAIR | CHECKPOINT KINASE INHIBITOR AZD7762 | 24934408 | ||
| 10111 | RAD50 | CLINICALLY ACTIONABLE, KINASE, DNA REPAIR | IRINOTECAN | IRINOTECAN | 24934408 |
| Page: 1 |

Copyright 2023-Present -The University of Texas Health Science Center at Houston |