
|
|||||
|
 | |
| |
| |
| |
| |
| |
|
Gene: PTTG1IP |
Gene summary for PTTG1IP |
| Gene information | Species | Human | Gene symbol | PTTG1IP | Gene ID | 754 |
| Gene name | PTTG1 interacting protein | |
| Gene Alias | C21orf1 | |
| Cytomap | 21q22.3 | |
| Gene Type | protein-coding | GO ID | GO:0006464 | UniProtAcc | B4DPZ0 |
Top |
Malignant transformation analysis |
| Identification of the aberrant gene expression in precancerous and cancerous lesions by comparing the gene expression of stem-like cells in diseased tissues with normal stem cells |
| Entrez ID | Symbol | Replicates | Species | Organ | Tissue | Adj P-value | Log2FC | Malignancy |
| 754 | PTTG1IP | HTA11_3410_2000001011 | Human | Colorectum | AD | 6.70e-11 | 3.40e-01 | 0.0155 |
| 754 | PTTG1IP | HTA11_2487_2000001011 | Human | Colorectum | SER | 7.71e-17 | 1.11e+00 | -0.1808 |
| 754 | PTTG1IP | HTA11_1938_2000001011 | Human | Colorectum | AD | 2.07e-12 | 8.12e-01 | -0.0811 |
| 754 | PTTG1IP | HTA11_78_2000001011 | Human | Colorectum | AD | 9.33e-07 | 5.33e-01 | -0.1088 |
| 754 | PTTG1IP | HTA11_347_2000001011 | Human | Colorectum | AD | 2.47e-42 | 1.18e+00 | -0.1954 |
| 754 | PTTG1IP | HTA11_411_2000001011 | Human | Colorectum | SER | 1.99e-10 | 2.12e+00 | -0.2602 |
| 754 | PTTG1IP | HTA11_2112_2000001011 | Human | Colorectum | SER | 2.06e-07 | 1.24e+00 | -0.2196 |
| 754 | PTTG1IP | HTA11_83_2000001011 | Human | Colorectum | SER | 3.75e-08 | 7.48e-01 | -0.1526 |
| 754 | PTTG1IP | HTA11_696_2000001011 | Human | Colorectum | AD | 7.73e-21 | 6.78e-01 | -0.1464 |
| 754 | PTTG1IP | HTA11_866_2000001011 | Human | Colorectum | AD | 1.92e-05 | 3.82e-01 | -0.1001 |
| 754 | PTTG1IP | HTA11_1391_2000001011 | Human | Colorectum | AD | 1.02e-12 | 8.25e-01 | -0.059 |
| 754 | PTTG1IP | HTA11_2992_2000001011 | Human | Colorectum | SER | 1.11e-05 | 8.04e-01 | -0.1706 |
| 754 | PTTG1IP | HTA11_5212_2000001011 | Human | Colorectum | AD | 3.25e-17 | 1.55e+00 | -0.2061 |
| 754 | PTTG1IP | HTA11_546_2000001011 | Human | Colorectum | AD | 1.20e-03 | 4.63e-01 | -0.0842 |
| 754 | PTTG1IP | HTA11_7862_2000001011 | Human | Colorectum | AD | 2.15e-03 | 5.43e-01 | -0.0179 |
| 754 | PTTG1IP | HTA11_866_3004761011 | Human | Colorectum | AD | 2.14e-06 | 3.92e-01 | 0.096 |
| 754 | PTTG1IP | HTA11_4255_2000001011 | Human | Colorectum | SER | 2.95e-02 | 4.43e-01 | 0.0446 |
| 754 | PTTG1IP | HTA11_7663_2000001011 | Human | Colorectum | SER | 8.29e-03 | 3.94e-01 | 0.0131 |
| 754 | PTTG1IP | HTA11_7696_3000711011 | Human | Colorectum | AD | 2.52e-04 | 3.30e-01 | 0.0674 |
| 754 | PTTG1IP | HTA11_7469_2000001011 | Human | Colorectum | AD | 1.21e-05 | 1.14e+00 | -0.0124 |
| Page: 1 2 3 4 5 6 7 8 9 10 |
| Tissue | Expression Dynamics | Abbreviation |
| Colorectum (GSE201348) | 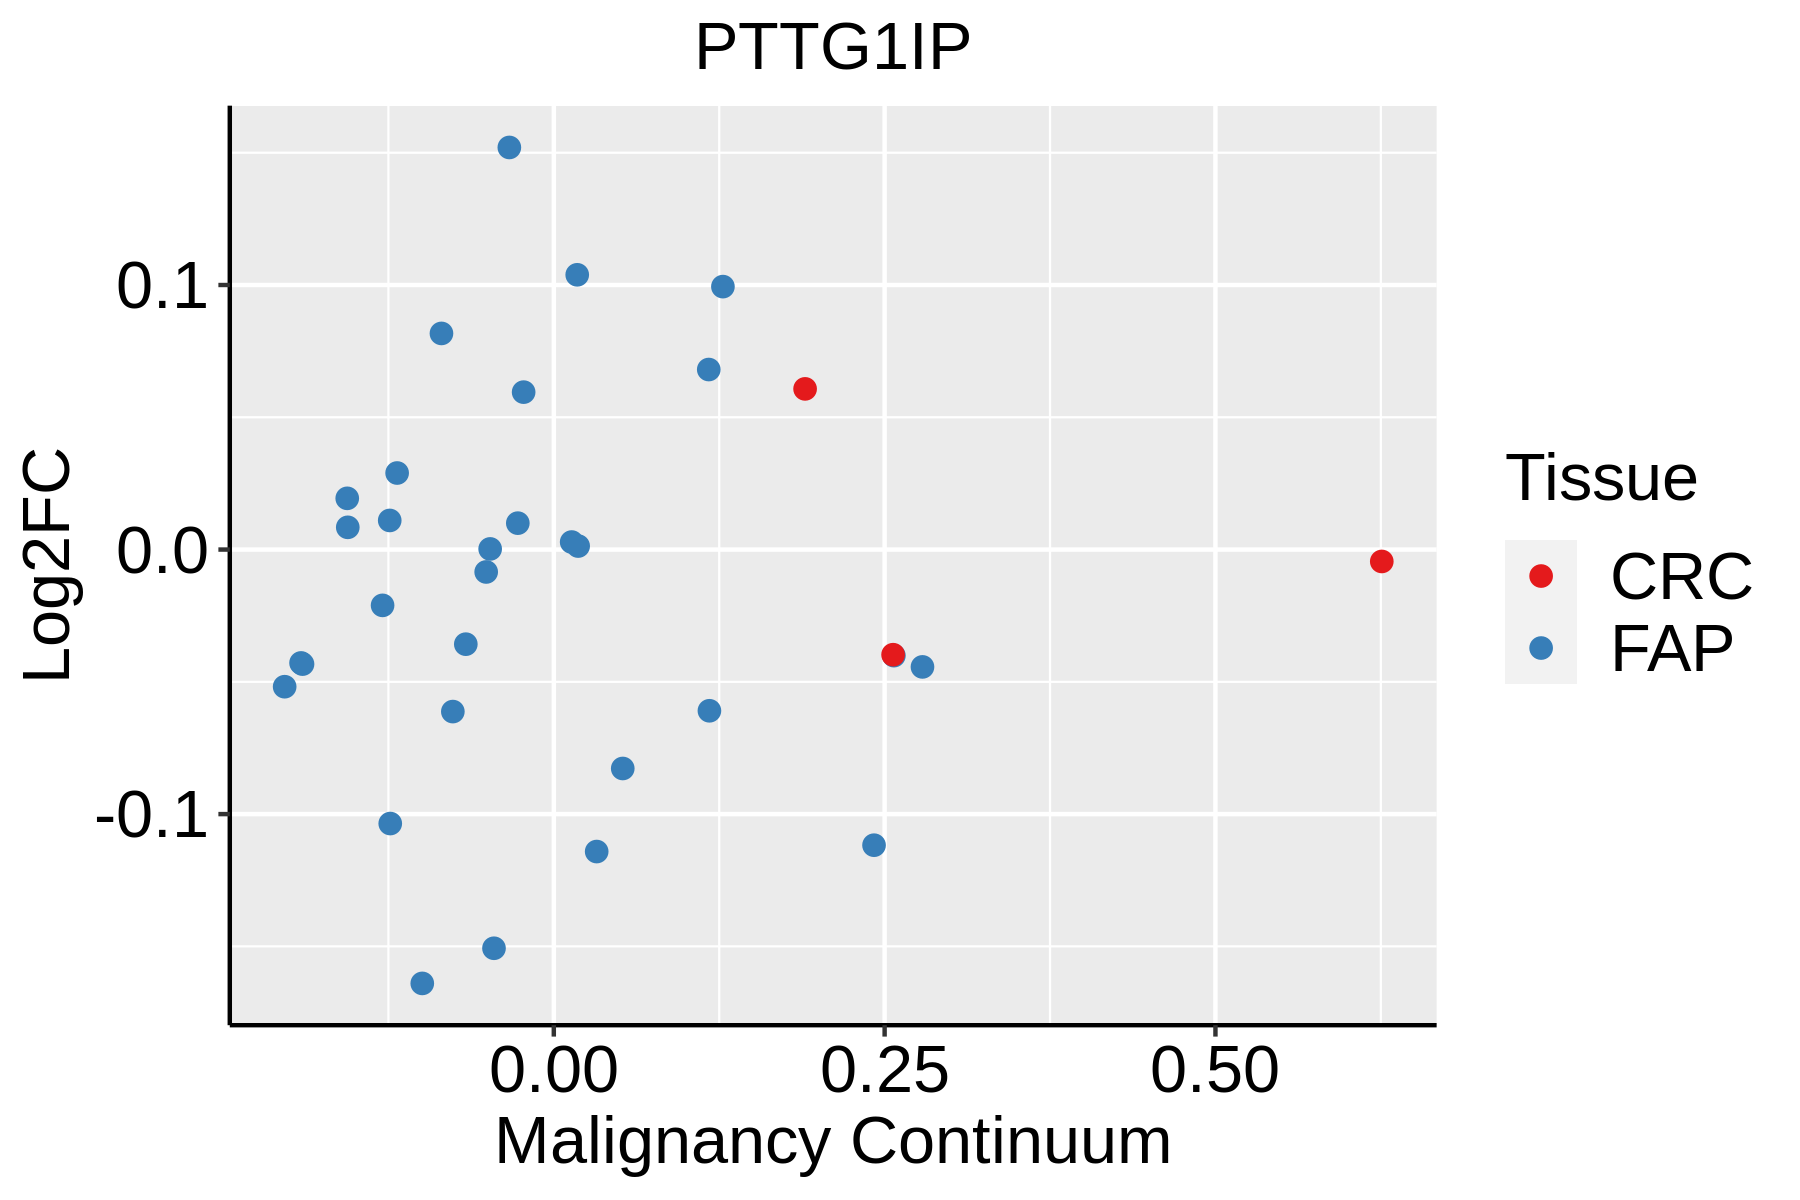 | FAP: Familial adenomatous polyposis |
| CRC: Colorectal cancer | ||
| Colorectum (HTA11) |  | AD: Adenomas |
| SER: Sessile serrated lesions | ||
| MSI-H: Microsatellite-high colorectal cancer | ||
| MSS: Microsatellite stable colorectal cancer | ||
| Endometrium | 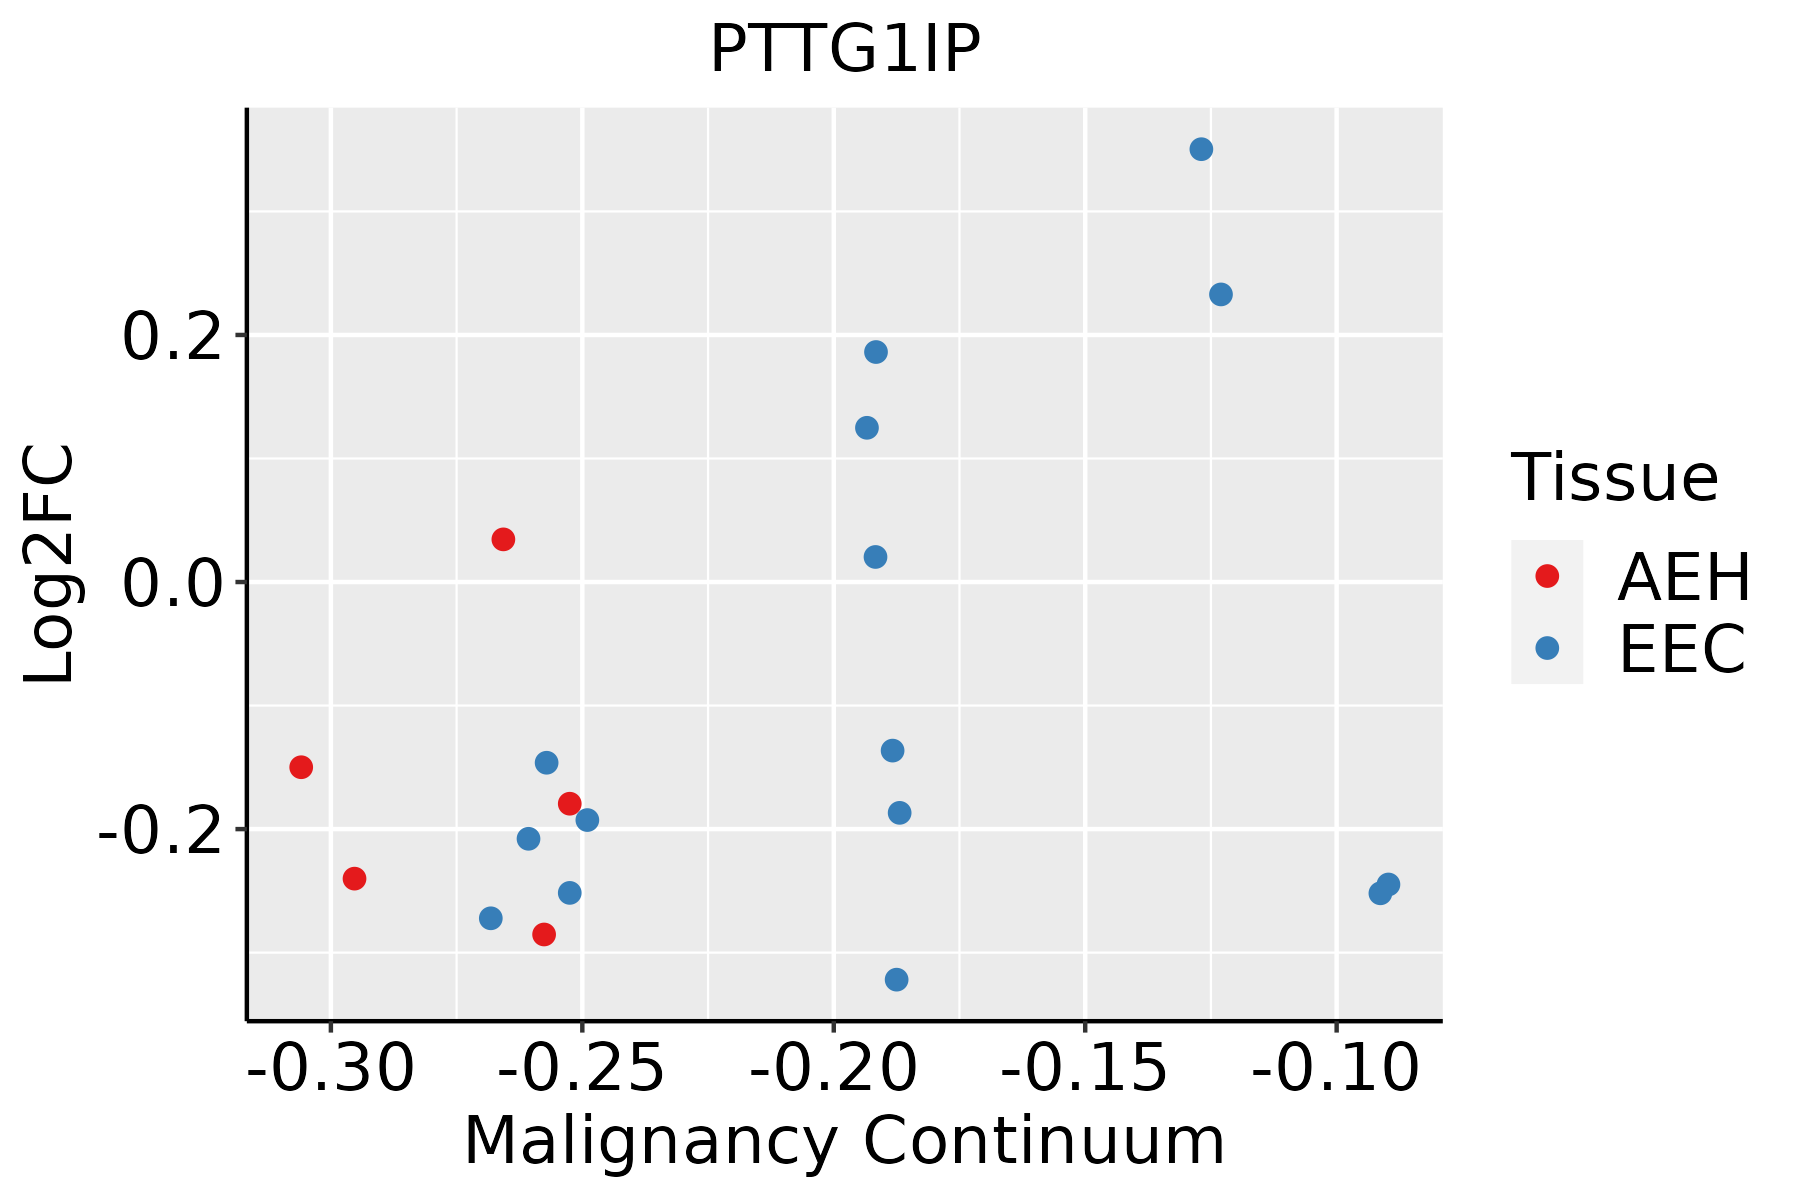 | AEH: Atypical endometrial hyperplasia |
| EEC: Endometrioid Cancer | ||
| Esophagus | 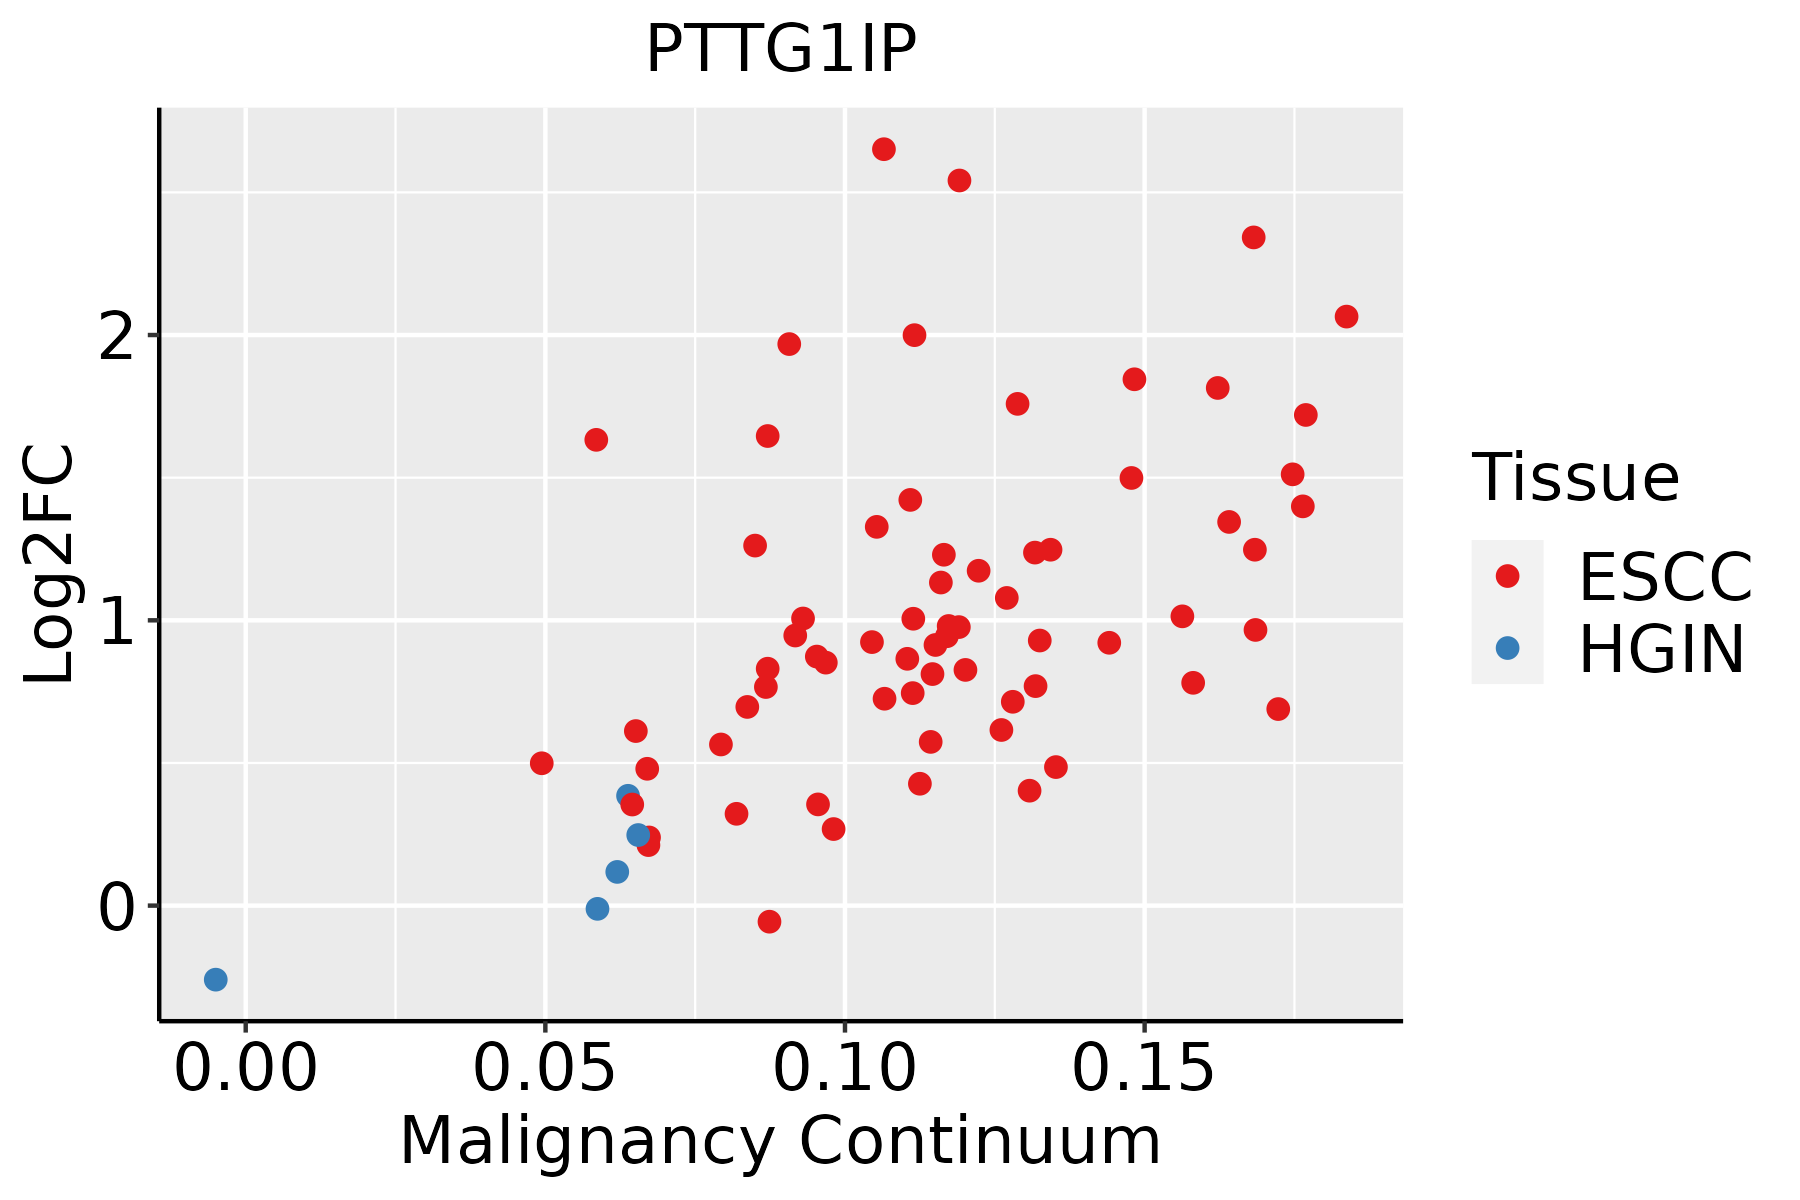 | ESCC: Esophageal squamous cell carcinoma |
| HGIN: High-grade intraepithelial neoplasias | ||
| LGIN: Low-grade intraepithelial neoplasias | ||
| Liver | 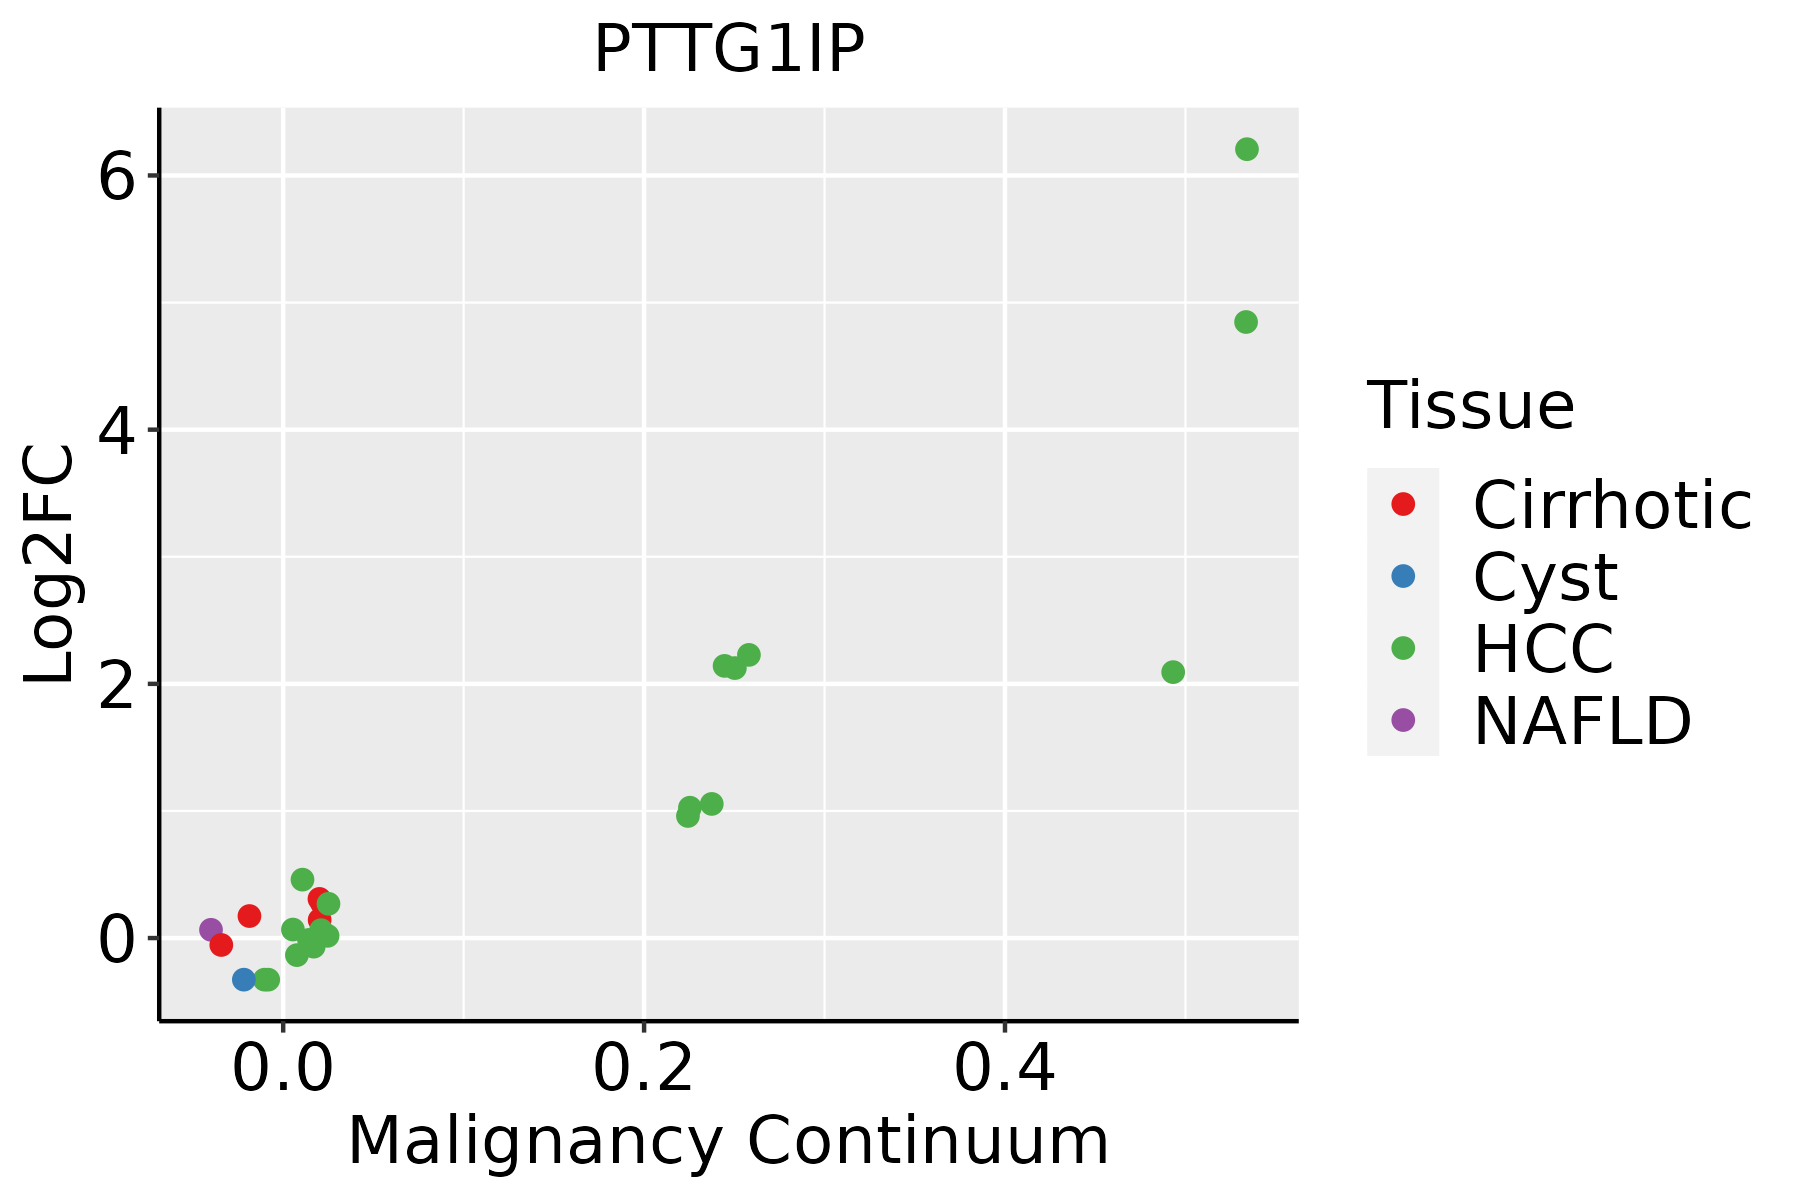 | HCC: Hepatocellular carcinoma |
| NAFLD: Non-alcoholic fatty liver disease | ||
| Oral Cavity | 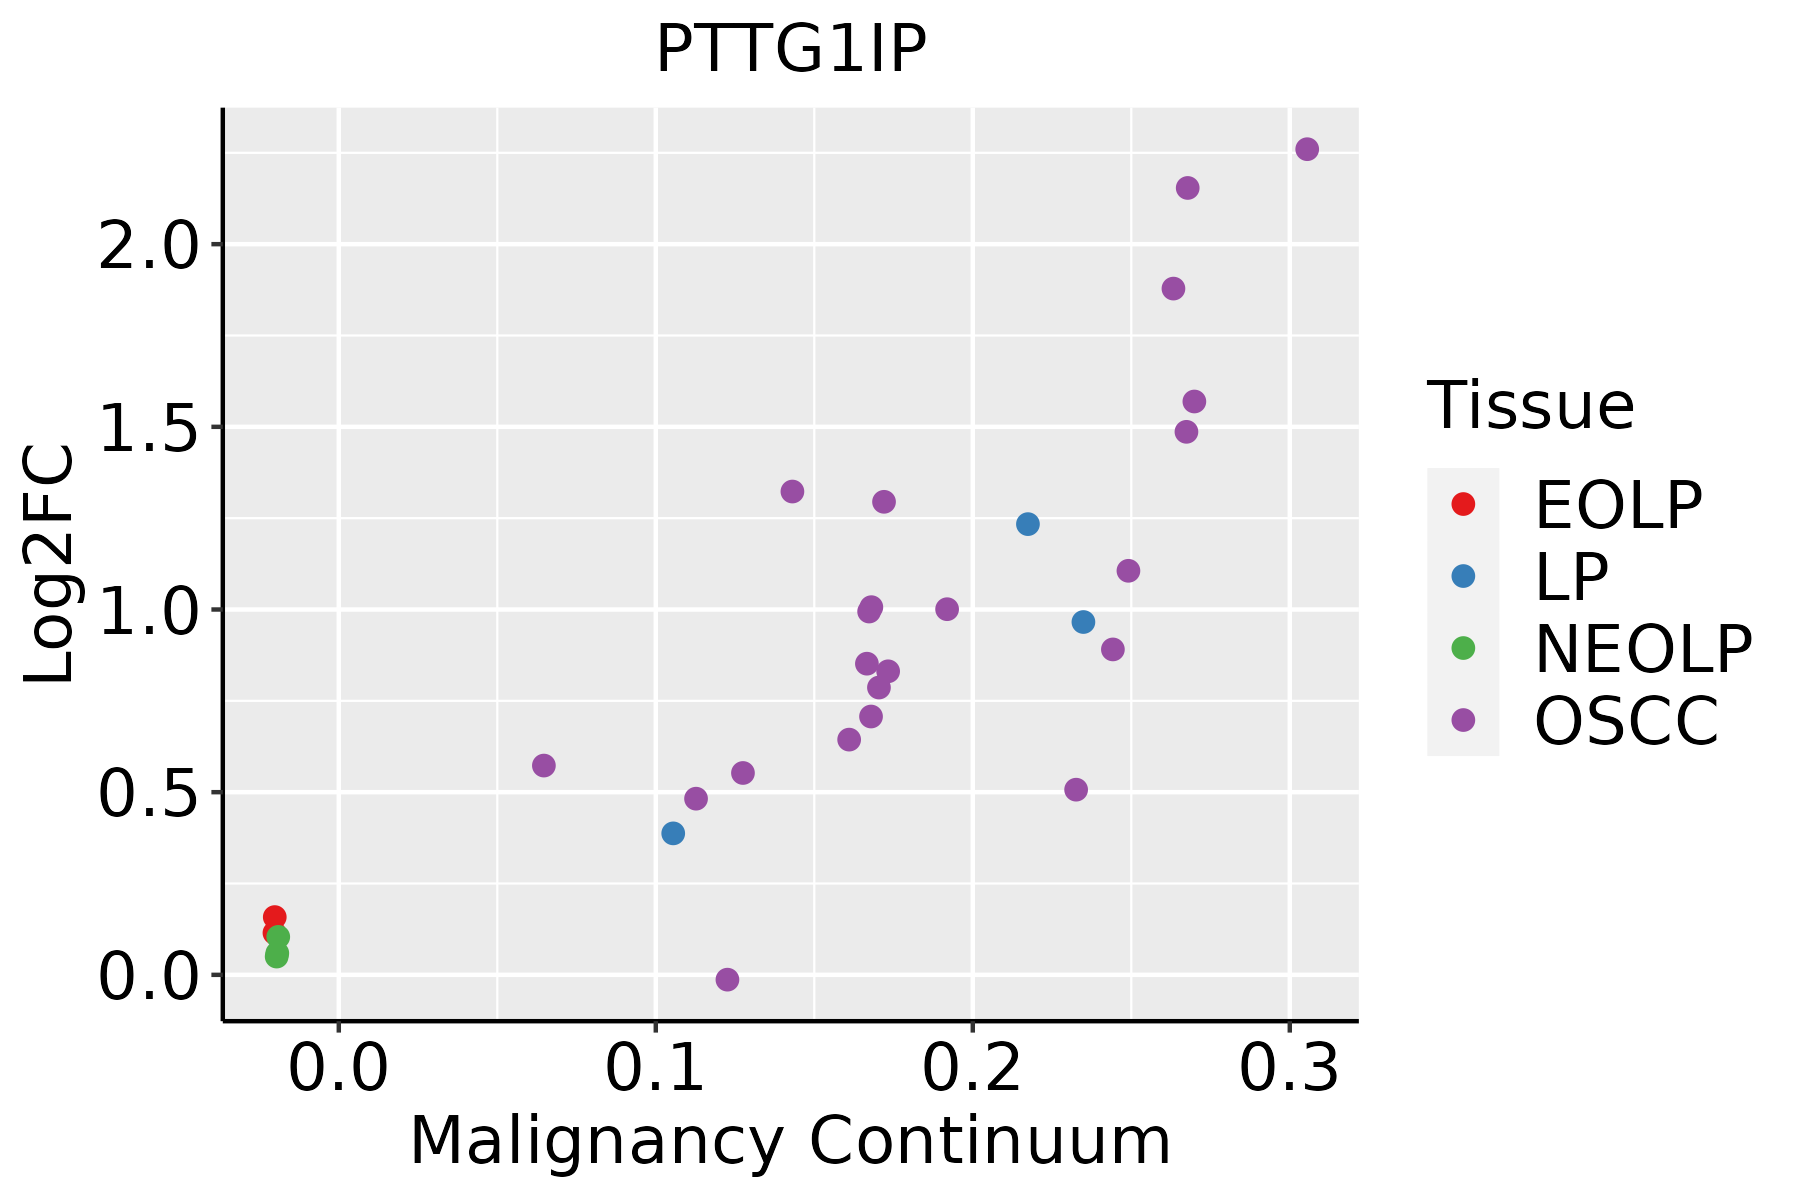 | EOLP: Erosive Oral lichen planus |
| LP: leukoplakia | ||
| NEOLP: Non-erosive oral lichen planus | ||
| OSCC: Oral squamous cell carcinoma | ||
| Prostate | 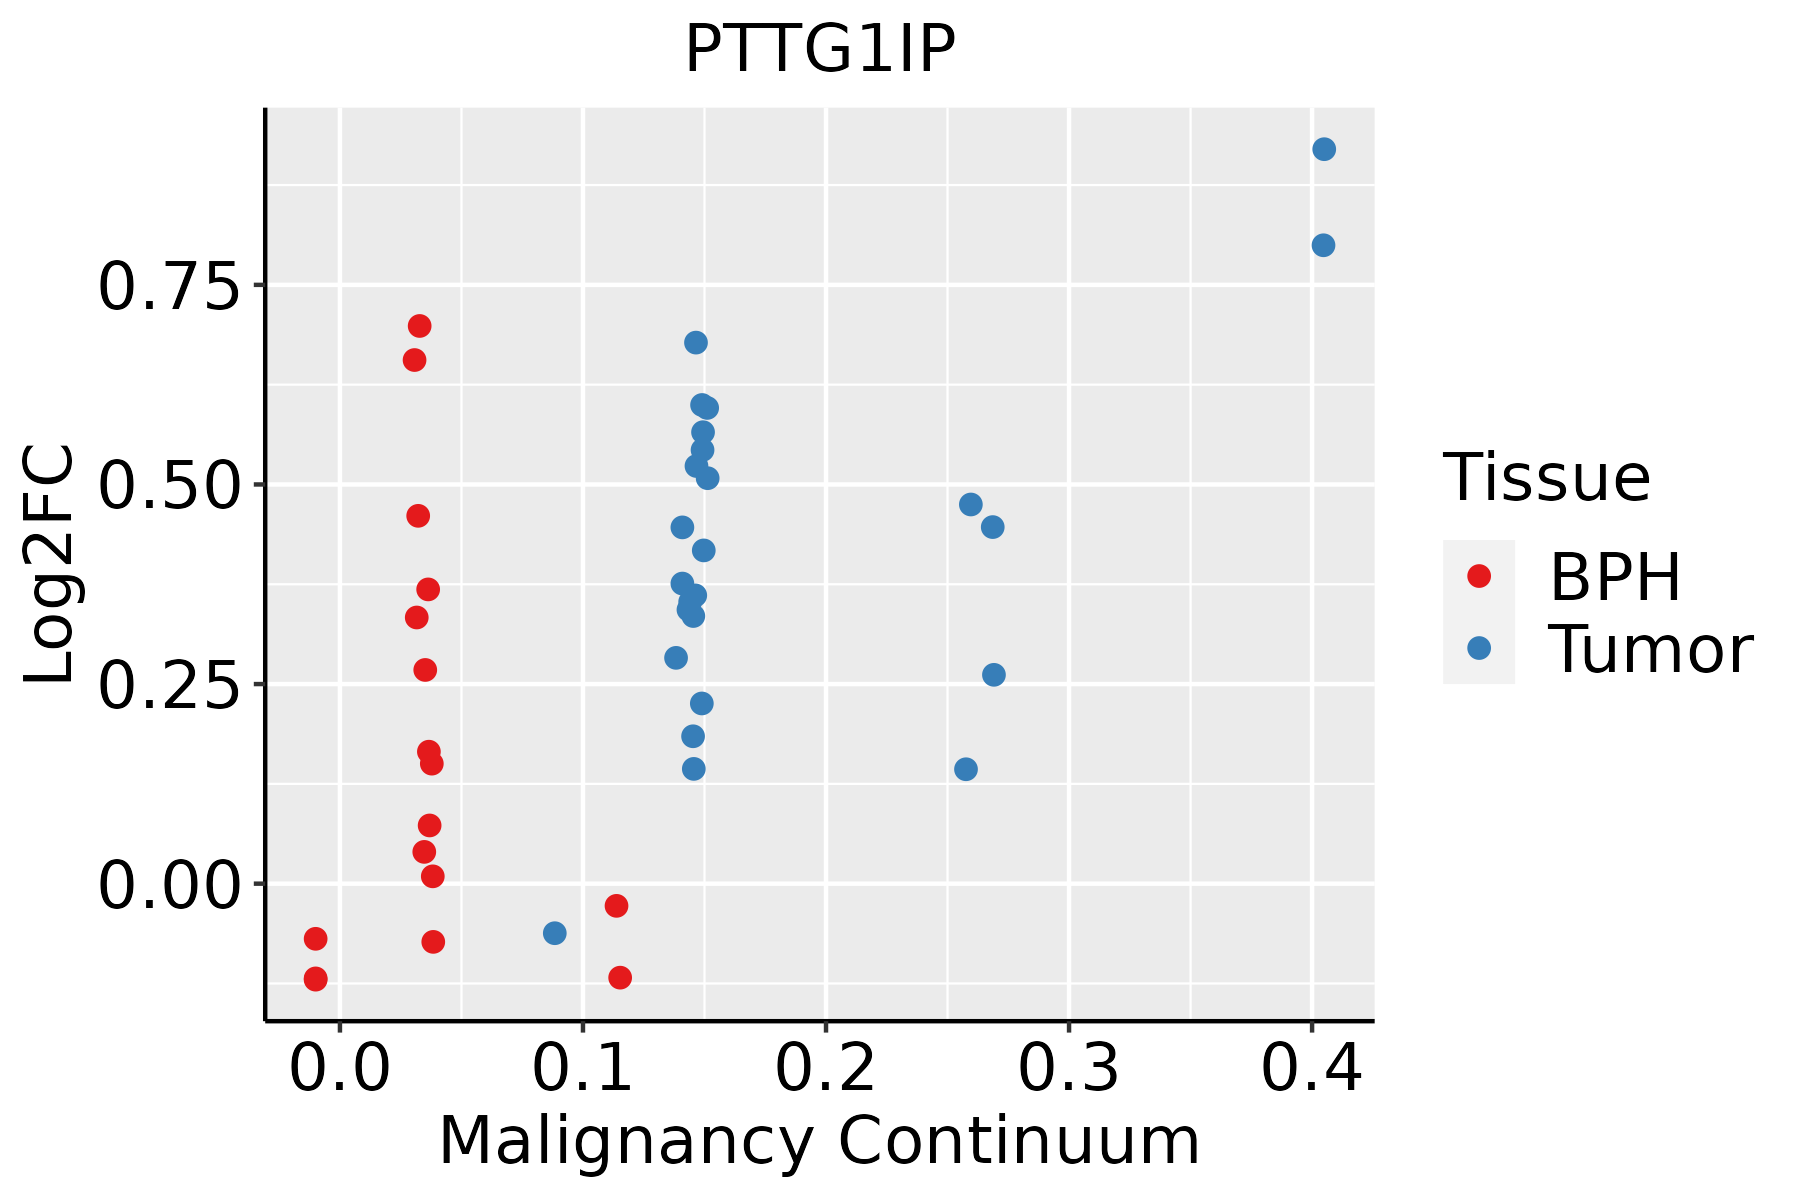 | BPH: Benign Prostatic Hyperplasia |
| Skin | 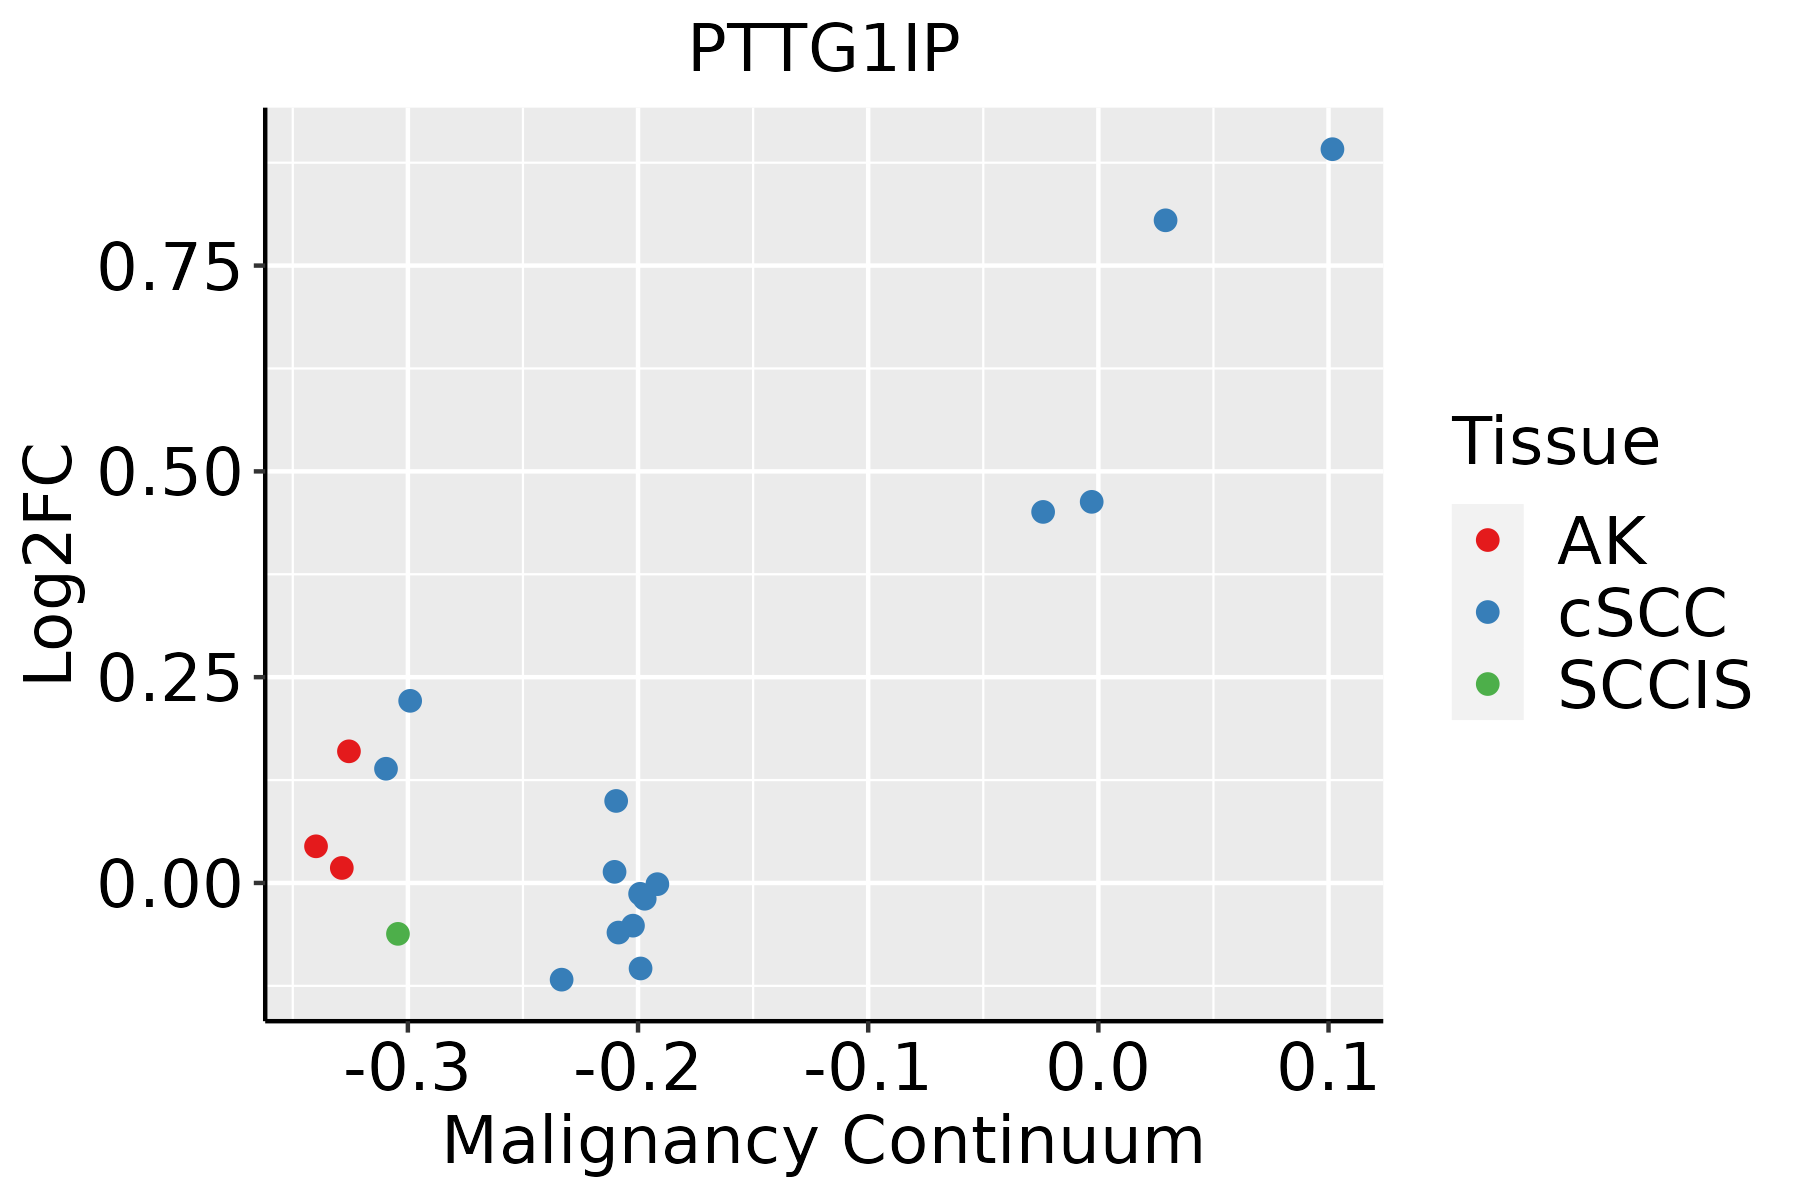 | AK: Actinic keratosis |
| cSCC: Cutaneous squamous cell carcinoma | ||
| SCCIS:squamous cell carcinoma in situ | ||
| Thyroid | 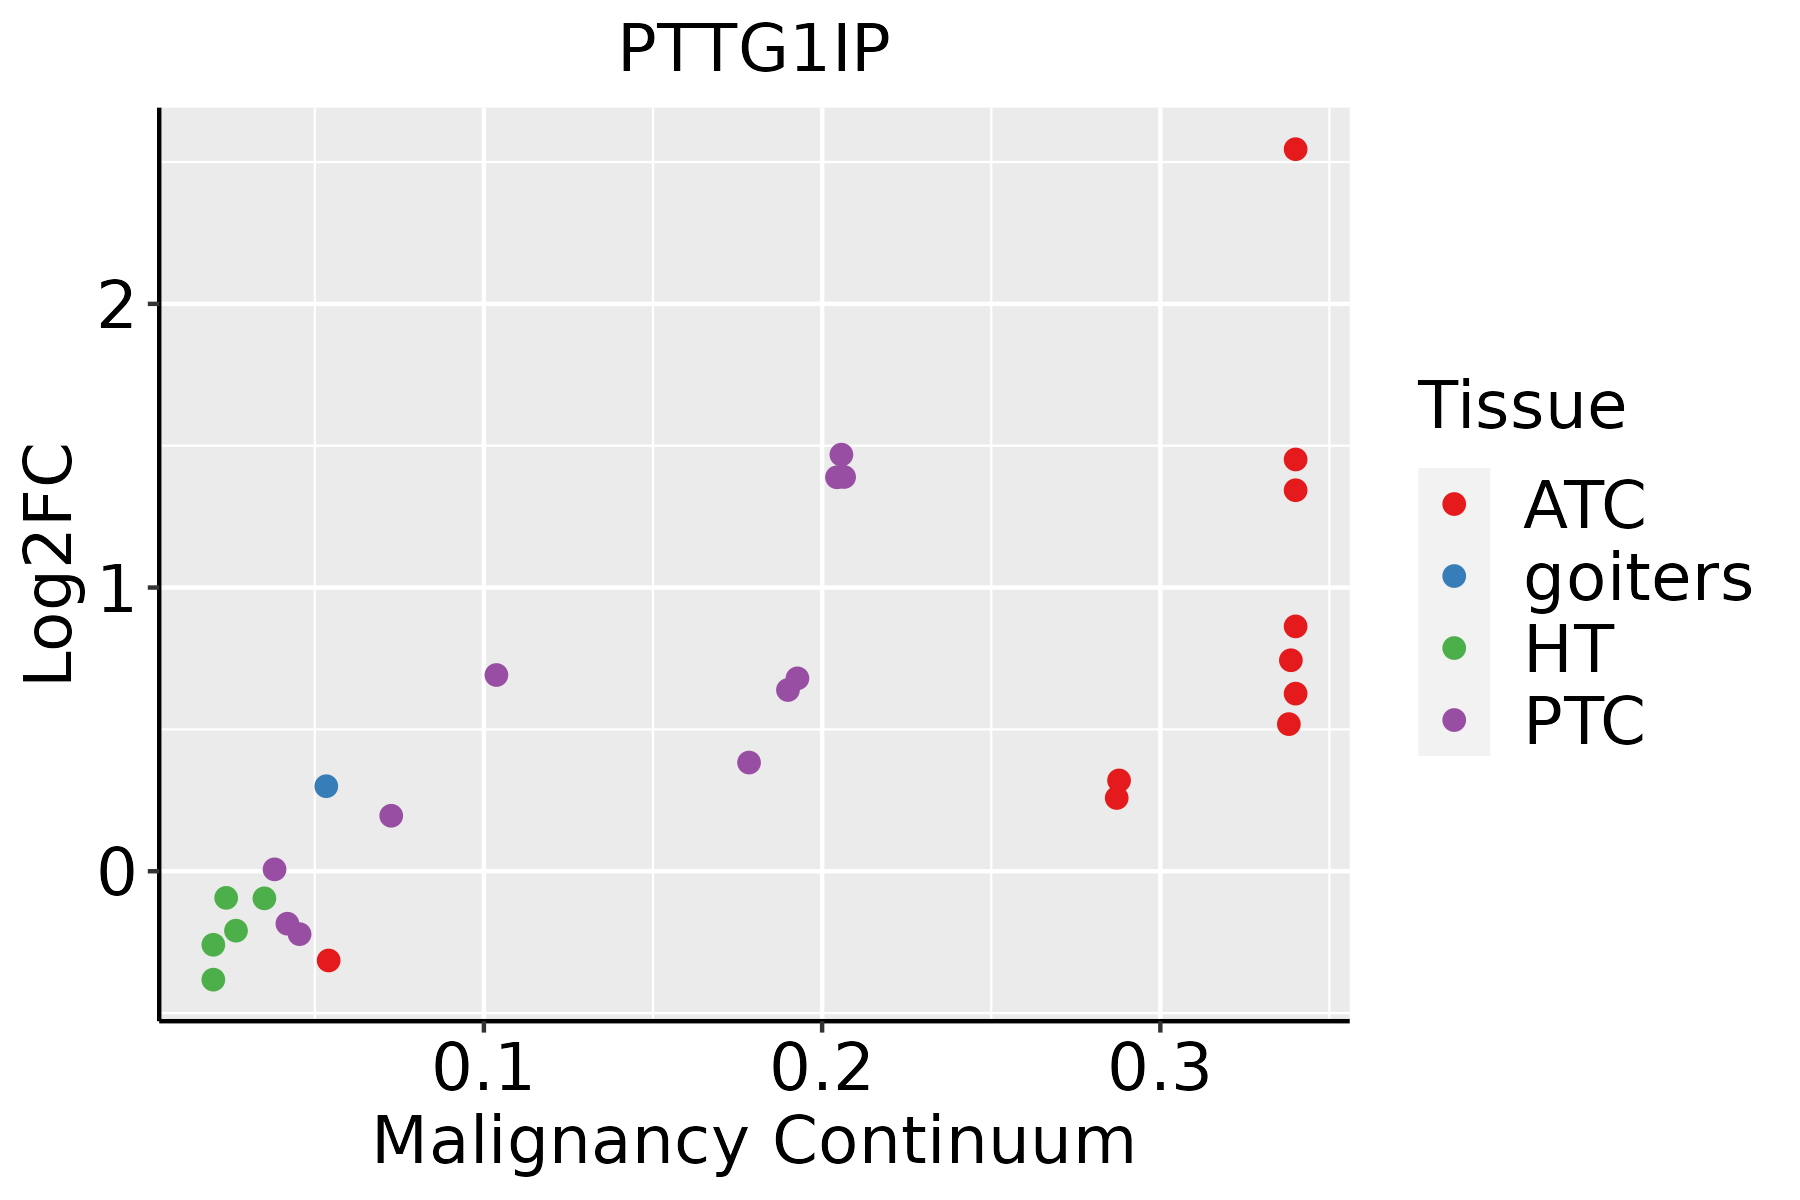 | ATC: Anaplastic thyroid cancer |
| HT: Hashimoto's thyroiditis | ||
| PTC: Papillary thyroid cancer |
| ∗log2FC in expression of this searched gene in stem-like cells from each diseased tissue sample relative to stem-like cells in normal samples in each tissue plotted against the malignancy continuum. Samples are colored based on if they are from different disease stage. |
Top |
Malignant transformation related pathway analysis |
| Find out the enriched GO biological processes and KEGG pathways involved in transition from healthy to precancer to cancer |
| Tissue | Disease Stage | Enriched GO biological Processes |
| Colorectum | AD |  |
| Colorectum | SER |  |
| Colorectum | MSS |  |
| Colorectum | MSI-H |  |
| Colorectum | FAP |  |
| ∗Top 15 enriched GO BP terms are showed in the bar plot of each disease state in each tissue. Each row represents a significant GO biological process which is colored according to the -log10(p.adjust). |
| Page: 1 2 3 4 5 6 7 8 9 |
| GO ID | Tissue | Disease Stage | Description | Gene Ratio | Bg Ratio | pvalue | p.adjust | Count |
| GO:1903320111 | Esophagus | ESCC | regulation of protein modification by small protein conjugation or removal | 181/8552 | 242/18723 | 1.80e-20 | 2.60e-18 | 181 |
| GO:1903362111 | Esophagus | ESCC | regulation of cellular protein catabolic process | 188/8552 | 255/18723 | 5.12e-20 | 6.62e-18 | 188 |
| GO:2001242111 | Esophagus | ESCC | regulation of intrinsic apoptotic signaling pathway | 128/8552 | 164/18723 | 1.75e-17 | 1.50e-15 | 128 |
| GO:0045732111 | Esophagus | ESCC | positive regulation of protein catabolic process | 167/8552 | 231/18723 | 1.47e-16 | 1.14e-14 | 167 |
| GO:0031396111 | Esophagus | ESCC | regulation of protein ubiquitination | 154/8552 | 210/18723 | 2.70e-16 | 2.04e-14 | 154 |
| GO:2001234111 | Esophagus | ESCC | negative regulation of apoptotic signaling pathway | 161/8552 | 224/18723 | 1.24e-15 | 8.09e-14 | 161 |
| GO:001703818 | Esophagus | ESCC | protein import | 149/8552 | 206/18723 | 5.90e-15 | 3.31e-13 | 149 |
| GO:1903364111 | Esophagus | ESCC | positive regulation of cellular protein catabolic process | 117/8552 | 155/18723 | 3.25e-14 | 1.66e-12 | 117 |
| GO:0072331111 | Esophagus | ESCC | signal transduction by p53 class mediator | 121/8552 | 163/18723 | 9.61e-14 | 4.69e-12 | 121 |
| GO:2001243111 | Esophagus | ESCC | negative regulation of intrinsic apoptotic signaling pathway | 78/8552 | 98/18723 | 5.50e-12 | 2.10e-10 | 78 |
| GO:190332216 | Esophagus | ESCC | positive regulation of protein modification by small protein conjugation or removal | 99/8552 | 138/18723 | 4.39e-10 | 1.16e-08 | 99 |
| GO:005117014 | Esophagus | ESCC | import into nucleus | 111/8552 | 159/18723 | 5.69e-10 | 1.44e-08 | 111 |
| GO:2001020110 | Esophagus | ESCC | regulation of response to DNA damage stimulus | 145/8552 | 219/18723 | 5.97e-10 | 1.50e-08 | 145 |
| GO:000660613 | Esophagus | ESCC | protein import into nucleus | 108/8552 | 155/18723 | 1.16e-09 | 2.77e-08 | 108 |
| GO:004277014 | Esophagus | ESCC | signal transduction in response to DNA damage | 117/8552 | 172/18723 | 2.38e-09 | 5.32e-08 | 117 |
| GO:1901796111 | Esophagus | ESCC | regulation of signal transduction by p53 class mediator | 70/8552 | 93/18723 | 5.69e-09 | 1.18e-07 | 70 |
| GO:0072332111 | Esophagus | ESCC | intrinsic apoptotic signaling pathway by p53 class mediator | 59/8552 | 76/18723 | 1.22e-08 | 2.42e-07 | 59 |
| GO:003139816 | Esophagus | ESCC | positive regulation of protein ubiquitination | 82/8552 | 119/18723 | 2.41e-07 | 3.64e-06 | 82 |
| GO:0030330110 | Esophagus | ESCC | DNA damage response, signal transduction by p53 class mediator | 53/8552 | 72/18723 | 1.34e-06 | 1.63e-05 | 53 |
| GO:200102112 | Esophagus | ESCC | negative regulation of response to DNA damage stimulus | 54/8552 | 81/18723 | 1.09e-04 | 7.64e-04 | 54 |
| Page: 1 2 3 4 5 6 7 8 9 10 11 12 13 14 15 16 17 18 19 20 21 22 23 24 25 26 27 28 29 30 31 |
| Pathway ID | Tissue | Disease Stage | Description | Gene Ratio | Bg Ratio | pvalue | p.adjust | qvalue | Count |
| Page: 1 |
Top |
Cell-cell communication analysis |
| Identification of potential cell-cell interactions between two cell types and their ligand-receptor pairs for different disease states |
| Ligand | Receptor | LRpair | Pathway | Tissue | Disease Stage |
| Page: 1 |
Top |
Single-cell gene regulatory network inference analysis |
| Find out the significant the regulons (TFs) and the target genes of each regulon across cell types for different disease states |
| TF | Cell Type | Tissue | Disease Stage | Target Gene | RSS | Regulon Activity |
| ∗The dot plots of a searched regulon are shown for all cell subpopulations in each disease state of each tissue based on the regulon specific score inferred using pySCENIC and by calculating the average expression. |
| Page: 1 |
Top |
Somatic mutation of malignant transformation related genes |
| Annotation of somatic variants for genes involved in malignant transformation |
| Hugo Symbol | Variant Class | Variant Classification | dbSNP RS | HGVSc | HGVSp | HGVSp Short | SWISSPROT | BIOTYPE | SIFT | PolyPhen | Tumor Sample Barcode | Tissue | Histology | Sex | Age | Stage | Therapy Types | Drugs | Outcome |
| PTTG1IP | SNV | Missense_Mutation | novel | c.457N>A | p.Glu153Lys | p.E153K | P53801 | protein_coding | deleterious(0) | probably_damaging(0.997) | TCGA-A8-A0A7-01 | Breast | breast invasive carcinoma | Female | <65 | I/II | Unknown | Unknown | SD |
| PTTG1IP | SNV | Missense_Mutation | c.124N>G | p.Gln42Glu | p.Q42E | P53801 | protein_coding | tolerated(1) | benign(0.003) | TCGA-JW-A5VL-01 | Cervix | cervical & endocervical cancer | Female | <65 | I/II | Unknown | Unknown | SD | |
| PTTG1IP | SNV | Missense_Mutation | rs138357182 | c.308N>T | p.Ser103Leu | p.S103L | P53801 | protein_coding | deleterious(0) | probably_damaging(0.997) | TCGA-AA-3510-01 | Colorectum | colon adenocarcinoma | Male | >=65 | I/II | Unknown | Unknown | SD |
| PTTG1IP | SNV | Missense_Mutation | rs758698293 | c.151N>C | p.Cys51Arg | p.C51R | P53801 | protein_coding | deleterious(0) | benign(0.332) | TCGA-G4-6304-01 | Colorectum | colon adenocarcinoma | Female | >=65 | I/II | Chemotherapy | fluorouracil | PD |
| PTTG1IP | SNV | Missense_Mutation | rs374480622 | c.418N>T | p.Arg140Trp | p.R140W | P53801 | protein_coding | deleterious(0) | possibly_damaging(0.855) | TCGA-G4-6588-01 | Colorectum | colon adenocarcinoma | Female | <65 | I/II | Unknown | Unknown | SD |
| PTTG1IP | SNV | Missense_Mutation | c.259N>T | p.Arg87Cys | p.R87C | P53801 | protein_coding | deleterious(0) | probably_damaging(0.917) | TCGA-G4-6588-01 | Colorectum | colon adenocarcinoma | Female | <65 | I/II | Unknown | Unknown | SD | |
| PTTG1IP | SNV | Missense_Mutation | rs778141805 | c.449G>A | p.Arg150Gln | p.R150Q | P53801 | protein_coding | deleterious(0) | probably_damaging(0.997) | TCGA-AP-A1DK-01 | Endometrium | uterine corpus endometrioid carcinoma | Female | <65 | I/II | Unknown | Unknown | SD |
| PTTG1IP | SNV | Missense_Mutation | novel | c.466A>T | p.Thr156Ser | p.T156S | P53801 | protein_coding | tolerated(0.43) | benign(0.005) | TCGA-B5-A3FC-01 | Endometrium | uterine corpus endometrioid carcinoma | Female | <65 | I/II | Unknown | Unknown | SD |
| PTTG1IP | SNV | Missense_Mutation | novel | c.130A>G | p.Thr44Ala | p.T44A | P53801 | protein_coding | deleterious(0.01) | benign(0.005) | TCGA-EO-A22U-01 | Endometrium | uterine corpus endometrioid carcinoma | Female | >=65 | I/II | Unknown | Unknown | SD |
| PTTG1IP | SNV | Missense_Mutation | c.177N>C | p.Trp59Cys | p.W59C | P53801 | protein_coding | deleterious(0) | probably_damaging(0.999) | TCGA-69-7979-01 | Lung | lung adenocarcinoma | Female | >=65 | I/II | Unknown | Unknown | SD |
| Page: 1 2 |
Top |
Related drugs of malignant transformation related genes |
| Identification of chemicals and drugs interact with genes involved in malignant transfromation |
| (DGIdb 4.0) |
| Entrez ID | Symbol | Category | Interaction Types | Drug Claim Name | Drug Name | PMIDs |
| Page: 1 |

Copyright 2023-Present -The University of Texas Health Science Center at Houston |