| Tissue | Expression Dynamics | Abbreviation |
| Breast | 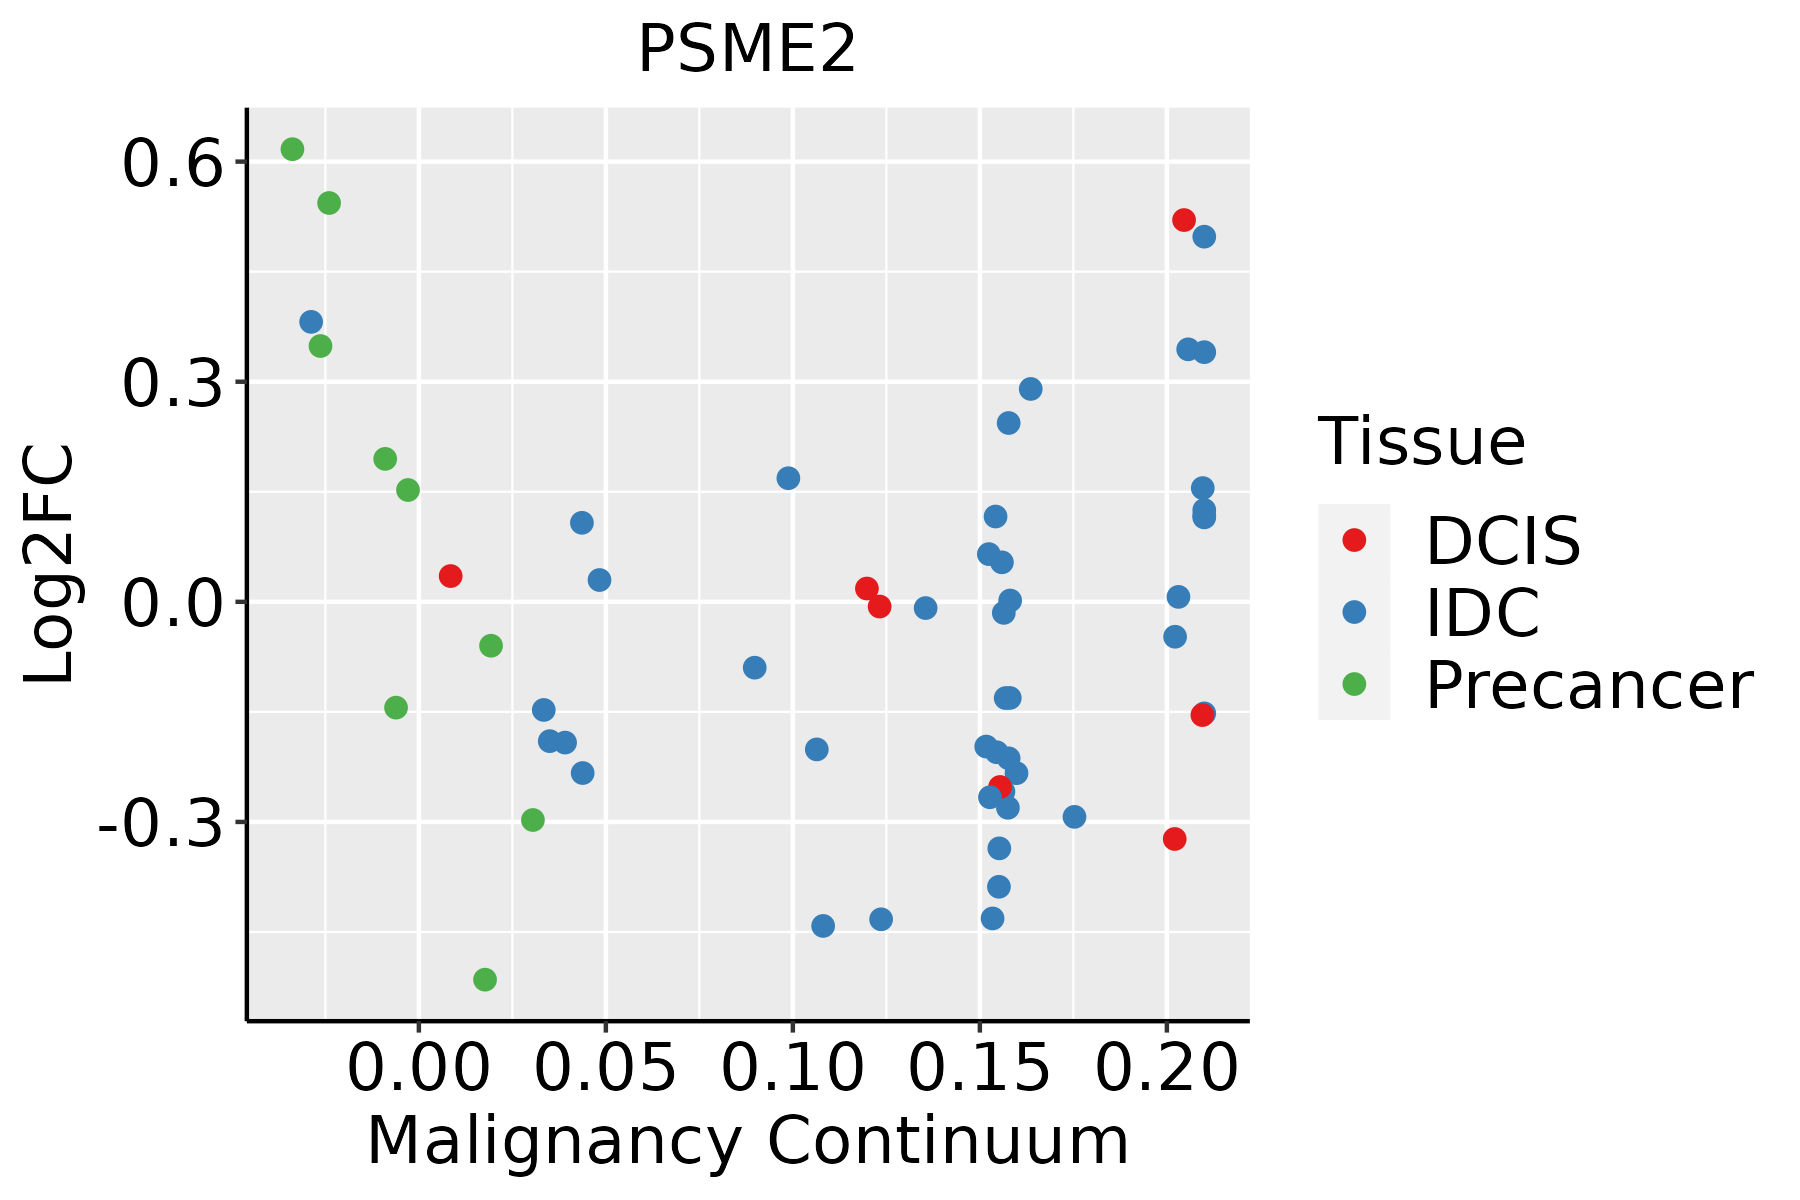 | IDC: Invasive ductal carcinoma |
| DCIS: Ductal carcinoma in situ |
| Precancer(BRCA1-mut): Precancerous lesion from BRCA1 mutation carriers |
| Cervix |  | CC: Cervix cancer |
| HSIL_HPV: HPV-infected high-grade squamous intraepithelial lesions |
| N_HPV: HPV-infected normal cervix |
| Colorectum (GSE201348) |  | FAP: Familial adenomatous polyposis |
| CRC: Colorectal cancer |
| Colorectum (HTA11) |  | AD: Adenomas |
| SER: Sessile serrated lesions |
| MSI-H: Microsatellite-high colorectal cancer |
| MSS: Microsatellite stable colorectal cancer |
| Endometrium | 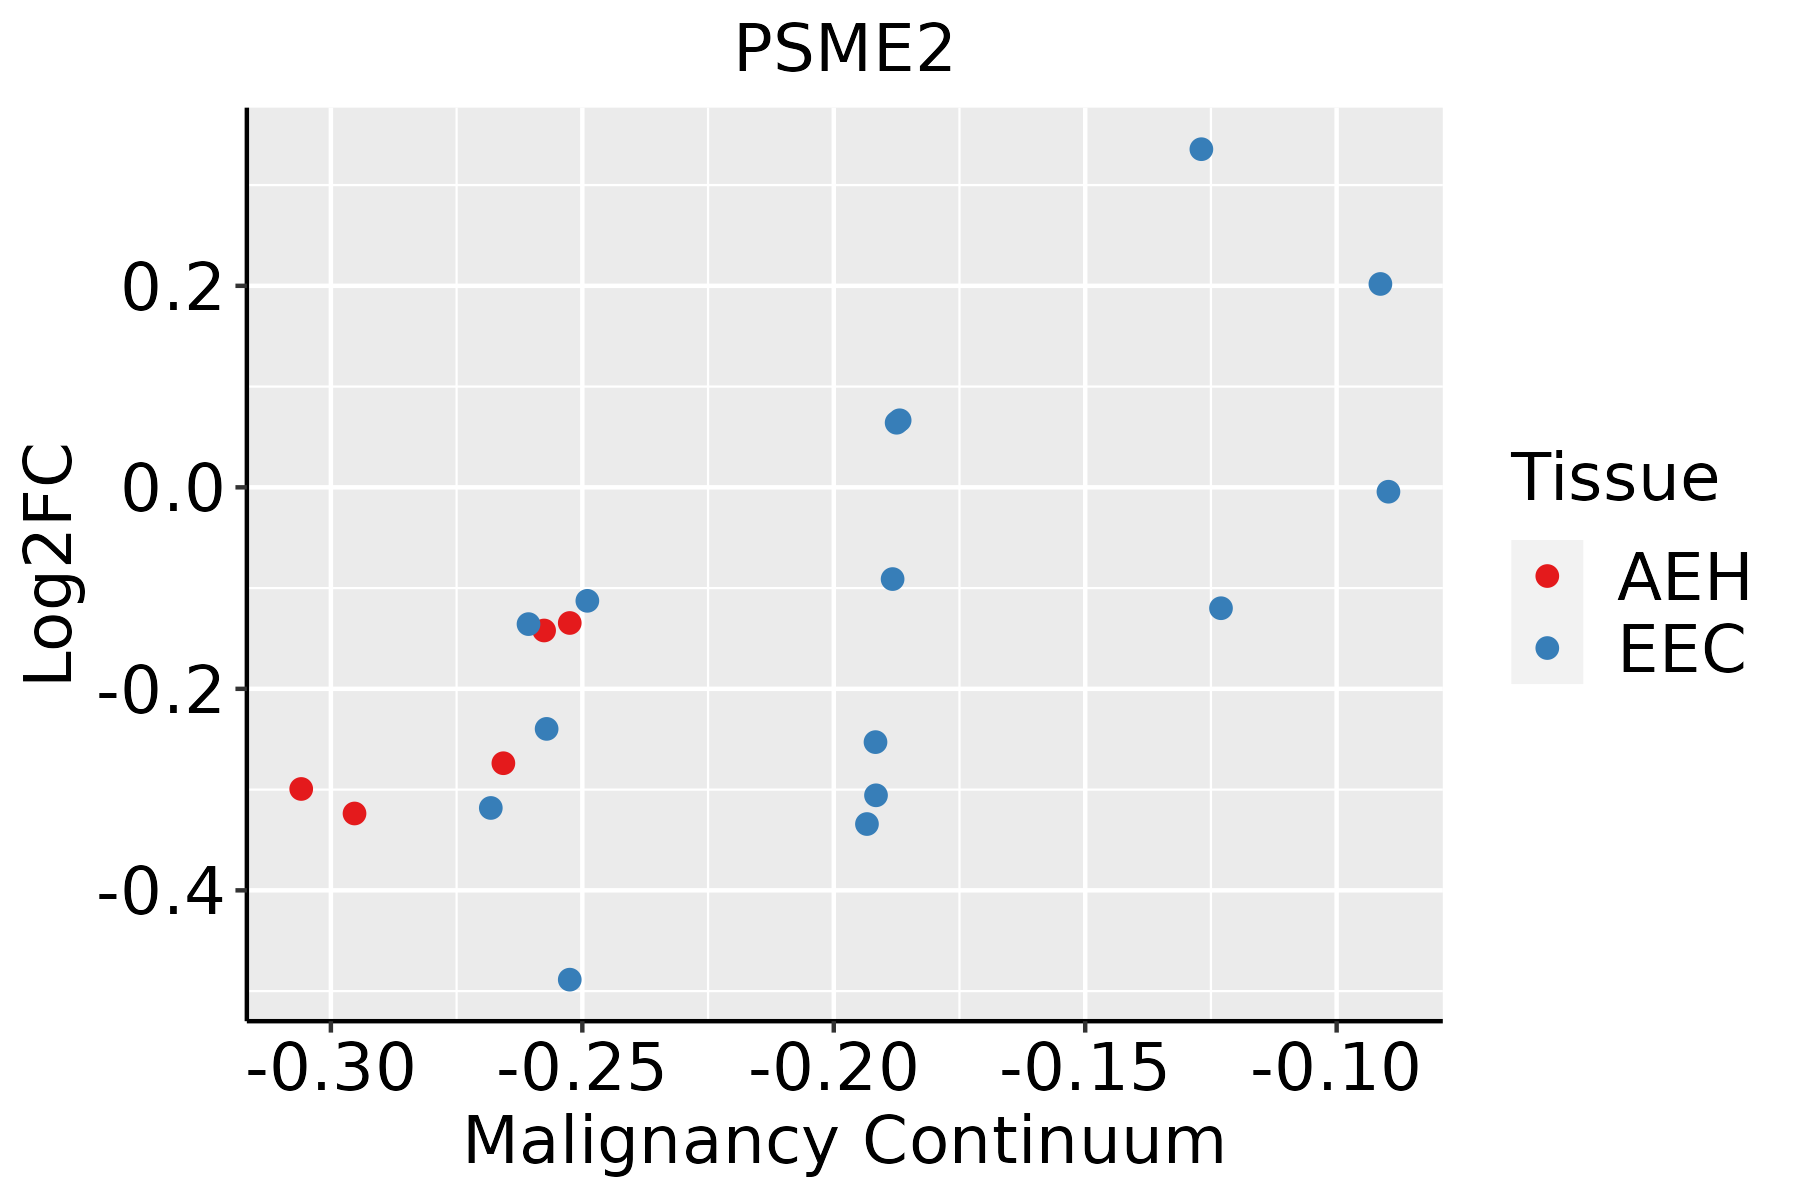 | AEH: Atypical endometrial hyperplasia |
| EEC: Endometrioid Cancer |
| Esophagus | 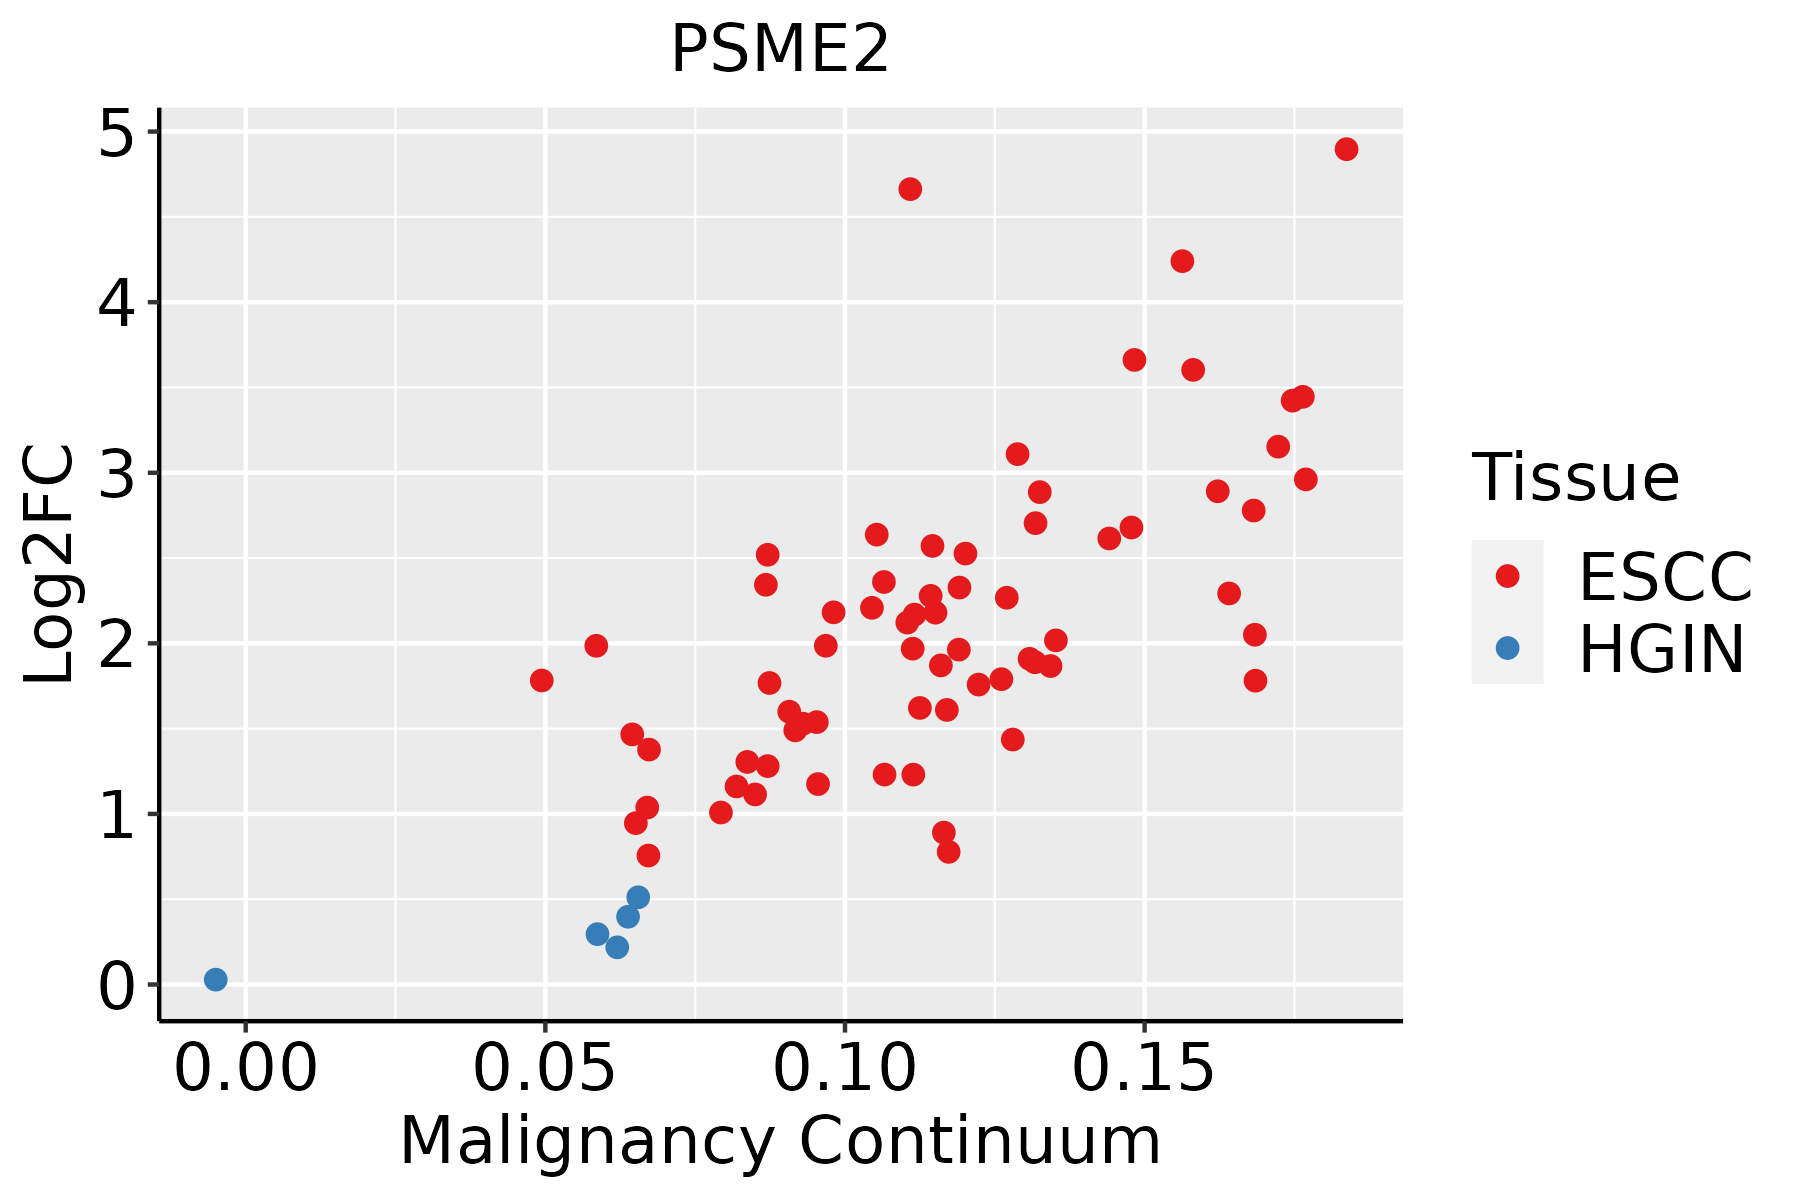 | ESCC: Esophageal squamous cell carcinoma |
| HGIN: High-grade intraepithelial neoplasias |
| LGIN: Low-grade intraepithelial neoplasias |
| GC |  | CAG: Chronic atrophic gastritis |
| CAG with IM: Chronic atrophic gastritis with intestinal metaplasia |
| CSG: Chronic superficial gastritis |
| GC: Gastric cancer |
| SIM: Severe intestinal metaplasia |
| WIM: Wild intestinal metaplasia |
| Liver |  | HCC: Hepatocellular carcinoma |
| NAFLD: Non-alcoholic fatty liver disease |
| Oral Cavity |  | EOLP: Erosive Oral lichen planus |
| LP: leukoplakia |
| NEOLP: Non-erosive oral lichen planus |
| OSCC: Oral squamous cell carcinoma |
| Prostate | 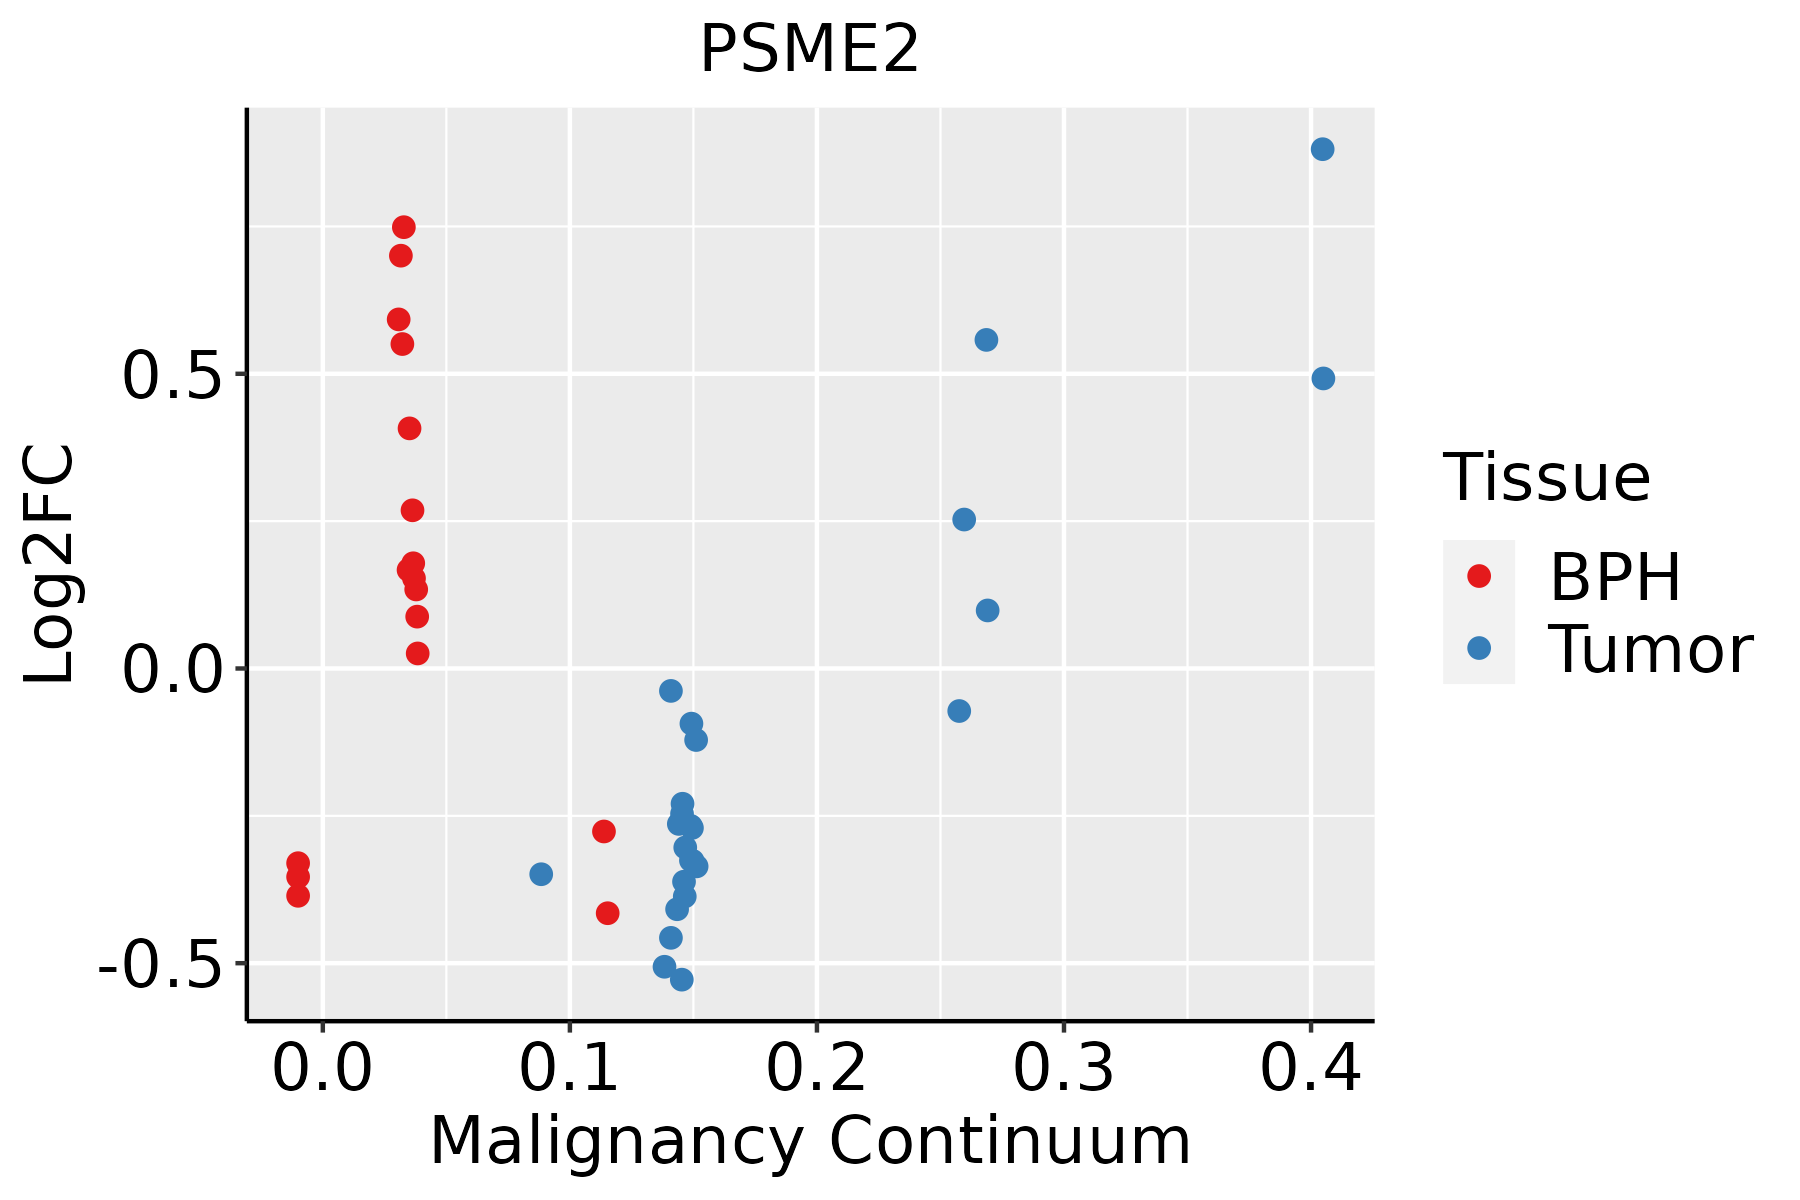 | BPH: Benign Prostatic Hyperplasia |
| Skin | 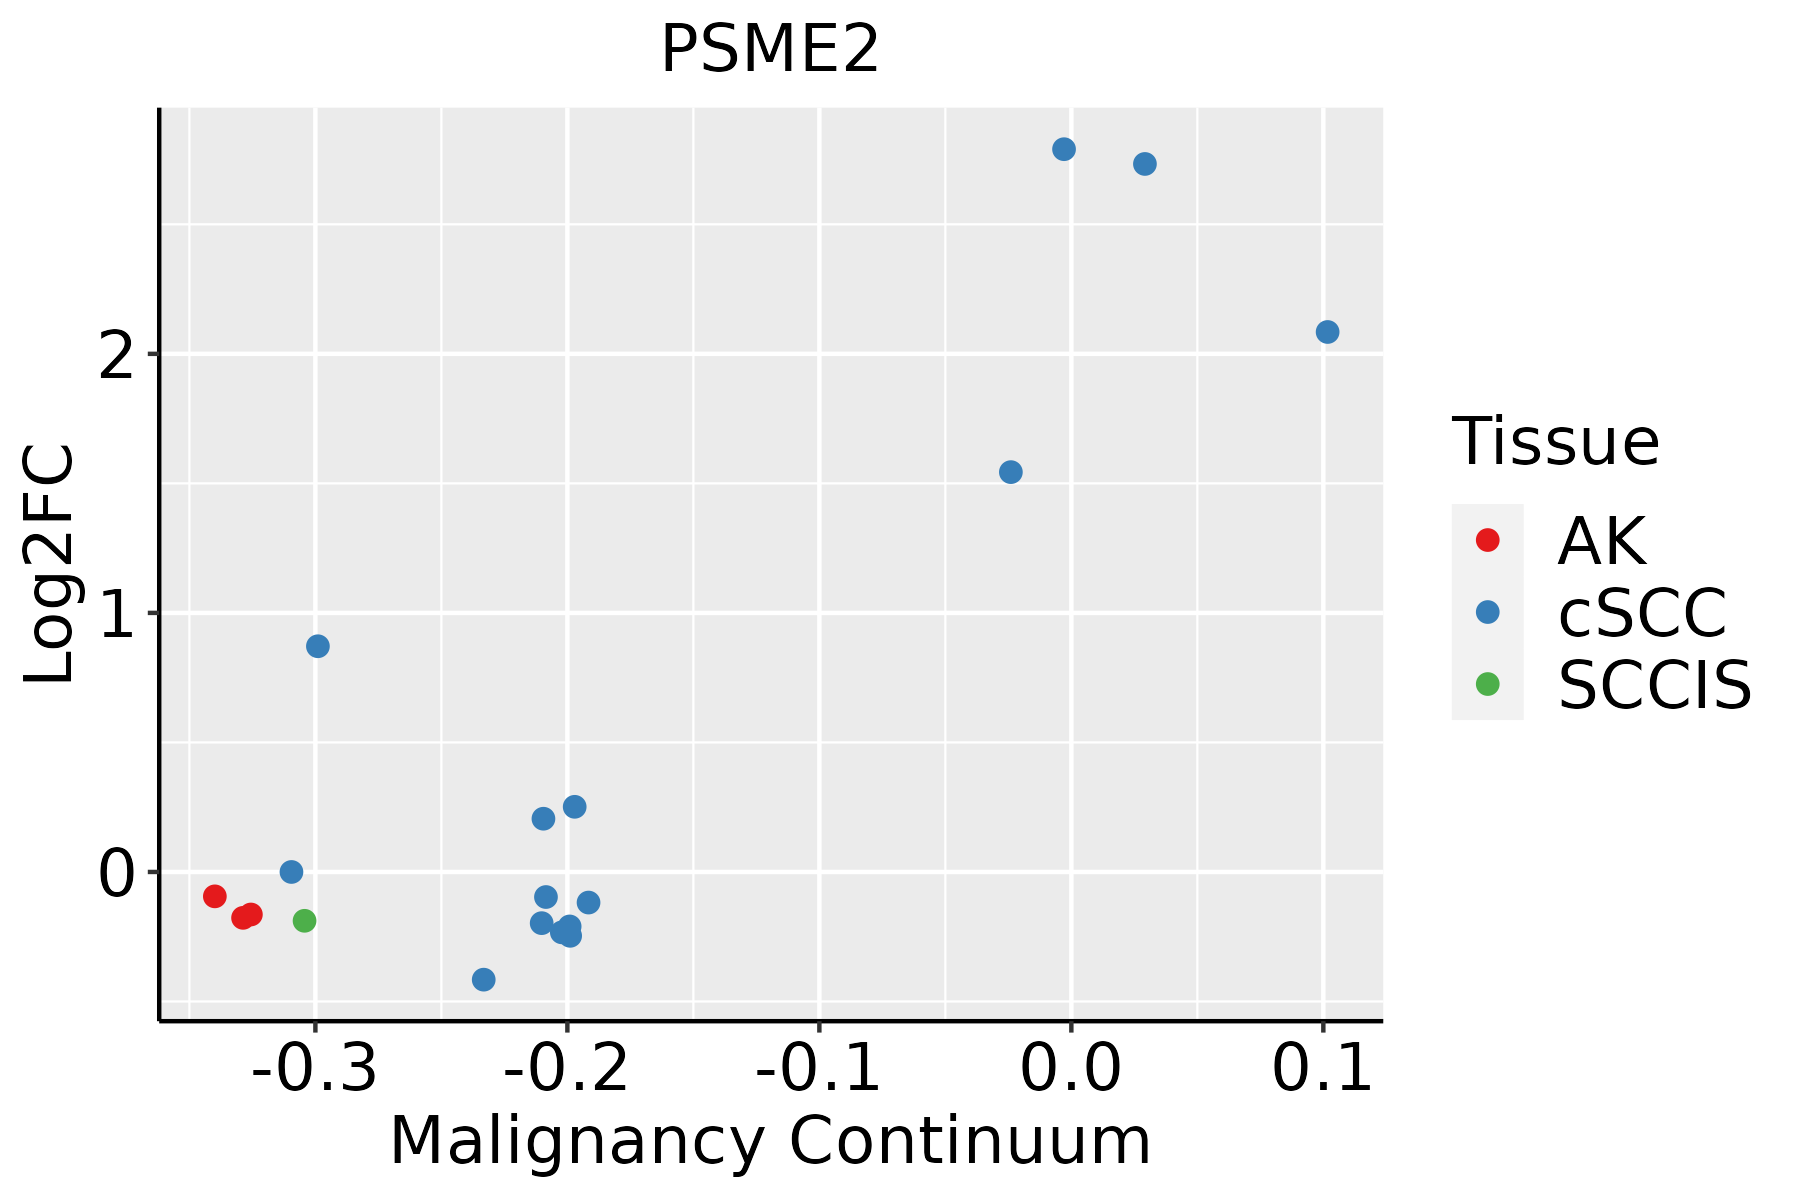 | AK: Actinic keratosis |
| cSCC: Cutaneous squamous cell carcinoma |
| SCCIS:squamous cell carcinoma in situ |
| Thyroid |  | ATC: Anaplastic thyroid cancer |
| HT: Hashimoto's thyroiditis |
| PTC: Papillary thyroid cancer |
| GO ID | Tissue | Disease Stage | Description | Gene Ratio | Bg Ratio | pvalue | p.adjust | Count |
| GO:00000826 | Oral cavity | OSCC | G1/S transition of mitotic cell cycle | 120/7305 | 214/18723 | 2.86e-07 | 4.40e-06 | 120 |
| GO:00448436 | Oral cavity | OSCC | cell cycle G1/S phase transition | 131/7305 | 241/18723 | 8.77e-07 | 1.20e-05 | 131 |
| GO:20000455 | Oral cavity | OSCC | regulation of G1/S transition of mitotic cell cycle | 74/7305 | 142/18723 | 1.01e-03 | 5.24e-03 | 74 |
| GO:19028064 | Oral cavity | OSCC | regulation of cell cycle G1/S phase transition | 84/7305 | 168/18723 | 2.38e-03 | 1.05e-02 | 84 |
| GO:0010498110 | Oral cavity | LP | proteasomal protein catabolic process | 224/4623 | 490/18723 | 9.57e-25 | 4.00e-22 | 224 |
| GO:0042176110 | Oral cavity | LP | regulation of protein catabolic process | 177/4623 | 391/18723 | 3.00e-19 | 5.87e-17 | 177 |
| GO:0045862110 | Oral cavity | LP | positive regulation of proteolysis | 165/4623 | 372/18723 | 5.40e-17 | 8.46e-15 | 165 |
| GO:1903362110 | Oral cavity | LP | regulation of cellular protein catabolic process | 119/4623 | 255/18723 | 1.52e-14 | 1.76e-12 | 119 |
| GO:1903050110 | Oral cavity | LP | regulation of proteolysis involved in cellular protein catabolic process | 101/4623 | 221/18723 | 7.00e-12 | 5.48e-10 | 101 |
| GO:0061136110 | Oral cavity | LP | regulation of proteasomal protein catabolic process | 89/4623 | 187/18723 | 8.05e-12 | 6.15e-10 | 89 |
| GO:0052547110 | Oral cavity | LP | regulation of peptidase activity | 177/4623 | 461/18723 | 3.01e-11 | 2.00e-09 | 177 |
| GO:0052548110 | Oral cavity | LP | regulation of endopeptidase activity | 164/4623 | 432/18723 | 4.33e-10 | 2.20e-08 | 164 |
| GO:0010952110 | Oral cavity | LP | positive regulation of peptidase activity | 88/4623 | 197/18723 | 6.52e-10 | 3.14e-08 | 88 |
| GO:0010950110 | Oral cavity | LP | positive regulation of endopeptidase activity | 79/4623 | 179/18723 | 9.34e-09 | 3.62e-07 | 79 |
| GO:000734614 | Oral cavity | LP | regulation of mitotic cell cycle | 163/4623 | 457/18723 | 7.64e-08 | 2.56e-06 | 163 |
| GO:004477215 | Oral cavity | LP | mitotic cell cycle phase transition | 150/4623 | 424/18723 | 4.38e-07 | 1.23e-05 | 150 |
| GO:000008213 | Oral cavity | LP | G1/S transition of mitotic cell cycle | 80/4623 | 214/18723 | 2.30e-05 | 3.74e-04 | 80 |
| GO:004484313 | Oral cavity | LP | cell cycle G1/S phase transition | 88/4623 | 241/18723 | 2.62e-05 | 4.21e-04 | 88 |
| GO:190199012 | Oral cavity | LP | regulation of mitotic cell cycle phase transition | 104/4623 | 299/18723 | 5.34e-05 | 7.41e-04 | 104 |
| GO:190198712 | Oral cavity | LP | regulation of cell cycle phase transition | 126/4623 | 390/18723 | 3.69e-04 | 3.64e-03 | 126 |
| Pathway ID | Tissue | Disease Stage | Description | Gene Ratio | Bg Ratio | pvalue | p.adjust | qvalue | Count |
| hsa0305010 | Breast | Precancer | Proteasome | 25/684 | 46/8465 | 4.35e-16 | 9.81e-15 | 7.52e-15 | 25 |
| hsa0461218 | Breast | Precancer | Antigen processing and presentation | 19/684 | 78/8465 | 9.61e-06 | 1.12e-04 | 8.62e-05 | 19 |
| hsa0305013 | Breast | Precancer | Proteasome | 25/684 | 46/8465 | 4.35e-16 | 9.81e-15 | 7.52e-15 | 25 |
| hsa0461219 | Breast | Precancer | Antigen processing and presentation | 19/684 | 78/8465 | 9.61e-06 | 1.12e-04 | 8.62e-05 | 19 |
| hsa0305023 | Breast | IDC | Proteasome | 26/867 | 46/8465 | 9.89e-15 | 2.47e-13 | 1.85e-13 | 26 |
| hsa0461223 | Breast | IDC | Antigen processing and presentation | 24/867 | 78/8465 | 4.61e-07 | 8.33e-06 | 6.23e-06 | 24 |
| hsa0305033 | Breast | IDC | Proteasome | 26/867 | 46/8465 | 9.89e-15 | 2.47e-13 | 1.85e-13 | 26 |
| hsa0461233 | Breast | IDC | Antigen processing and presentation | 24/867 | 78/8465 | 4.61e-07 | 8.33e-06 | 6.23e-06 | 24 |
| hsa0305042 | Breast | DCIS | Proteasome | 26/846 | 46/8465 | 5.46e-15 | 1.36e-13 | 9.99e-14 | 26 |
| hsa0461242 | Breast | DCIS | Antigen processing and presentation | 25/846 | 78/8465 | 6.75e-08 | 1.28e-06 | 9.45e-07 | 25 |
| hsa0305052 | Breast | DCIS | Proteasome | 26/846 | 46/8465 | 5.46e-15 | 1.36e-13 | 9.99e-14 | 26 |
| hsa0461252 | Breast | DCIS | Antigen processing and presentation | 25/846 | 78/8465 | 6.75e-08 | 1.28e-06 | 9.45e-07 | 25 |
| hsa0461220 | Cervix | CC | Antigen processing and presentation | 34/1267 | 78/8465 | 1.06e-09 | 2.14e-08 | 1.26e-08 | 34 |
| hsa0305014 | Cervix | CC | Proteasome | 16/1267 | 46/8465 | 6.69e-04 | 3.09e-03 | 1.83e-03 | 16 |
| hsa04612110 | Cervix | CC | Antigen processing and presentation | 34/1267 | 78/8465 | 1.06e-09 | 2.14e-08 | 1.26e-08 | 34 |
| hsa0305015 | Cervix | CC | Proteasome | 16/1267 | 46/8465 | 6.69e-04 | 3.09e-03 | 1.83e-03 | 16 |
| hsa0461243 | Cervix | N_HPV | Antigen processing and presentation | 20/349 | 78/8465 | 2.61e-11 | 1.42e-09 | 1.11e-09 | 20 |
| hsa0461253 | Cervix | N_HPV | Antigen processing and presentation | 20/349 | 78/8465 | 2.61e-11 | 1.42e-09 | 1.11e-09 | 20 |
| hsa03050 | Colorectum | AD | Proteasome | 29/2092 | 46/8465 | 3.87e-08 | 6.18e-07 | 3.94e-07 | 29 |
| hsa030501 | Colorectum | AD | Proteasome | 29/2092 | 46/8465 | 3.87e-08 | 6.18e-07 | 3.94e-07 | 29 |
| Hugo Symbol | Variant Class | Variant Classification | dbSNP RS | HGVSc | HGVSp | HGVSp Short | SWISSPROT | BIOTYPE | SIFT | PolyPhen | Tumor Sample Barcode | Tissue | Histology | Sex | Age | Stage | Therapy Types | Drugs | Outcome |
| PSME2 | SNV | Missense_Mutation | novel | c.512N>A | p.Arg171His | p.R171H | Q9UL46 | protein_coding | tolerated(0.06) | benign(0.36) | TCGA-AO-A0J3-01 | Breast | breast invasive carcinoma | Female | >=65 | I/II | Chemotherapy | cyclophosphamide | SD |
| PSME2 | insertion | Nonsense_Mutation | novel | c.98_99insTCGTGATTCTATCAGTTACCTAGCTGGTAGCCTTAAGTAAGT | p.Arg34_Phe35insAspSerIleSerTyrLeuAlaGlySerLeuLysTerValArg | p.R34_F35insDSISYLAGSLK*VR | Q9UL46 | protein_coding | | | TCGA-A2-A0ER-01 | Breast | breast invasive carcinoma | Female | <65 | I/II | Chemotherapy | cytoxan | SD |
| PSME2 | SNV | Missense_Mutation | novel | c.229G>A | p.Glu77Lys | p.E77K | Q9UL46 | protein_coding | tolerated(0.78) | benign(0.059) | TCGA-VS-A958-01 | Cervix | cervical & endocervical cancer | Female | <65 | I/II | Chemotherapy | cisplatin | CR |
| PSME2 | SNV | Missense_Mutation | rs150829665 | c.511C>T | p.Arg171Cys | p.R171C | Q9UL46 | protein_coding | deleterious(0) | possibly_damaging(0.673) | TCGA-A6-3809-01 | Colorectum | colon adenocarcinoma | Female | >=65 | I/II | Unknown | Unknown | SD |
| PSME2 | SNV | Missense_Mutation | | c.105C>A | p.Phe35Leu | p.F35L | Q9UL46 | protein_coding | deleterious(0.04) | possibly_damaging(0.577) | TCGA-AP-A056-01 | Endometrium | uterine corpus endometrioid carcinoma | Female | <65 | I/II | Unknown | Unknown | SD |
| PSME2 | SNV | Missense_Mutation | novel | c.631N>A | p.Ala211Thr | p.A211T | Q9UL46 | protein_coding | tolerated(0.18) | benign(0.001) | TCGA-AX-A06F-01 | Endometrium | uterine corpus endometrioid carcinoma | Female | <65 | III/IV | Chemotherapy | carboplatin | SD |
| PSME2 | SNV | Missense_Mutation | novel | c.358N>A | p.Leu120Met | p.L120M | Q9UL46 | protein_coding | tolerated(0.11) | probably_damaging(0.981) | TCGA-AX-A2HC-01 | Endometrium | uterine corpus endometrioid carcinoma | Female | <65 | III/IV | Chemotherapy | paclitaxel | PD |
| PSME2 | SNV | Missense_Mutation | rs1136581 | c.181N>T | p.Arg61Trp | p.R61W | Q9UL46 | protein_coding | deleterious(0) | probably_damaging(0.91) | TCGA-AX-A3G8-01 | Endometrium | uterine corpus endometrioid carcinoma | Female | >=65 | I/II | Unknown | Unknown | SD |
| PSME2 | SNV | Missense_Mutation | | c.101G>T | p.Arg34Ile | p.R34I | Q9UL46 | protein_coding | tolerated(0.11) | benign(0.029) | TCGA-B5-A0JY-01 | Endometrium | uterine corpus endometrioid carcinoma | Female | <65 | III/IV | Chemotherapy | doxorubicin | SD |
| PSME2 | SNV | Missense_Mutation | novel | c.557N>G | p.Asp186Gly | p.D186G | Q9UL46 | protein_coding | deleterious(0) | possibly_damaging(0.899) | TCGA-B5-A3FA-01 | Endometrium | uterine corpus endometrioid carcinoma | Female | >=65 | I/II | Unknown | Unknown | SD |


