
|
|||||
|
 | |
| |
| |
| |
| |
| |
|
Gene: PSMD1 |
Gene summary for PSMD1 |
| Gene information | Species | Human | Gene symbol | PSMD1 | Gene ID | 5707 |
| Gene name | proteasome 26S subunit, non-ATPase 1 | |
| Gene Alias | P112 | |
| Cytomap | 2q37.1 | |
| Gene Type | protein-coding | GO ID | GO:0006508 | UniProtAcc | Q99460 |
Top |
Malignant transformation analysis |
| Identification of the aberrant gene expression in precancerous and cancerous lesions by comparing the gene expression of stem-like cells in diseased tissues with normal stem cells |
| Entrez ID | Symbol | Replicates | Species | Organ | Tissue | Adj P-value | Log2FC | Malignancy |
| 5707 | PSMD1 | HTA11_1938_2000001011 | Human | Colorectum | AD | 5.08e-06 | 5.73e-01 | -0.0811 |
| 5707 | PSMD1 | HTA11_347_2000001011 | Human | Colorectum | AD | 1.31e-03 | 3.50e-01 | -0.1954 |
| 5707 | PSMD1 | A015-C-203 | Human | Colorectum | FAP | 3.78e-21 | -3.55e-01 | -0.1294 |
| 5707 | PSMD1 | A015-C-204 | Human | Colorectum | FAP | 4.17e-05 | -3.00e-01 | -0.0228 |
| 5707 | PSMD1 | A002-C-201 | Human | Colorectum | FAP | 6.29e-05 | -2.41e-01 | 0.0324 |
| 5707 | PSMD1 | A002-C-203 | Human | Colorectum | FAP | 1.42e-03 | -1.29e-01 | 0.2786 |
| 5707 | PSMD1 | A001-C-119 | Human | Colorectum | FAP | 2.73e-05 | -3.95e-01 | -0.1557 |
| 5707 | PSMD1 | A001-C-108 | Human | Colorectum | FAP | 2.34e-15 | -2.87e-01 | -0.0272 |
| 5707 | PSMD1 | A002-C-205 | Human | Colorectum | FAP | 7.58e-12 | -3.77e-01 | -0.1236 |
| 5707 | PSMD1 | A001-C-104 | Human | Colorectum | FAP | 3.97e-03 | -2.33e-01 | 0.0184 |
| 5707 | PSMD1 | A015-C-006 | Human | Colorectum | FAP | 1.43e-06 | -2.85e-01 | -0.0994 |
| 5707 | PSMD1 | A015-C-106 | Human | Colorectum | FAP | 6.35e-07 | -2.46e-01 | -0.0511 |
| 5707 | PSMD1 | A002-C-114 | Human | Colorectum | FAP | 1.20e-10 | -4.16e-01 | -0.1561 |
| 5707 | PSMD1 | A015-C-104 | Human | Colorectum | FAP | 7.00e-24 | -4.08e-01 | -0.1899 |
| 5707 | PSMD1 | A001-C-014 | Human | Colorectum | FAP | 1.34e-07 | -2.98e-01 | 0.0135 |
| 5707 | PSMD1 | A002-C-016 | Human | Colorectum | FAP | 2.07e-13 | -2.93e-01 | 0.0521 |
| 5707 | PSMD1 | A015-C-002 | Human | Colorectum | FAP | 1.82e-05 | -3.29e-01 | -0.0763 |
| 5707 | PSMD1 | A001-C-203 | Human | Colorectum | FAP | 9.21e-09 | -2.73e-01 | -0.0481 |
| 5707 | PSMD1 | A002-C-116 | Human | Colorectum | FAP | 3.27e-22 | -4.00e-01 | -0.0452 |
| 5707 | PSMD1 | A014-C-008 | Human | Colorectum | FAP | 8.57e-10 | -5.06e-01 | -0.191 |
| Page: 1 2 3 4 5 6 7 8 |
| Tissue | Expression Dynamics | Abbreviation |
| Colorectum (GSE201348) | 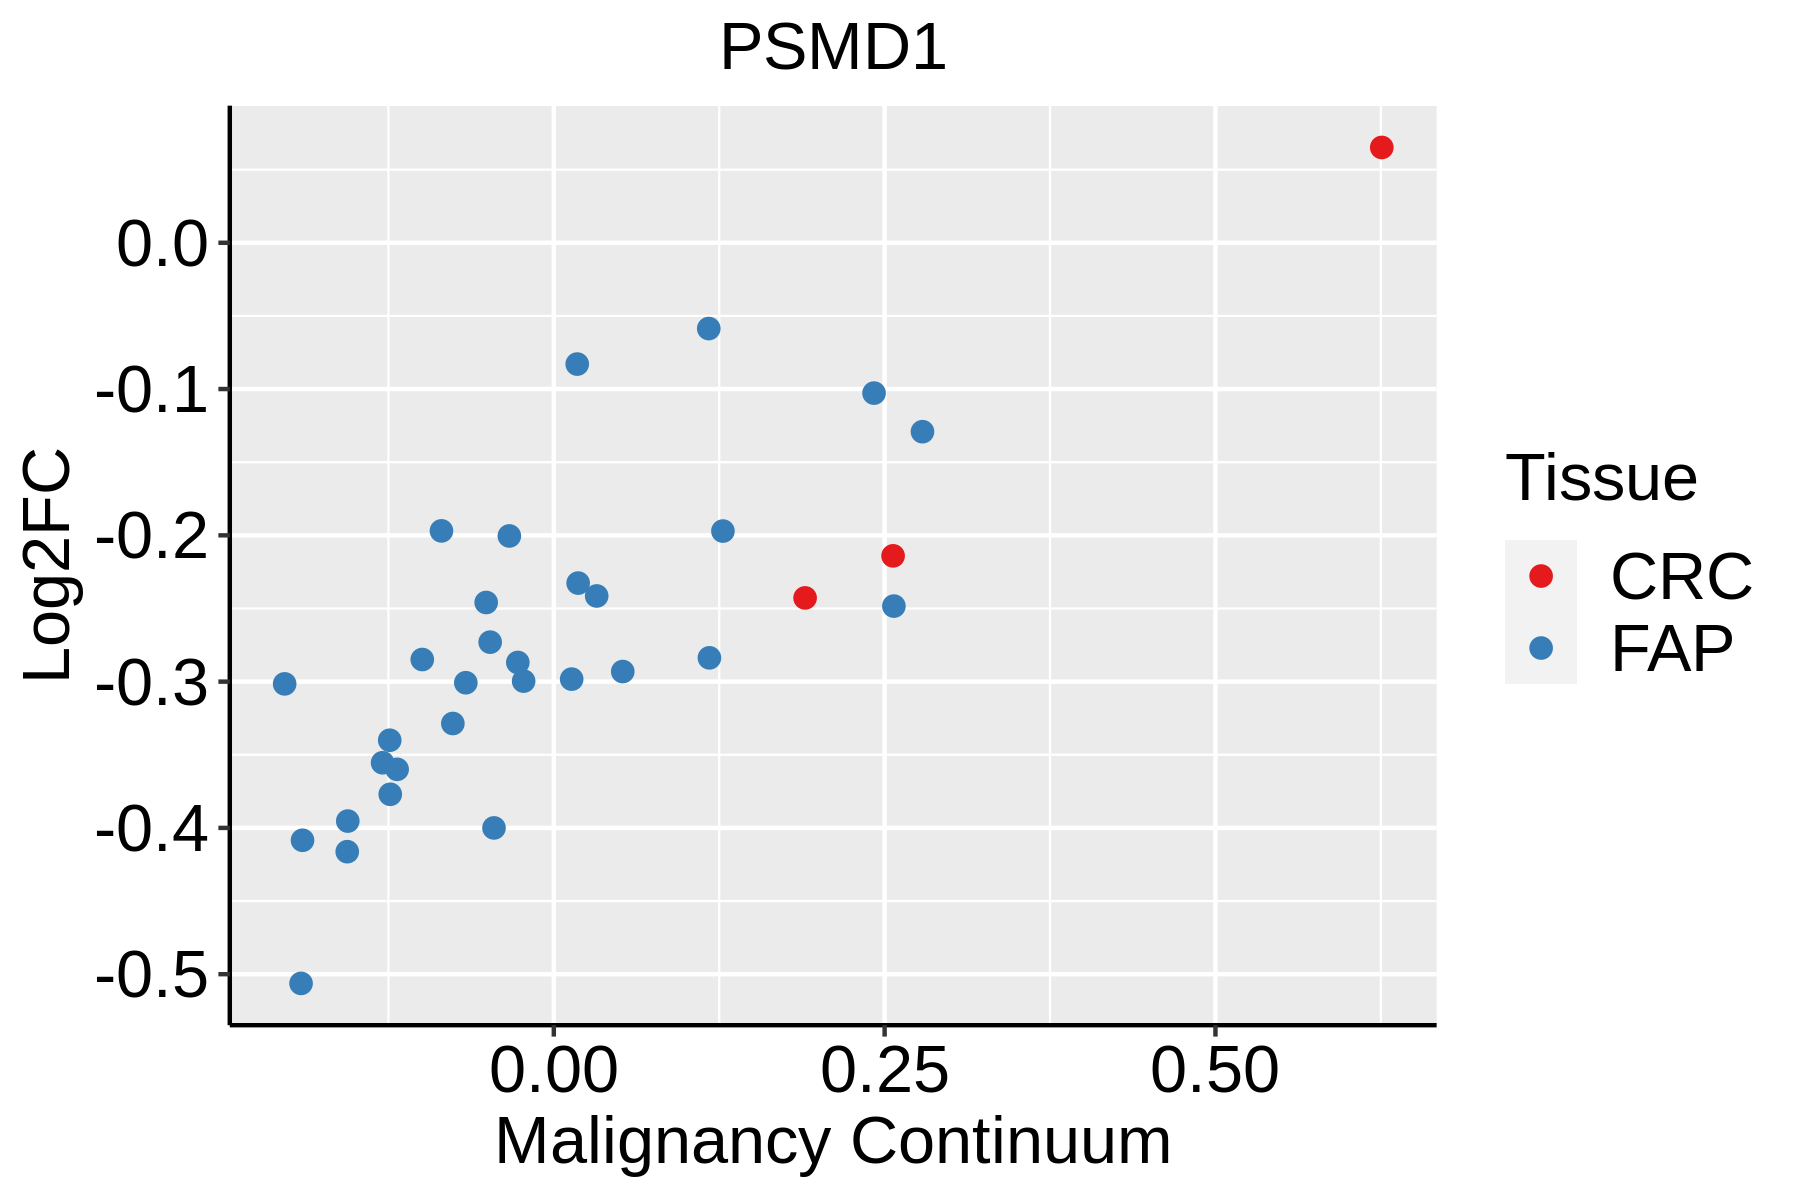 | FAP: Familial adenomatous polyposis |
| CRC: Colorectal cancer | ||
| Colorectum (HTA11) |  | AD: Adenomas |
| SER: Sessile serrated lesions | ||
| MSI-H: Microsatellite-high colorectal cancer | ||
| MSS: Microsatellite stable colorectal cancer | ||
| Esophagus | 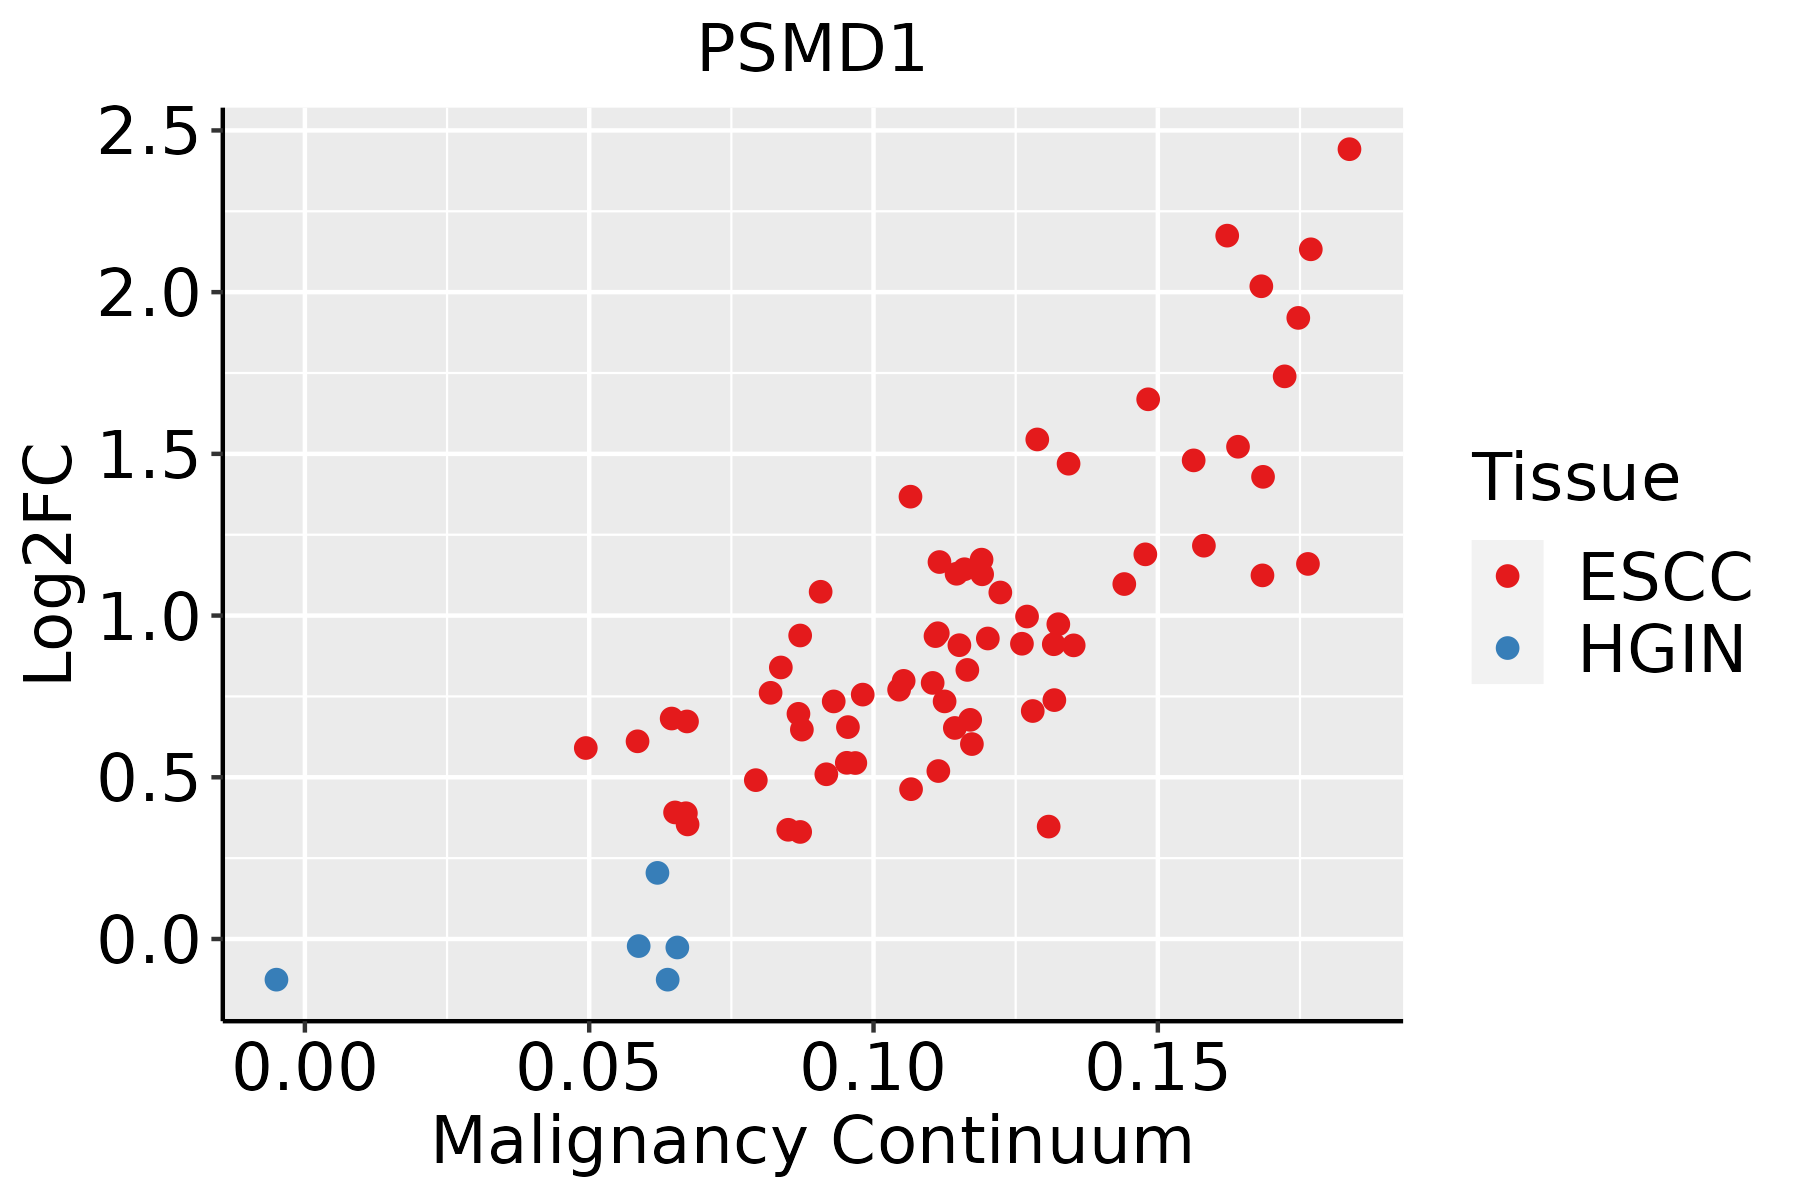 | ESCC: Esophageal squamous cell carcinoma |
| HGIN: High-grade intraepithelial neoplasias | ||
| LGIN: Low-grade intraepithelial neoplasias | ||
| Liver |  | HCC: Hepatocellular carcinoma |
| NAFLD: Non-alcoholic fatty liver disease | ||
| Oral Cavity | 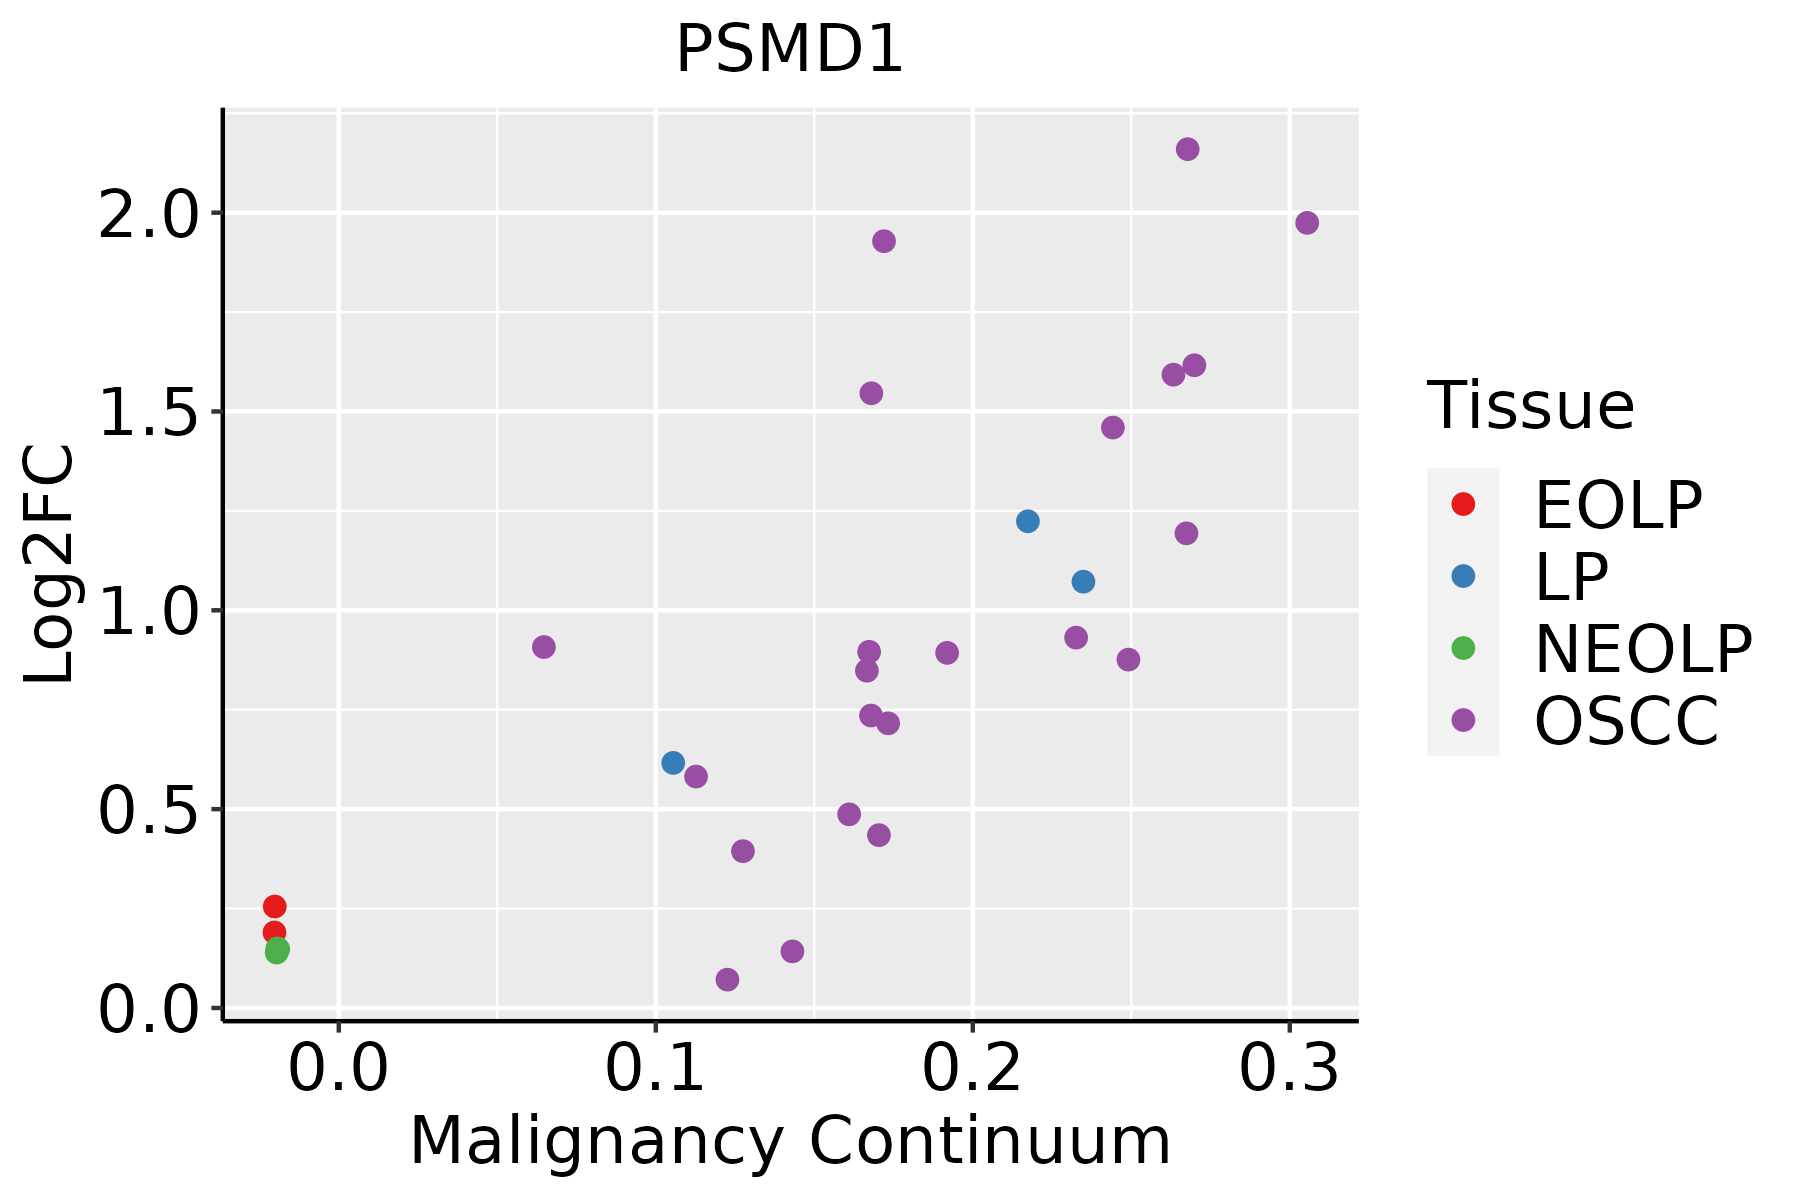 | EOLP: Erosive Oral lichen planus |
| LP: leukoplakia | ||
| NEOLP: Non-erosive oral lichen planus | ||
| OSCC: Oral squamous cell carcinoma | ||
| Skin | 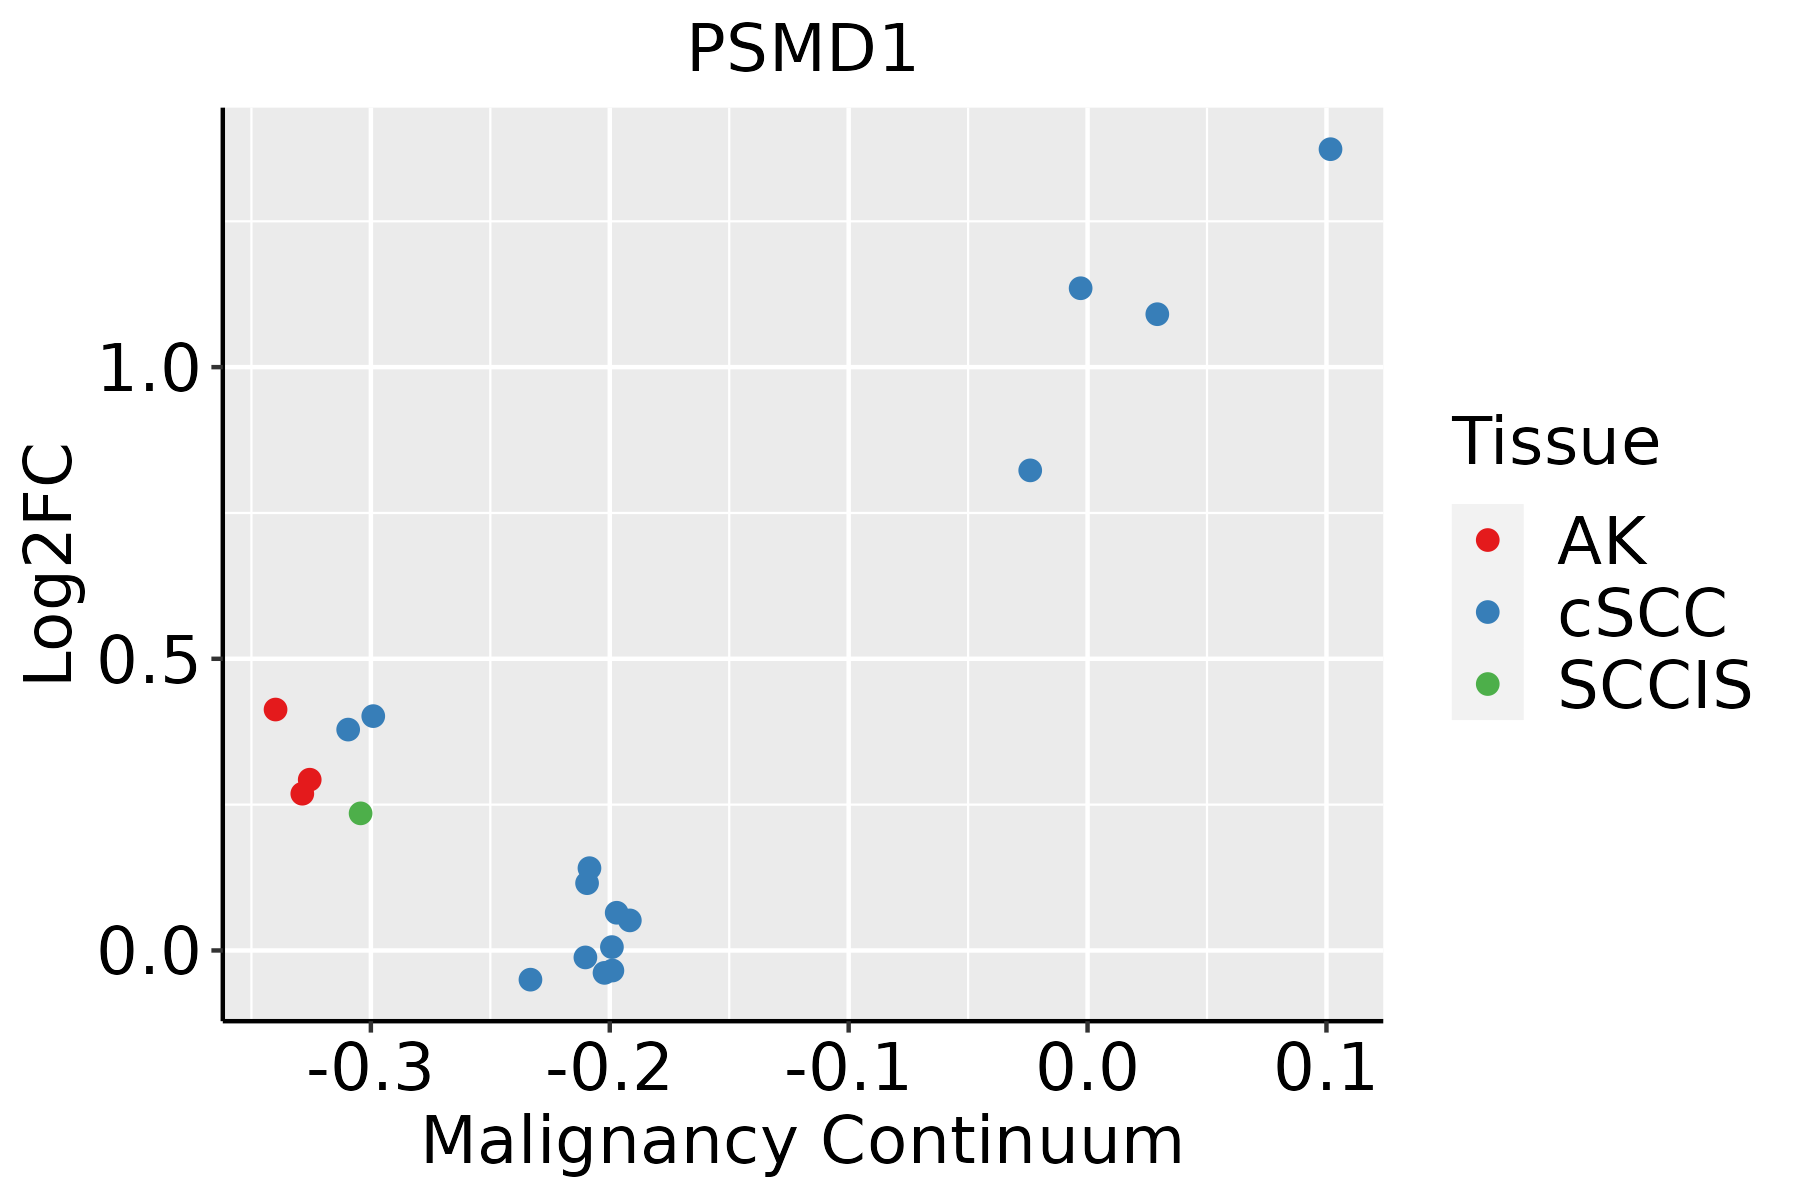 | AK: Actinic keratosis |
| cSCC: Cutaneous squamous cell carcinoma | ||
| SCCIS:squamous cell carcinoma in situ | ||
| Thyroid | 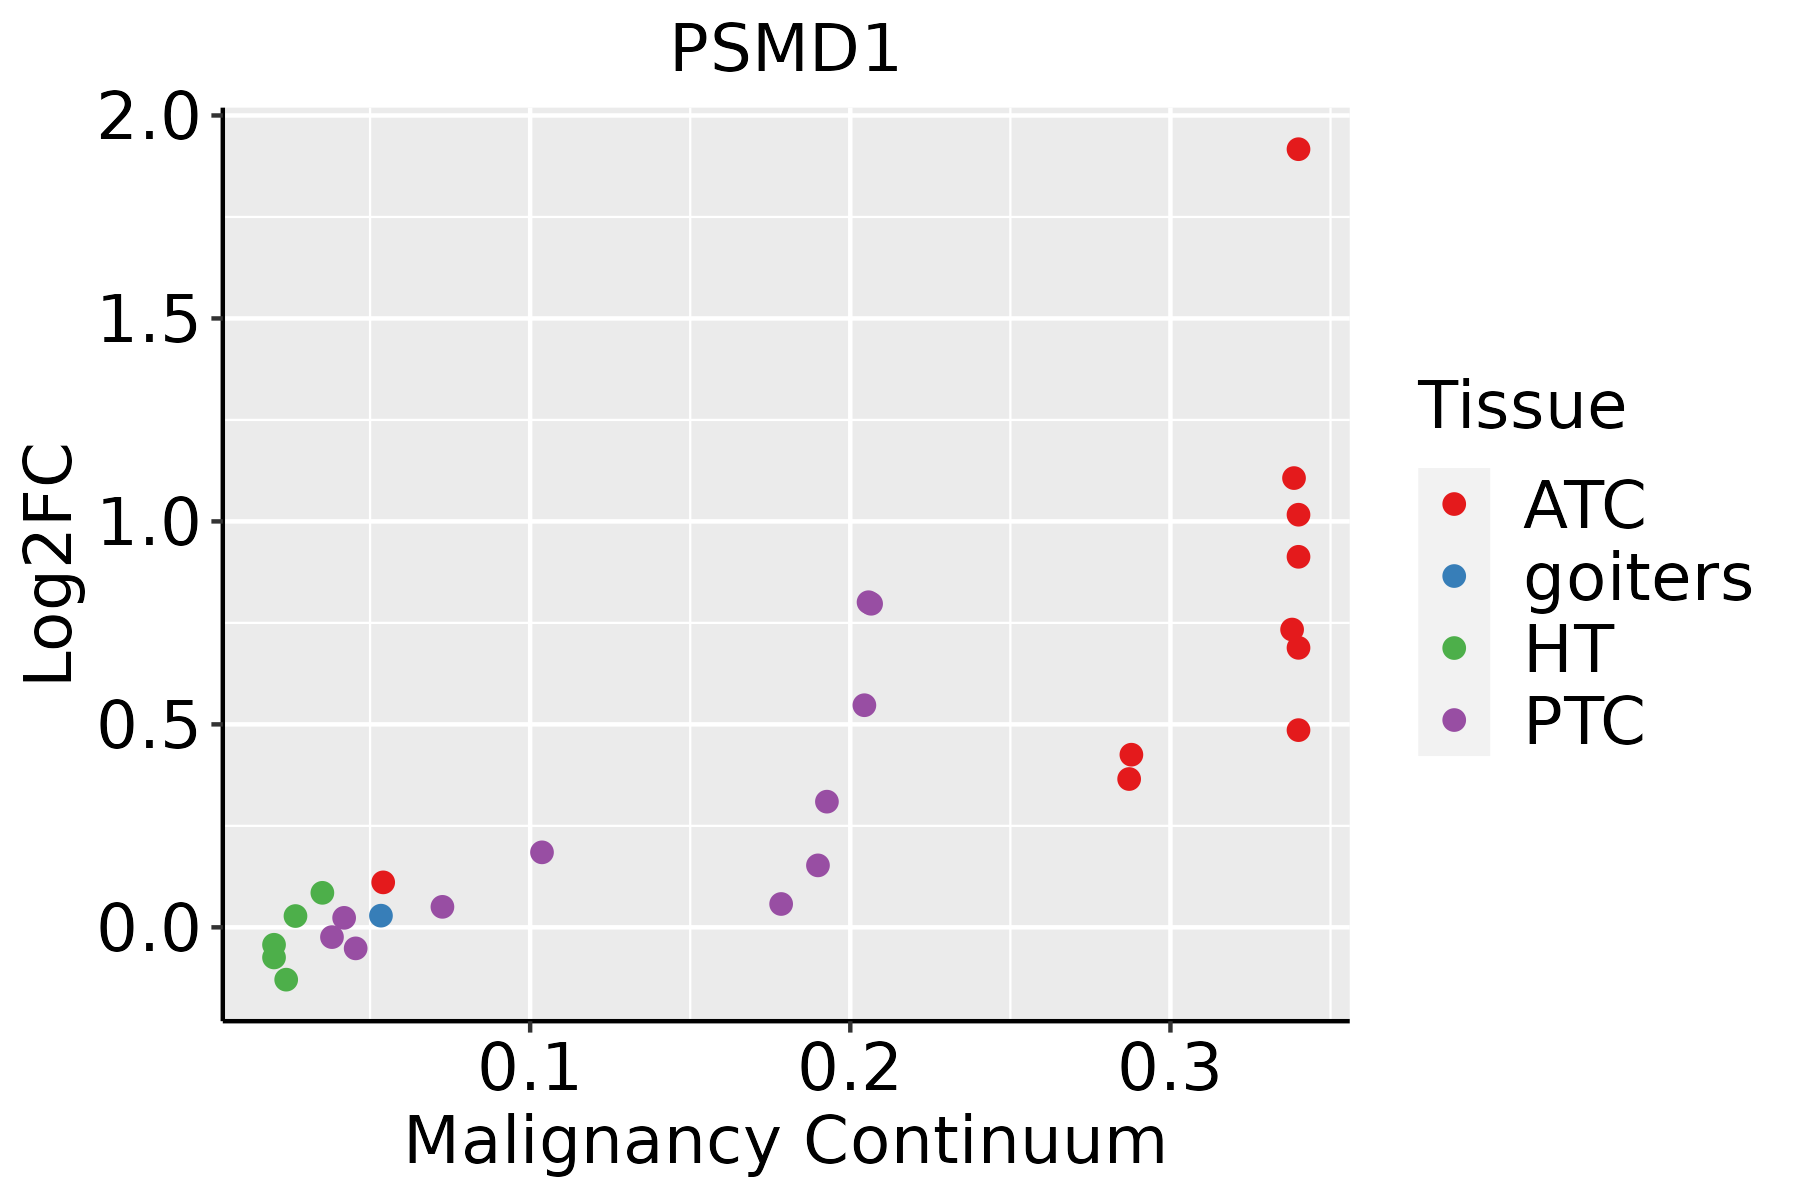 | ATC: Anaplastic thyroid cancer |
| HT: Hashimoto's thyroiditis | ||
| PTC: Papillary thyroid cancer |
| ∗log2FC in expression of this searched gene in stem-like cells from each diseased tissue sample relative to stem-like cells in normal samples in each tissue plotted against the malignancy continuum. Samples are colored based on if they are from different disease stage. |
Top |
Malignant transformation related pathway analysis |
| Find out the enriched GO biological processes and KEGG pathways involved in transition from healthy to precancer to cancer |
| Tissue | Disease Stage | Enriched GO biological Processes |
| Colorectum | AD |  |
| Colorectum | SER |  |
| Colorectum | MSS |  |
| Colorectum | MSI-H |  |
| Colorectum | FAP |  |
| ∗Top 15 enriched GO BP terms are showed in the bar plot of each disease state in each tissue. Each row represents a significant GO biological process which is colored according to the -log10(p.adjust). |
| Page: 1 2 3 4 5 6 7 8 9 |
| GO ID | Tissue | Disease Stage | Description | Gene Ratio | Bg Ratio | pvalue | p.adjust | Count |
| GO:001049820 | Oral cavity | OSCC | proteasomal protein catabolic process | 336/7305 | 490/18723 | 5.45e-41 | 8.63e-38 | 336 |
| GO:004316120 | Oral cavity | OSCC | proteasome-mediated ubiquitin-dependent protein catabolic process | 285/7305 | 412/18723 | 5.68e-36 | 5.99e-33 | 285 |
| GO:200123320 | Oral cavity | OSCC | regulation of apoptotic signaling pathway | 242/7305 | 356/18723 | 6.66e-29 | 3.24e-26 | 242 |
| GO:000989620 | Oral cavity | OSCC | positive regulation of catabolic process | 307/7305 | 492/18723 | 2.29e-26 | 7.64e-24 | 307 |
| GO:003133120 | Oral cavity | OSCC | positive regulation of cellular catabolic process | 273/7305 | 427/18723 | 6.39e-26 | 2.02e-23 | 273 |
| GO:004217620 | Oral cavity | OSCC | regulation of protein catabolic process | 254/7305 | 391/18723 | 1.07e-25 | 3.22e-23 | 254 |
| GO:004586220 | Oral cavity | OSCC | positive regulation of proteolysis | 236/7305 | 372/18723 | 6.53e-22 | 1.38e-19 | 236 |
| GO:190336220 | Oral cavity | OSCC | regulation of cellular protein catabolic process | 174/7305 | 255/18723 | 2.04e-21 | 3.70e-19 | 174 |
| GO:190332020 | Oral cavity | OSCC | regulation of protein modification by small protein conjugation or removal | 165/7305 | 242/18723 | 2.52e-20 | 3.99e-18 | 165 |
| GO:190305020 | Oral cavity | OSCC | regulation of proteolysis involved in cellular protein catabolic process | 152/7305 | 221/18723 | 2.16e-19 | 3.15e-17 | 152 |
| GO:006113620 | Oral cavity | OSCC | regulation of proteasomal protein catabolic process | 132/7305 | 187/18723 | 1.57e-18 | 1.81e-16 | 132 |
| GO:200005820 | Oral cavity | OSCC | regulation of ubiquitin-dependent protein catabolic process | 118/7305 | 164/18723 | 9.37e-18 | 9.27e-16 | 118 |
| GO:003139620 | Oral cavity | OSCC | regulation of protein ubiquitination | 143/7305 | 210/18723 | 1.01e-17 | 9.80e-16 | 143 |
| GO:003243420 | Oral cavity | OSCC | regulation of proteasomal ubiquitin-dependent protein catabolic process | 100/7305 | 134/18723 | 4.72e-17 | 4.04e-15 | 100 |
| GO:200123420 | Oral cavity | OSCC | negative regulation of apoptotic signaling pathway | 148/7305 | 224/18723 | 1.71e-16 | 1.36e-14 | 148 |
| GO:004573220 | Oral cavity | OSCC | positive regulation of protein catabolic process | 150/7305 | 231/18723 | 1.06e-15 | 7.64e-14 | 150 |
| GO:001604917 | Oral cavity | OSCC | cell growth | 268/7305 | 482/18723 | 6.55e-14 | 3.51e-12 | 268 |
| GO:190336420 | Oral cavity | OSCC | positive regulation of cellular protein catabolic process | 106/7305 | 155/18723 | 1.07e-13 | 5.53e-12 | 106 |
| GO:005254720 | Oral cavity | OSCC | regulation of peptidase activity | 255/7305 | 461/18723 | 5.78e-13 | 2.75e-11 | 255 |
| GO:190180018 | Oral cavity | OSCC | positive regulation of proteasomal protein catabolic process | 82/7305 | 114/18723 | 9.33e-13 | 4.22e-11 | 82 |
| Page: 1 2 3 4 5 6 7 8 9 10 11 12 13 14 15 16 17 18 19 20 21 22 |
| Pathway ID | Tissue | Disease Stage | Description | Gene Ratio | Bg Ratio | pvalue | p.adjust | qvalue | Count |
| hsa05012 | Colorectum | AD | Parkinson disease | 147/2092 | 266/8465 | 2.53e-27 | 8.48e-25 | 5.41e-25 | 147 |
| hsa05010 | Colorectum | AD | Alzheimer disease | 174/2092 | 384/8465 | 1.82e-19 | 9.26e-18 | 5.91e-18 | 174 |
| hsa05016 | Colorectum | AD | Huntington disease | 147/2092 | 306/8465 | 1.93e-19 | 9.26e-18 | 5.91e-18 | 147 |
| hsa05020 | Colorectum | AD | Prion disease | 133/2092 | 273/8465 | 2.47e-18 | 8.29e-17 | 5.29e-17 | 133 |
| hsa05014 | Colorectum | AD | Amyotrophic lateral sclerosis | 164/2092 | 364/8465 | 4.28e-18 | 1.27e-16 | 8.09e-17 | 164 |
| hsa05022 | Colorectum | AD | Pathways of neurodegeneration - multiple diseases | 201/2092 | 476/8465 | 4.54e-18 | 1.27e-16 | 8.09e-17 | 201 |
| hsa03050 | Colorectum | AD | Proteasome | 29/2092 | 46/8465 | 3.87e-08 | 6.18e-07 | 3.94e-07 | 29 |
| hsa05017 | Colorectum | AD | Spinocerebellar ataxia | 60/2092 | 143/8465 | 3.78e-06 | 4.35e-05 | 2.78e-05 | 60 |
| hsa050121 | Colorectum | AD | Parkinson disease | 147/2092 | 266/8465 | 2.53e-27 | 8.48e-25 | 5.41e-25 | 147 |
| hsa050101 | Colorectum | AD | Alzheimer disease | 174/2092 | 384/8465 | 1.82e-19 | 9.26e-18 | 5.91e-18 | 174 |
| hsa050161 | Colorectum | AD | Huntington disease | 147/2092 | 306/8465 | 1.93e-19 | 9.26e-18 | 5.91e-18 | 147 |
| hsa050201 | Colorectum | AD | Prion disease | 133/2092 | 273/8465 | 2.47e-18 | 8.29e-17 | 5.29e-17 | 133 |
| hsa050141 | Colorectum | AD | Amyotrophic lateral sclerosis | 164/2092 | 364/8465 | 4.28e-18 | 1.27e-16 | 8.09e-17 | 164 |
| hsa050221 | Colorectum | AD | Pathways of neurodegeneration - multiple diseases | 201/2092 | 476/8465 | 4.54e-18 | 1.27e-16 | 8.09e-17 | 201 |
| hsa030501 | Colorectum | AD | Proteasome | 29/2092 | 46/8465 | 3.87e-08 | 6.18e-07 | 3.94e-07 | 29 |
| hsa050171 | Colorectum | AD | Spinocerebellar ataxia | 60/2092 | 143/8465 | 3.78e-06 | 4.35e-05 | 2.78e-05 | 60 |
| hsa050128 | Colorectum | FAP | Parkinson disease | 80/1404 | 266/8465 | 2.04e-08 | 6.20e-07 | 3.77e-07 | 80 |
| hsa050108 | Colorectum | FAP | Alzheimer disease | 105/1404 | 384/8465 | 3.74e-08 | 1.04e-06 | 6.33e-07 | 105 |
| hsa050228 | Colorectum | FAP | Pathways of neurodegeneration - multiple diseases | 117/1404 | 476/8465 | 2.81e-06 | 4.47e-05 | 2.72e-05 | 117 |
| hsa050148 | Colorectum | FAP | Amyotrophic lateral sclerosis | 91/1404 | 364/8465 | 1.84e-05 | 2.36e-04 | 1.44e-04 | 91 |
| Page: 1 2 3 4 5 6 7 8 |
Top |
Cell-cell communication analysis |
| Identification of potential cell-cell interactions between two cell types and their ligand-receptor pairs for different disease states |
| Ligand | Receptor | LRpair | Pathway | Tissue | Disease Stage |
| Page: 1 |
Top |
Single-cell gene regulatory network inference analysis |
| Find out the significant the regulons (TFs) and the target genes of each regulon across cell types for different disease states |
| TF | Cell Type | Tissue | Disease Stage | Target Gene | RSS | Regulon Activity |
| ∗The dot plots of a searched regulon are shown for all cell subpopulations in each disease state of each tissue based on the regulon specific score inferred using pySCENIC and by calculating the average expression. |
| Page: 1 |
Top |
Somatic mutation of malignant transformation related genes |
| Annotation of somatic variants for genes involved in malignant transformation |
| Hugo Symbol | Variant Class | Variant Classification | dbSNP RS | HGVSc | HGVSp | HGVSp Short | SWISSPROT | BIOTYPE | SIFT | PolyPhen | Tumor Sample Barcode | Tissue | Histology | Sex | Age | Stage | Therapy Types | Drugs | Outcome |
| PSMD1 | SNV | Missense_Mutation | rs745401053 | c.164N>A | p.Arg55Gln | p.R55Q | Q99460 | protein_coding | tolerated(0.19) | benign(0) | TCGA-A2-A04P-01 | Breast | breast invasive carcinoma | Female | <65 | III/IV | Chemotherapy | taxol | PD |
| PSMD1 | SNV | Missense_Mutation | c.2809N>A | p.Glu937Lys | p.E937K | Q99460 | protein_coding | tolerated(0.74) | possibly_damaging(0.899) | TCGA-AC-A23H-01 | Breast | breast invasive carcinoma | Female | >=65 | I/II | Unknown | Unknown | PD | |
| PSMD1 | SNV | Missense_Mutation | c.2812N>A | p.Glu938Lys | p.E938K | Q99460 | protein_coding | tolerated(0.7) | possibly_damaging(0.899) | TCGA-BH-A0B5-01 | Breast | breast invasive carcinoma | Female | <65 | III/IV | Chemotherapy | adriamycin | CR | |
| PSMD1 | SNV | Missense_Mutation | c.2755N>C | p.Glu919Gln | p.E919Q | Q99460 | protein_coding | tolerated(0.14) | possibly_damaging(0.543) | TCGA-D8-A1J8-01 | Breast | breast invasive carcinoma | Female | >=65 | I/II | Hormone Therapy | nolvadex | SD | |
| PSMD1 | SNV | Missense_Mutation | c.2098G>A | p.Glu700Lys | p.E700K | Q99460 | protein_coding | deleterious(0.02) | benign(0.141) | TCGA-D8-A27G-01 | Breast | breast invasive carcinoma | Female | >=65 | I/II | Unknown | Unknown | SD | |
| PSMD1 | SNV | Missense_Mutation | c.898N>C | p.Glu300Gln | p.E300Q | Q99460 | protein_coding | tolerated(0.24) | benign(0.001) | TCGA-E2-A10C-01 | Breast | breast invasive carcinoma | Female | <65 | I/II | Chemotherapy | cytoxan | SD | |
| PSMD1 | SNV | Missense_Mutation | c.2177C>A | p.Ala726Asp | p.A726D | Q99460 | protein_coding | deleterious(0) | probably_damaging(0.923) | TCGA-E9-A295-01 | Breast | breast invasive carcinoma | Female | >=65 | I/II | Hormone Therapy | tamoxiphen | SD | |
| PSMD1 | insertion | Frame_Shift_Ins | novel | c.850dupA | p.Thr284AsnfsTer12 | p.T284Nfs*12 | Q99460 | protein_coding | TCGA-A2-A0EN-01 | Breast | breast invasive carcinoma | Female | >=65 | I/II | Hormone Therapy | tamoxiphen | SD | ||
| PSMD1 | insertion | Frame_Shift_Ins | novel | c.2407_2408insCTTTTCTT | p.Lys803ThrfsTer36 | p.K803Tfs*36 | Q99460 | protein_coding | TCGA-AC-A3QQ-01 | Breast | breast invasive carcinoma | Female | <65 | I/II | Unknown | Unknown | SD | ||
| PSMD1 | insertion | Frame_Shift_Ins | novel | c.268_269insC | p.Val90AlafsTer3 | p.V90Afs*3 | Q99460 | protein_coding | TCGA-B6-A0I8-01 | Breast | breast invasive carcinoma | Female | <65 | I/II | Unknown | Unknown | PD |
| Page: 1 2 3 4 5 6 7 8 9 10 11 |
Top |
Related drugs of malignant transformation related genes |
| Identification of chemicals and drugs interact with genes involved in malignant transfromation |
| (DGIdb 4.0) |
| Entrez ID | Symbol | Category | Interaction Types | Drug Claim Name | Drug Name | PMIDs |
| 5707 | PSMD1 | NA | OPROZOMIB | OPROZOMIB | ||
| 5707 | PSMD1 | NA | inhibitor | CHEMBL325041 | BORTEZOMIB | |
| 5707 | PSMD1 | NA | inhibitor | CARFILZOMIB | CARFILZOMIB | |
| 5707 | PSMD1 | NA | BORTEZOMIB | BORTEZOMIB | 24524217 | |
| 5707 | PSMD1 | NA | inhibitor | CHEMBL2103884 | OPROZOMIB | |
| 5707 | PSMD1 | NA | BORTEZOMIB | BORTEZOMIB | ||
| 5707 | PSMD1 | NA | BORTEZOMIB | BORTEZOMIB | ||
| 5707 | PSMD1 | NA | CARFILZOMIB | CARFILZOMIB | 24524217 | |
| 5707 | PSMD1 | NA | MLN-9708 | IXAZOMIB CITRATE | ||
| 5707 | PSMD1 | NA | inhibitor | CHEMBL451887 | CARFILZOMIB |
| Page: 1 2 |

Copyright 2023-Present -The University of Texas Health Science Center at Houston |