
|
|||||
|
 | |
| |
| |
| |
| |
| |
|
Gene: PDK2 |
Gene summary for PDK2 |
| Gene information | Species | Human | Gene symbol | PDK2 | Gene ID | 5164 |
| Gene name | pyruvate dehydrogenase kinase 2 | |
| Gene Alias | PDHK2 | |
| Cytomap | 17q21.33 | |
| Gene Type | protein-coding | GO ID | GO:0000302 | UniProtAcc | Q15119 |
Top |
Malignant transformation analysis |
| Identification of the aberrant gene expression in precancerous and cancerous lesions by comparing the gene expression of stem-like cells in diseased tissues with normal stem cells |
| Entrez ID | Symbol | Replicates | Species | Organ | Tissue | Adj P-value | Log2FC | Malignancy |
| 5164 | PDK2 | LZE4T | Human | Esophagus | ESCC | 3.86e-05 | 1.12e-01 | 0.0811 |
| 5164 | PDK2 | LZE7T | Human | Esophagus | ESCC | 2.14e-05 | 1.55e-01 | 0.0667 |
| 5164 | PDK2 | LZE20T | Human | Esophagus | ESCC | 4.57e-03 | 1.13e-01 | 0.0662 |
| 5164 | PDK2 | LZE21D1 | Human | Esophagus | HGIN | 7.58e-03 | 1.88e-01 | 0.0632 |
| 5164 | PDK2 | LZE22T | Human | Esophagus | ESCC | 3.42e-05 | 2.68e-01 | 0.068 |
| 5164 | PDK2 | LZE24T | Human | Esophagus | ESCC | 3.46e-16 | 5.16e-01 | 0.0596 |
| 5164 | PDK2 | LZE21T | Human | Esophagus | ESCC | 1.08e-04 | 3.26e-01 | 0.0655 |
| 5164 | PDK2 | LZE6T | Human | Esophagus | ESCC | 1.56e-05 | 2.71e-01 | 0.0845 |
| 5164 | PDK2 | P1T-E | Human | Esophagus | ESCC | 8.49e-12 | 3.59e-01 | 0.0875 |
| 5164 | PDK2 | P2T-E | Human | Esophagus | ESCC | 6.56e-32 | 4.81e-01 | 0.1177 |
| 5164 | PDK2 | P4T-E | Human | Esophagus | ESCC | 3.02e-21 | 5.10e-01 | 0.1323 |
| 5164 | PDK2 | P5T-E | Human | Esophagus | ESCC | 6.98e-16 | 2.03e-01 | 0.1327 |
| 5164 | PDK2 | P8T-E | Human | Esophagus | ESCC | 2.49e-24 | 3.78e-01 | 0.0889 |
| 5164 | PDK2 | P9T-E | Human | Esophagus | ESCC | 1.97e-10 | 1.81e-01 | 0.1131 |
| 5164 | PDK2 | P10T-E | Human | Esophagus | ESCC | 1.27e-34 | 5.18e-01 | 0.116 |
| 5164 | PDK2 | P11T-E | Human | Esophagus | ESCC | 6.64e-12 | 5.22e-01 | 0.1426 |
| 5164 | PDK2 | P12T-E | Human | Esophagus | ESCC | 1.09e-23 | 4.60e-01 | 0.1122 |
| 5164 | PDK2 | P15T-E | Human | Esophagus | ESCC | 1.16e-19 | 3.61e-01 | 0.1149 |
| 5164 | PDK2 | P16T-E | Human | Esophagus | ESCC | 2.55e-17 | 2.59e-01 | 0.1153 |
| 5164 | PDK2 | P17T-E | Human | Esophagus | ESCC | 2.33e-06 | 2.60e-01 | 0.1278 |
| Page: 1 2 3 4 5 |
| Tissue | Expression Dynamics | Abbreviation |
| Esophagus | 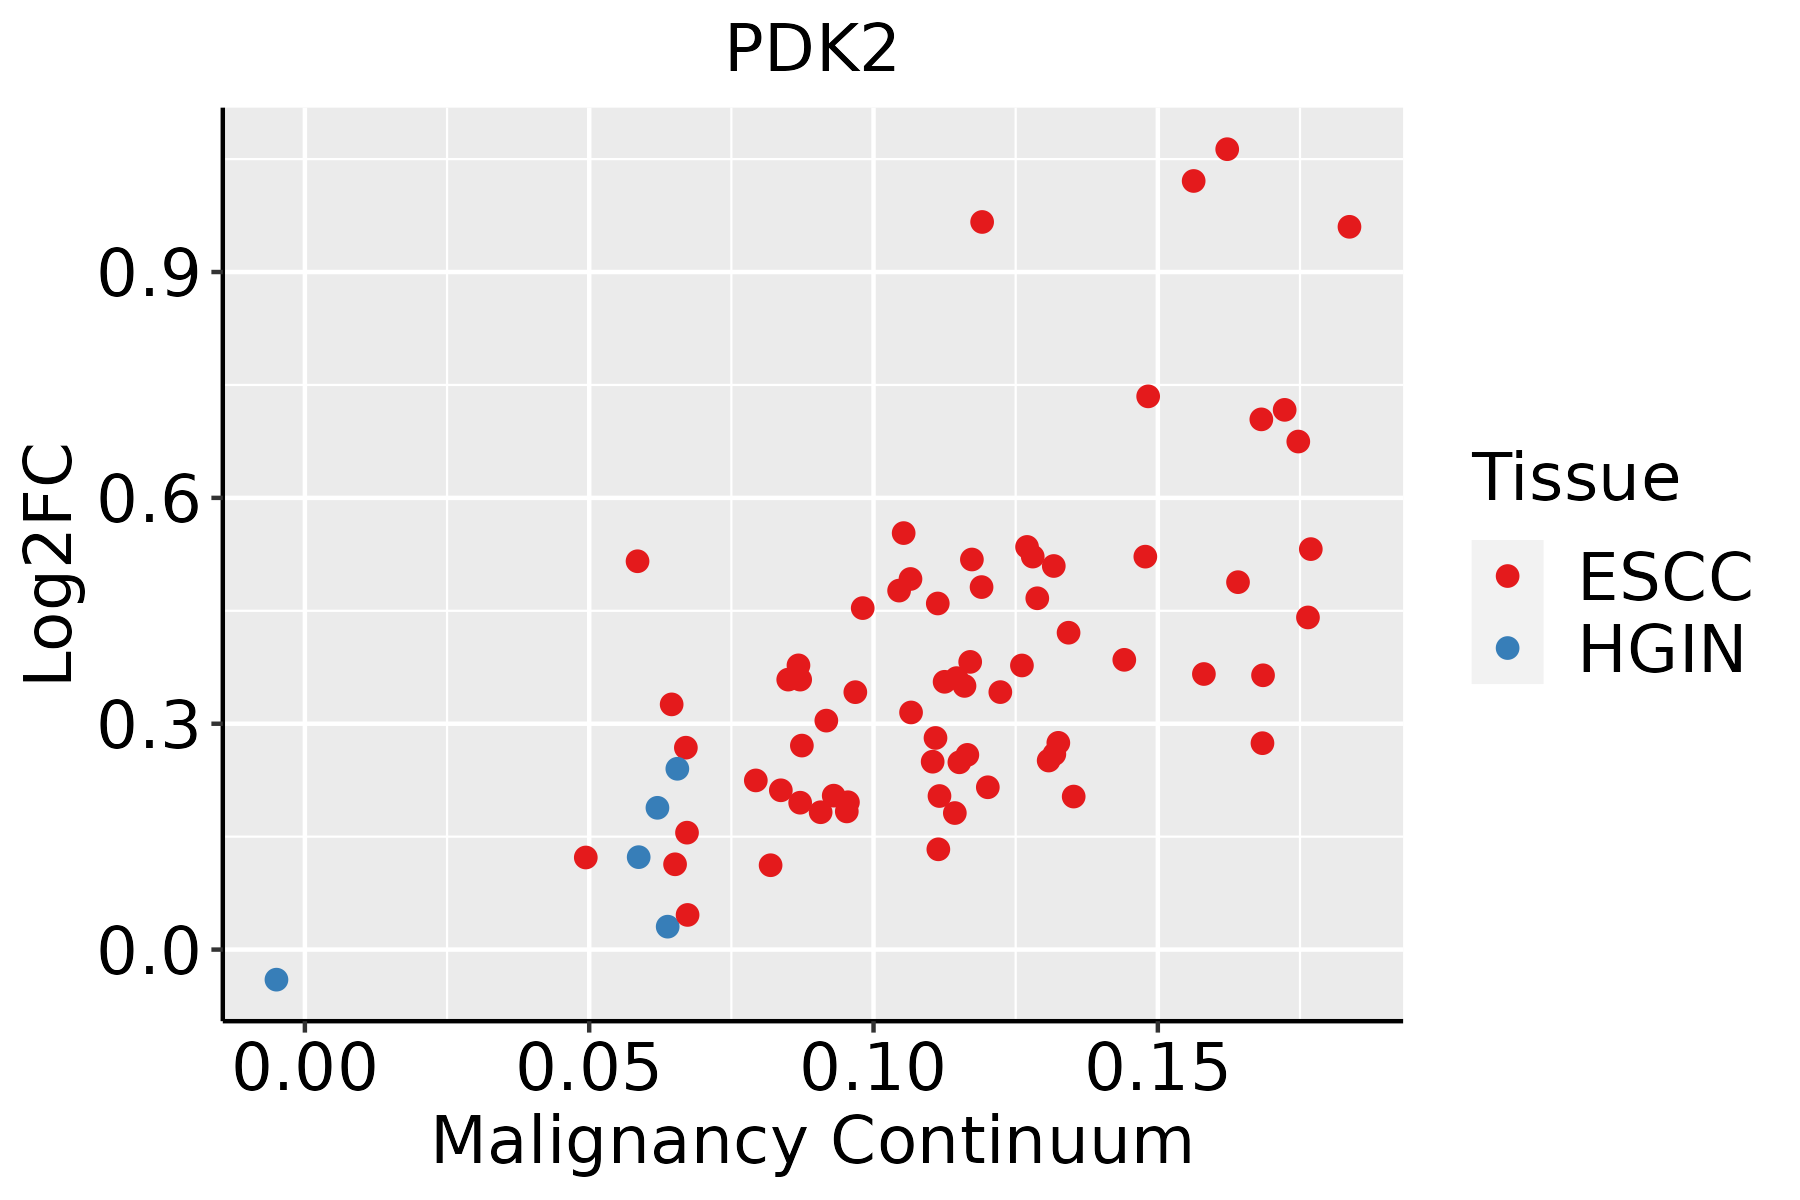 | ESCC: Esophageal squamous cell carcinoma |
| HGIN: High-grade intraepithelial neoplasias | ||
| LGIN: Low-grade intraepithelial neoplasias | ||
| Liver | 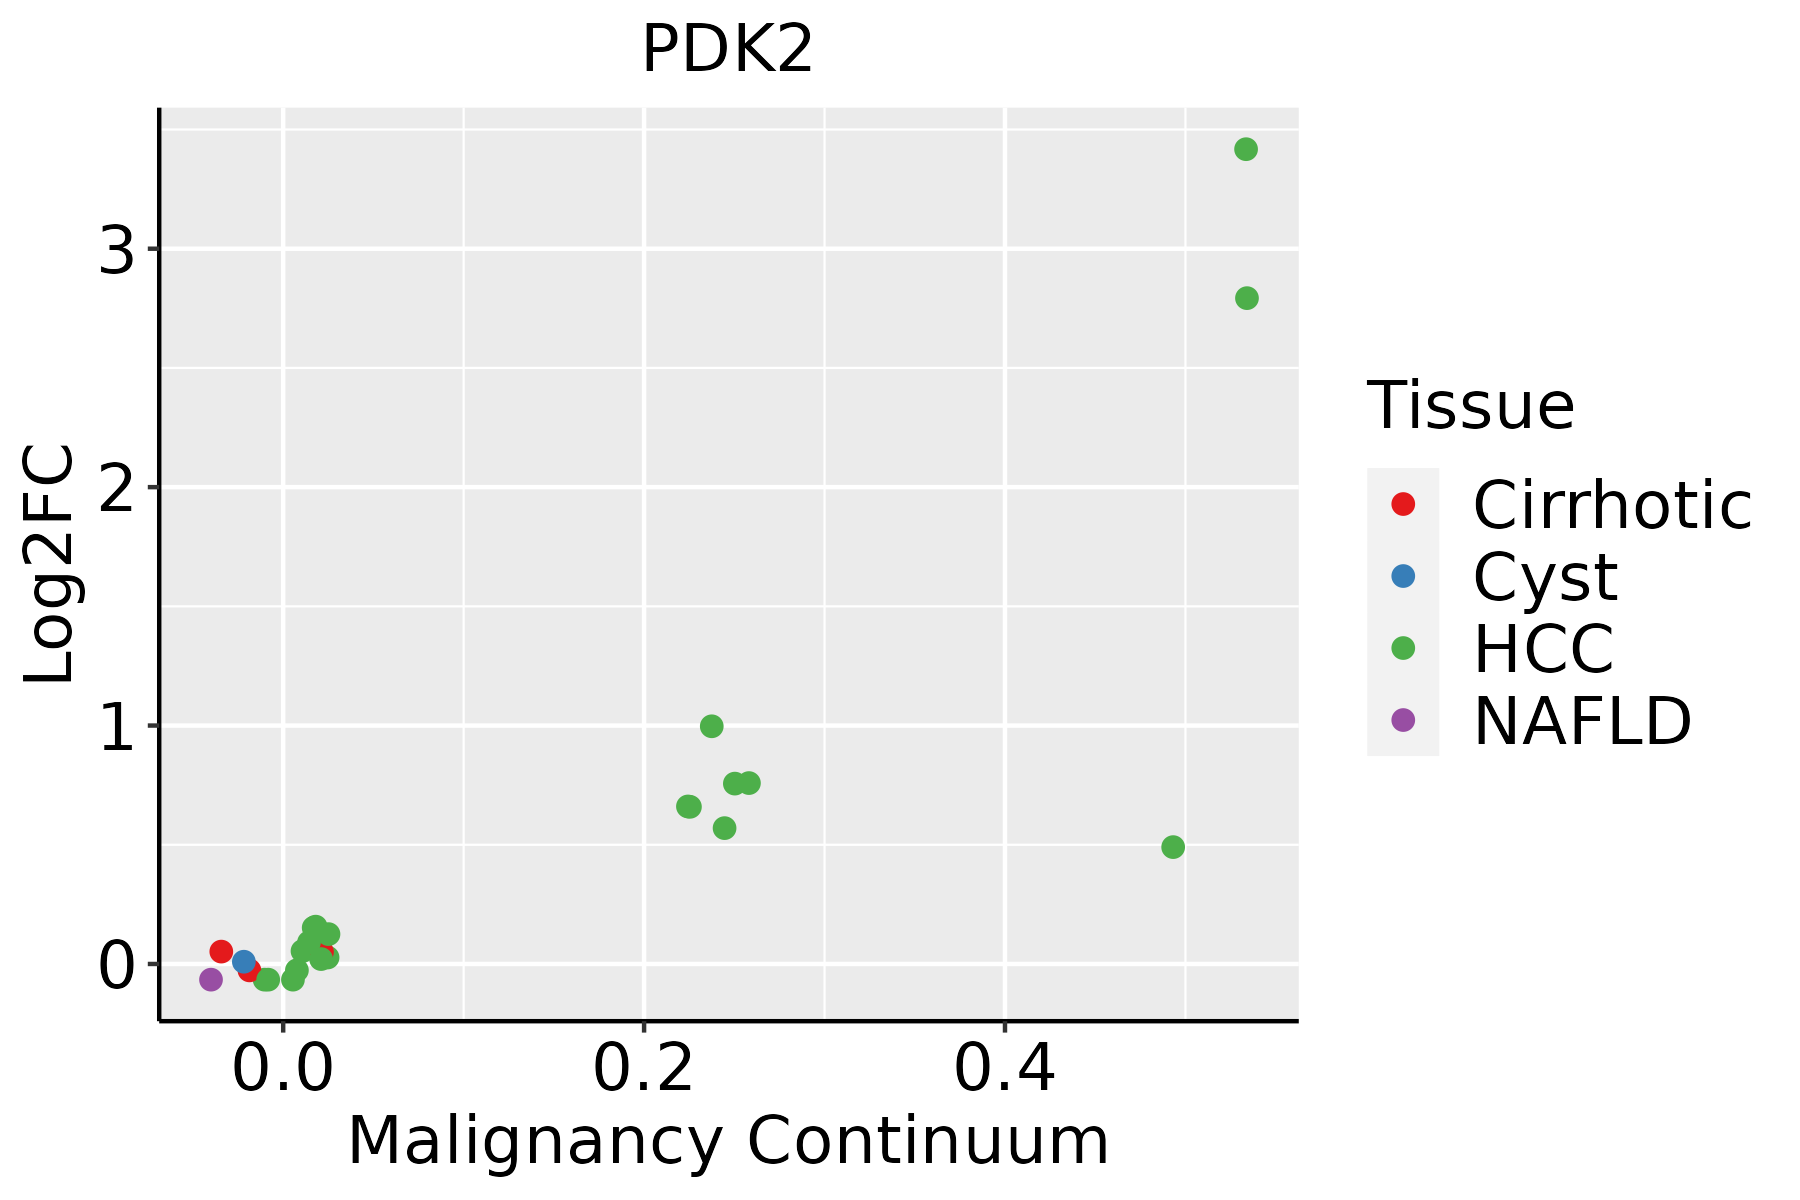 | HCC: Hepatocellular carcinoma |
| NAFLD: Non-alcoholic fatty liver disease | ||
| Oral Cavity | 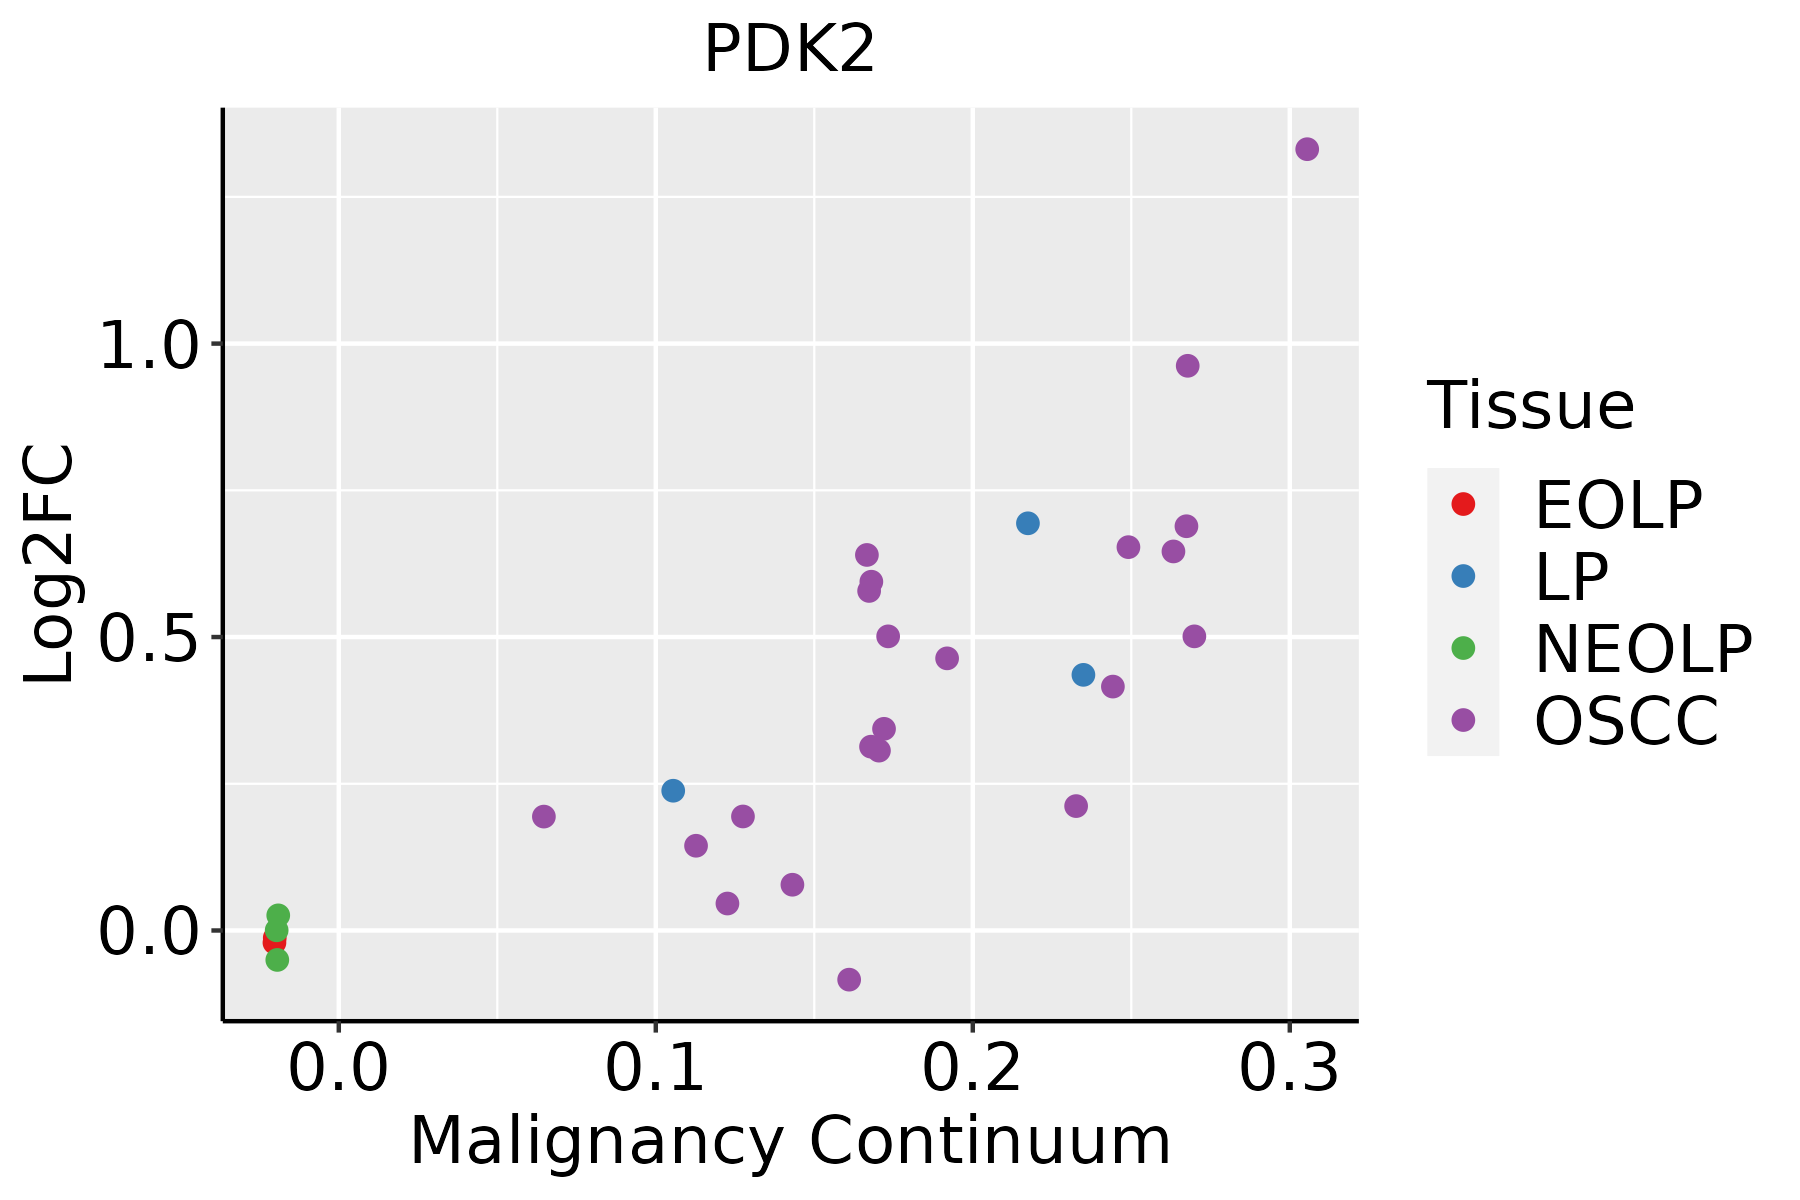 | EOLP: Erosive Oral lichen planus |
| LP: leukoplakia | ||
| NEOLP: Non-erosive oral lichen planus | ||
| OSCC: Oral squamous cell carcinoma |
| ∗log2FC in expression of this searched gene in stem-like cells from each diseased tissue sample relative to stem-like cells in normal samples in each tissue plotted against the malignancy continuum. Samples are colored based on if they are from different disease stage. |
Top |
Malignant transformation related pathway analysis |
| Find out the enriched GO biological processes and KEGG pathways involved in transition from healthy to precancer to cancer |
| Tissue | Disease Stage | Enriched GO biological Processes |
| Colorectum | AD |  |
| Colorectum | SER |  |
| Colorectum | MSS |  |
| Colorectum | MSI-H |  |
| Colorectum | FAP |  |
| ∗Top 15 enriched GO BP terms are showed in the bar plot of each disease state in each tissue. Each row represents a significant GO biological process which is colored according to the -log10(p.adjust). |
| Page: 1 2 3 4 5 6 7 8 9 |
| GO ID | Tissue | Disease Stage | Description | Gene Ratio | Bg Ratio | pvalue | p.adjust | Count |
| GO:0000302110 | Oral cavity | LP | response to reactive oxygen species | 95/4623 | 222/18723 | 2.23e-09 | 9.98e-08 | 95 |
| GO:0062197110 | Oral cavity | LP | cellular response to chemical stress | 130/4623 | 337/18723 | 8.94e-09 | 3.52e-07 | 130 |
| GO:0071496110 | Oral cavity | LP | cellular response to external stimulus | 124/4623 | 320/18723 | 1.44e-08 | 5.36e-07 | 124 |
| GO:0072331110 | Oral cavity | LP | signal transduction by p53 class mediator | 72/4623 | 163/18723 | 3.99e-08 | 1.41e-06 | 72 |
| GO:0034599110 | Oral cavity | LP | cellular response to oxidative stress | 110/4623 | 288/18723 | 2.19e-07 | 6.65e-06 | 110 |
| GO:0031667110 | Oral cavity | LP | response to nutrient levels | 165/4623 | 474/18723 | 3.87e-07 | 1.12e-05 | 165 |
| GO:0072332110 | Oral cavity | LP | intrinsic apoptotic signaling pathway by p53 class mediator | 39/4623 | 76/18723 | 5.10e-07 | 1.40e-05 | 39 |
| GO:0031668110 | Oral cavity | LP | cellular response to extracellular stimulus | 91/4623 | 246/18723 | 1.07e-05 | 1.94e-04 | 91 |
| GO:0034614110 | Oral cavity | LP | cellular response to reactive oxygen species | 61/4623 | 155/18723 | 3.66e-05 | 5.43e-04 | 61 |
| GO:0043434110 | Oral cavity | LP | response to peptide hormone | 138/4623 | 414/18723 | 4.00e-05 | 5.87e-04 | 138 |
| GO:190165317 | Oral cavity | LP | cellular response to peptide | 122/4623 | 359/18723 | 4.22e-05 | 6.10e-04 | 122 |
| GO:003166919 | Oral cavity | LP | cellular response to nutrient levels | 79/4623 | 215/18723 | 5.16e-05 | 7.21e-04 | 79 |
| GO:000675319 | Oral cavity | LP | nucleoside phosphate metabolic process | 161/4623 | 497/18723 | 5.31e-05 | 7.39e-04 | 161 |
| GO:0009117110 | Oral cavity | LP | nucleotide metabolic process | 158/4623 | 489/18723 | 7.17e-05 | 9.49e-04 | 158 |
| GO:000758414 | Oral cavity | LP | response to nutrient | 65/4623 | 174/18723 | 1.31e-04 | 1.52e-03 | 65 |
| GO:0019693110 | Oral cavity | LP | ribose phosphate metabolic process | 128/4623 | 396/18723 | 3.26e-04 | 3.28e-03 | 128 |
| GO:000599613 | Oral cavity | LP | monosaccharide metabolic process | 86/4623 | 257/18723 | 9.13e-04 | 7.79e-03 | 86 |
| GO:003286817 | Oral cavity | LP | response to insulin | 88/4623 | 264/18723 | 9.19e-04 | 7.82e-03 | 88 |
| GO:003286917 | Oral cavity | LP | cellular response to insulin stimulus | 70/4623 | 203/18723 | 1.07e-03 | 8.96e-03 | 70 |
| GO:007137515 | Oral cavity | LP | cellular response to peptide hormone stimulus | 95/4623 | 290/18723 | 1.12e-03 | 9.19e-03 | 95 |
| Page: 1 2 3 4 5 6 7 8 9 10 11 12 13 |
| Pathway ID | Tissue | Disease Stage | Description | Gene Ratio | Bg Ratio | pvalue | p.adjust | qvalue | Count |
| hsa0541530 | Esophagus | HGIN | Diabetic cardiomyopathy | 80/1383 | 203/8465 | 1.35e-15 | 3.38e-14 | 2.69e-14 | 80 |
| hsa05415114 | Esophagus | HGIN | Diabetic cardiomyopathy | 80/1383 | 203/8465 | 1.35e-15 | 3.38e-14 | 2.69e-14 | 80 |
| hsa05415211 | Esophagus | ESCC | Diabetic cardiomyopathy | 146/4205 | 203/8465 | 5.81e-11 | 7.78e-10 | 3.99e-10 | 146 |
| hsa0541538 | Esophagus | ESCC | Diabetic cardiomyopathy | 146/4205 | 203/8465 | 5.81e-11 | 7.78e-10 | 3.99e-10 | 146 |
| hsa0541522 | Liver | HCC | Diabetic cardiomyopathy | 151/4020 | 203/8465 | 2.72e-15 | 1.01e-13 | 5.63e-14 | 151 |
| hsa0541532 | Liver | HCC | Diabetic cardiomyopathy | 151/4020 | 203/8465 | 2.72e-15 | 1.01e-13 | 5.63e-14 | 151 |
| hsa0541529 | Oral cavity | OSCC | Diabetic cardiomyopathy | 131/3704 | 203/8465 | 1.33e-09 | 1.49e-08 | 7.57e-09 | 131 |
| hsa05415113 | Oral cavity | OSCC | Diabetic cardiomyopathy | 131/3704 | 203/8465 | 1.33e-09 | 1.49e-08 | 7.57e-09 | 131 |
| hsa05415210 | Oral cavity | LP | Diabetic cardiomyopathy | 106/2418 | 203/8465 | 6.51e-13 | 1.36e-11 | 8.74e-12 | 106 |
| hsa0541537 | Oral cavity | LP | Diabetic cardiomyopathy | 106/2418 | 203/8465 | 6.51e-13 | 1.36e-11 | 8.74e-12 | 106 |
| Page: 1 |
Top |
Cell-cell communication analysis |
| Identification of potential cell-cell interactions between two cell types and their ligand-receptor pairs for different disease states |
| Ligand | Receptor | LRpair | Pathway | Tissue | Disease Stage |
| Page: 1 |
Top |
Single-cell gene regulatory network inference analysis |
| Find out the significant the regulons (TFs) and the target genes of each regulon across cell types for different disease states |
| TF | Cell Type | Tissue | Disease Stage | Target Gene | RSS | Regulon Activity |
| ∗The dot plots of a searched regulon are shown for all cell subpopulations in each disease state of each tissue based on the regulon specific score inferred using pySCENIC and by calculating the average expression. |
| Page: 1 |
Top |
Somatic mutation of malignant transformation related genes |
| Annotation of somatic variants for genes involved in malignant transformation |
| Hugo Symbol | Variant Class | Variant Classification | dbSNP RS | HGVSc | HGVSp | HGVSp Short | SWISSPROT | BIOTYPE | SIFT | PolyPhen | Tumor Sample Barcode | Tissue | Histology | Sex | Age | Stage | Therapy Types | Drugs | Outcome |
| PDK2 | SNV | Missense_Mutation | novel | c.151N>C | p.Thr51Pro | p.T51P | Q15119 | protein_coding | tolerated(0.27) | benign(0.313) | TCGA-A2-A1FW-01 | Breast | breast invasive carcinoma | Female | <65 | III/IV | Chemotherapy | cytoxan | SD |
| PDK2 | SNV | Missense_Mutation | novel | c.793N>A | p.Glu265Lys | p.E265K | Q15119 | protein_coding | tolerated(0.35) | benign(0.005) | TCGA-A7-A0DB-01 | Breast | breast invasive carcinoma | Female | <65 | I/II | Hormone Therapy | arimidex | SD |
| PDK2 | SNV | Missense_Mutation | c.897N>T | p.Lys299Asn | p.K299N | Q15119 | protein_coding | tolerated(0.07) | benign(0.265) | TCGA-A7-A0DB-01 | Breast | breast invasive carcinoma | Female | <65 | I/II | Hormone Therapy | arimidex | SD | |
| PDK2 | SNV | Missense_Mutation | c.221G>A | p.Arg74Gln | p.R74Q | Q15119 | protein_coding | tolerated(0.4) | benign(0.01) | TCGA-BH-A0HK-01 | Breast | breast invasive carcinoma | Female | >=65 | I/II | Hormone Therapy | arimidex | SD | |
| PDK2 | SNV | Missense_Mutation | c.406N>A | p.Glu136Lys | p.E136K | Q15119 | protein_coding | deleterious(0.03) | possibly_damaging(0.725) | TCGA-D8-A1JA-01 | Breast | breast invasive carcinoma | Female | <65 | III/IV | Chemotherapy | adriamycin | PD | |
| PDK2 | insertion | Frame_Shift_Ins | novel | c.598_599insGACCTAGACCACTCTTCAGAACCCCACAAAGGGAGTC | p.Val200GlyfsTer22 | p.V200Gfs*22 | Q15119 | protein_coding | TCGA-A2-A0D1-01 | Breast | breast invasive carcinoma | Female | >=65 | I/II | Chemotherapy | taxotere | SD | ||
| PDK2 | SNV | Missense_Mutation | rs570482316 | c.962N>T | p.Thr321Met | p.T321M | Q15119 | protein_coding | deleterious(0) | possibly_damaging(0.85) | TCGA-2W-A8YY-01 | Cervix | cervical & endocervical cancer | Female | <65 | I/II | Chemotherapy | cisplatin | CR |
| PDK2 | SNV | Missense_Mutation | c.815N>T | p.Pro272Leu | p.P272L | Q15119 | protein_coding | deleterious(0.01) | possibly_damaging(0.73) | TCGA-EK-A2GZ-01 | Cervix | cervical & endocervical cancer | Female | <65 | III/IV | Unknown | Unknown | SD | |
| PDK2 | SNV | Missense_Mutation | rs752026536 | c.776N>T | p.Ala259Val | p.A259V | Q15119 | protein_coding | deleterious(0) | possibly_damaging(0.902) | TCGA-AA-3950-01 | Colorectum | colon adenocarcinoma | Female | >=65 | I/II | Unknown | Unknown | SD |
| PDK2 | SNV | Missense_Mutation | c.832N>A | p.Ala278Thr | p.A278T | Q15119 | protein_coding | tolerated(0.92) | benign(0.006) | TCGA-AA-A00N-01 | Colorectum | colon adenocarcinoma | Male | >=65 | I/II | Unknown | Unknown | PD |
| Page: 1 2 3 4 |
Top |
Related drugs of malignant transformation related genes |
| Identification of chemicals and drugs interact with genes involved in malignant transfromation |
| (DGIdb 4.0) |
| Entrez ID | Symbol | Category | Interaction Types | Drug Claim Name | Drug Name | PMIDs |
| 5164 | PDK2 | ENZYME, KINASE, SERINE THREONINE KINASE, DRUGGABLE GENOME | inhibitor | 328083464 | ||
| 5164 | PDK2 | ENZYME, KINASE, SERINE THREONINE KINASE, DRUGGABLE GENOME | CPI-613 | |||
| 5164 | PDK2 | ENZYME, KINASE, SERINE THREONINE KINASE, DRUGGABLE GENOME | inhibitor | 328083452 |
| Page: 1 |

Copyright 2023-Present -The University of Texas Health Science Center at Houston |