| Tissue | Expression Dynamics | Abbreviation |
| Endometrium |  | AEH: Atypical endometrial hyperplasia |
| EEC: Endometrioid Cancer |
| Esophagus | 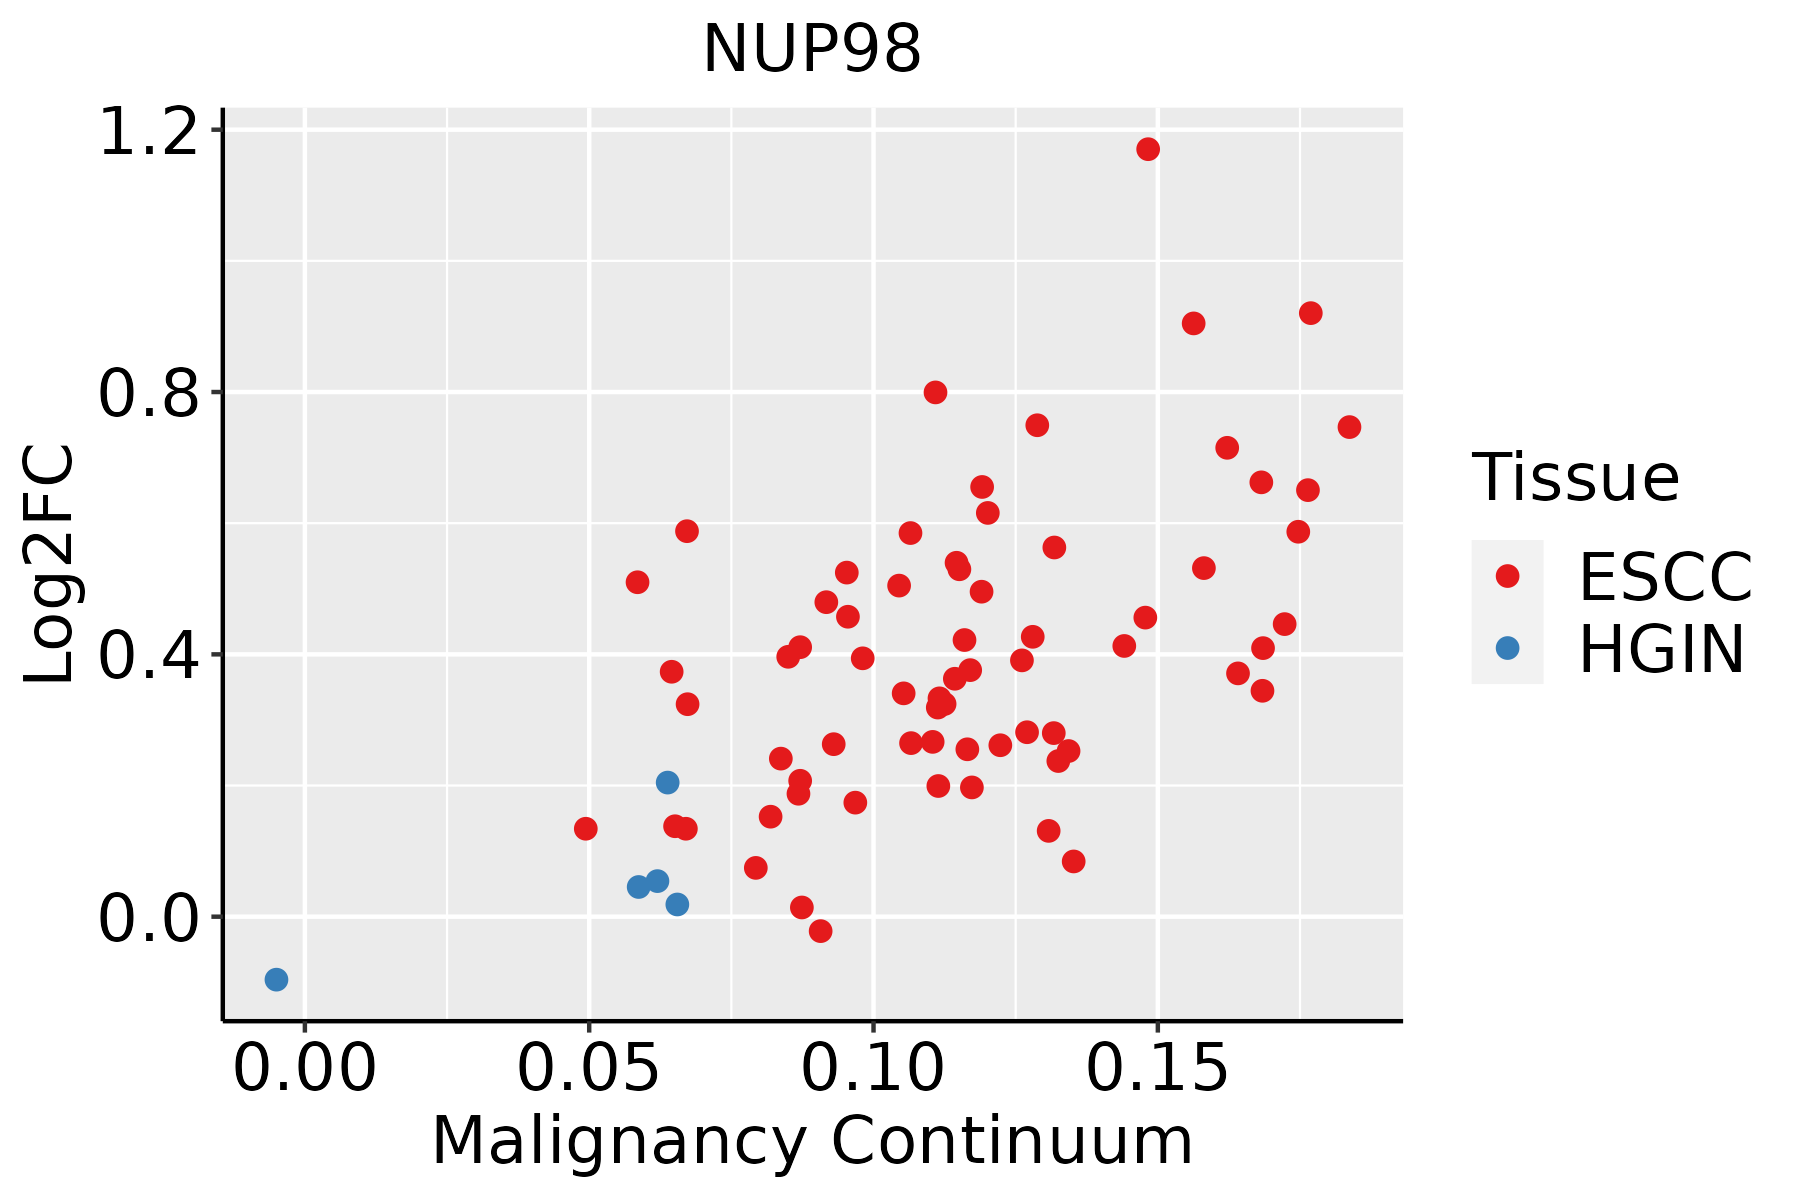 | ESCC: Esophageal squamous cell carcinoma |
| HGIN: High-grade intraepithelial neoplasias |
| LGIN: Low-grade intraepithelial neoplasias |
| Liver | 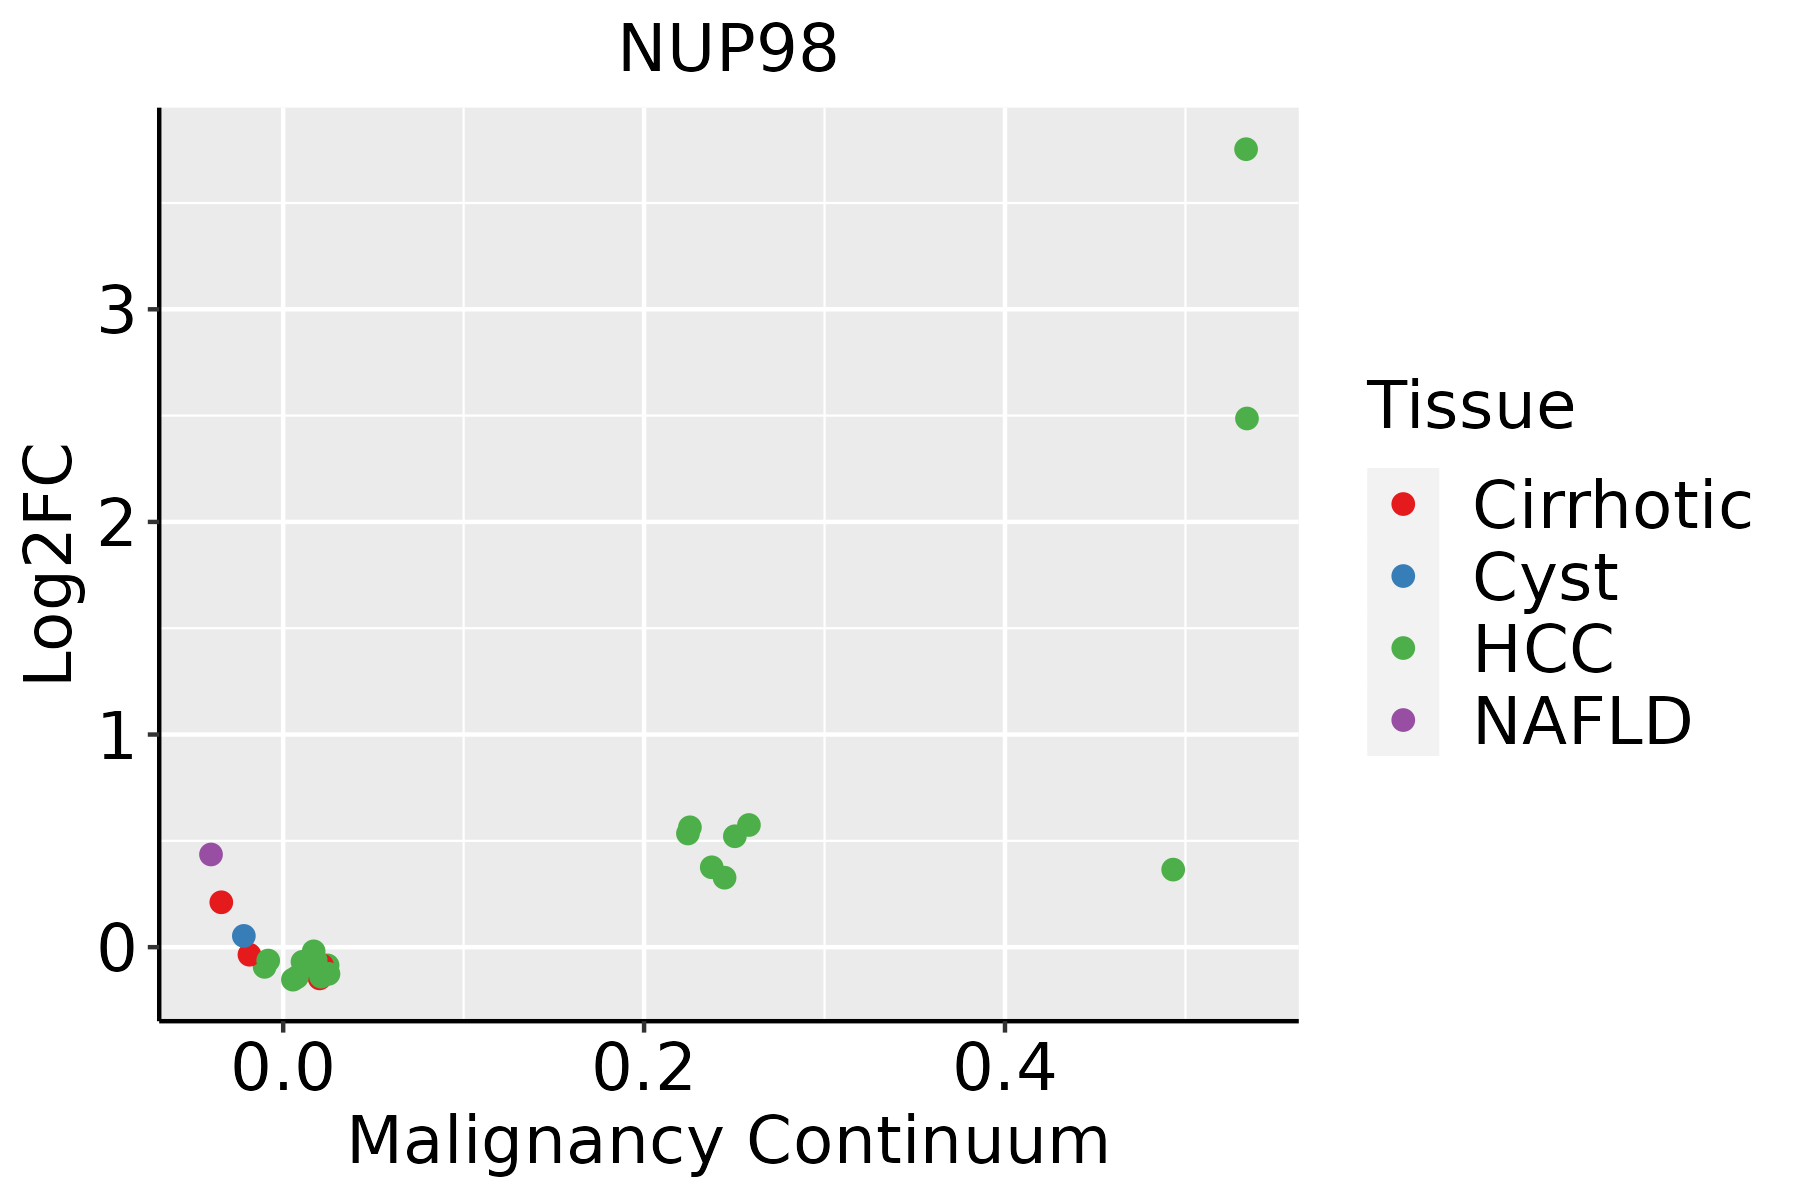 | HCC: Hepatocellular carcinoma |
| NAFLD: Non-alcoholic fatty liver disease |
| Oral Cavity | 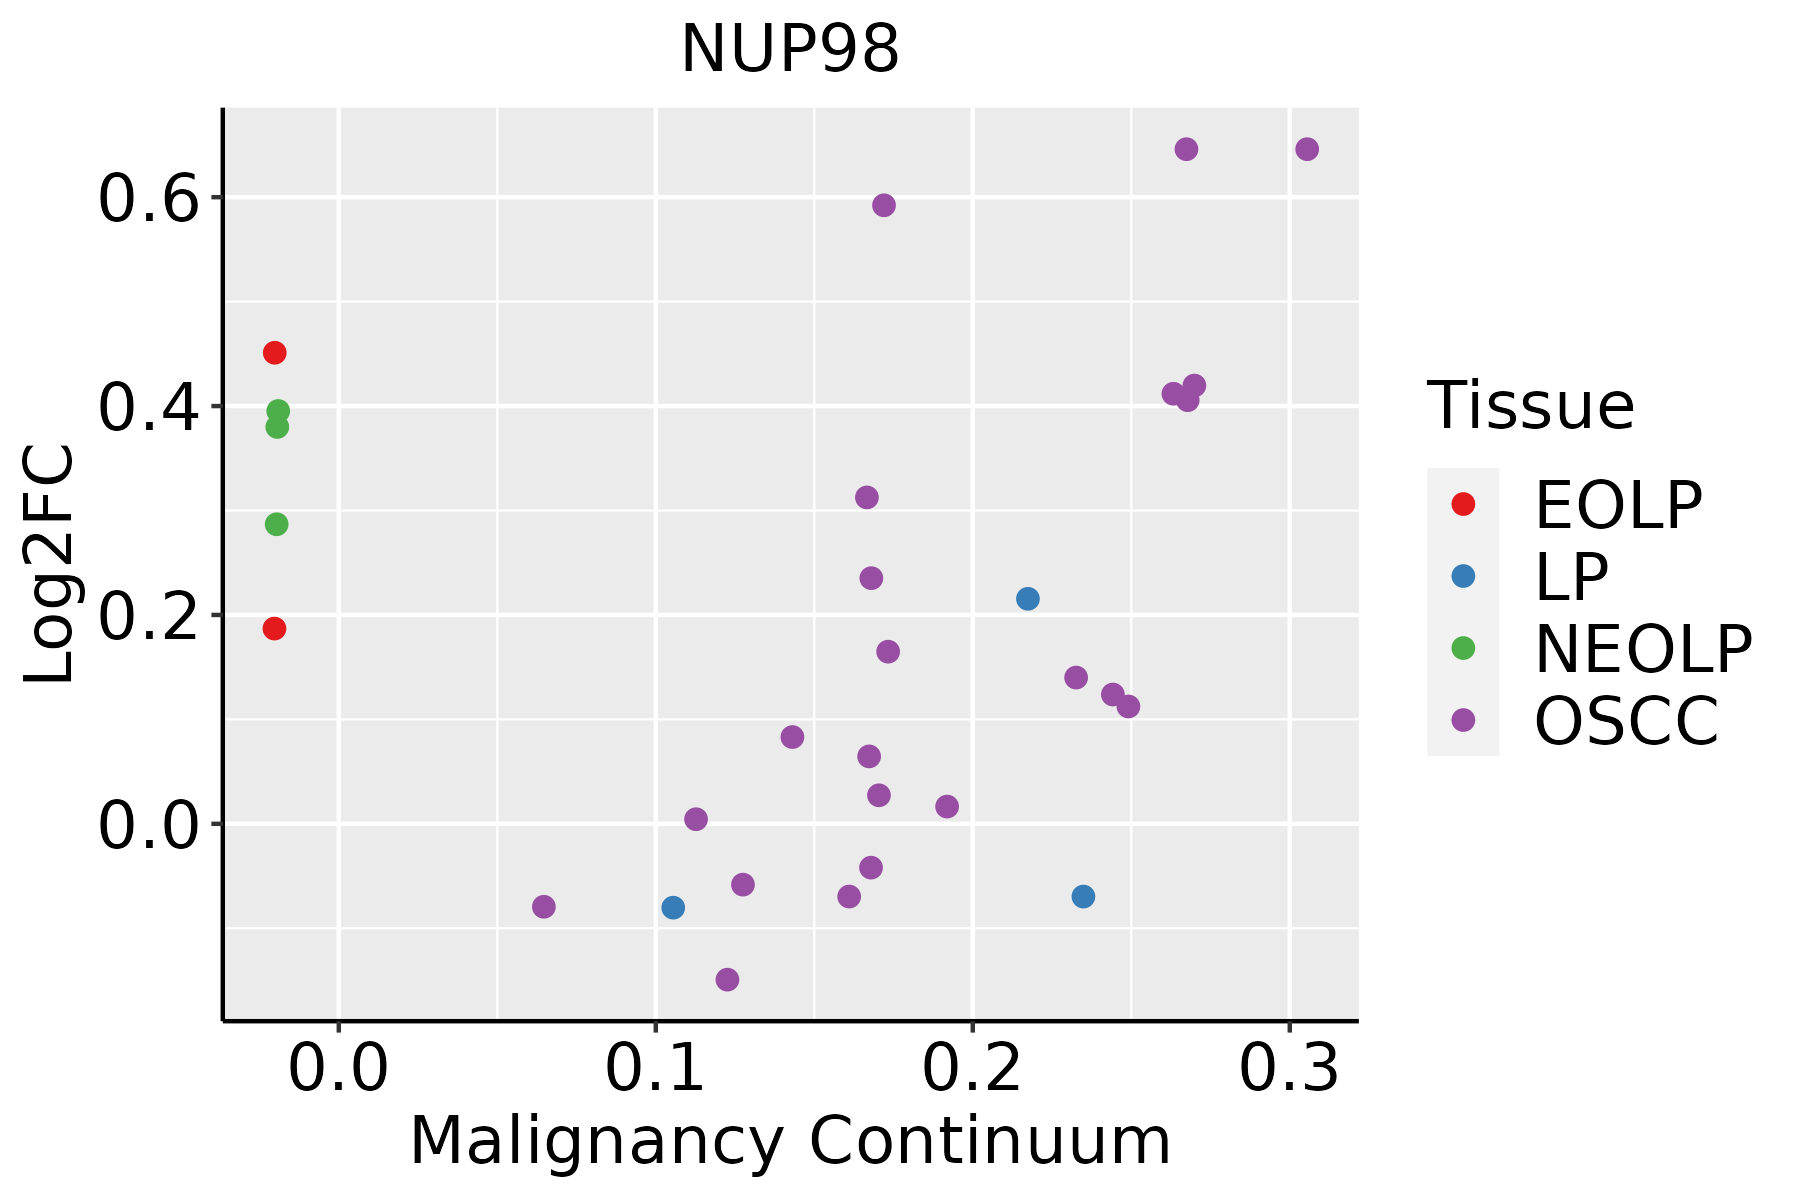 | EOLP: Erosive Oral lichen planus |
| LP: leukoplakia |
| NEOLP: Non-erosive oral lichen planus |
| OSCC: Oral squamous cell carcinoma |
| Prostate |  | BPH: Benign Prostatic Hyperplasia |
| Skin | 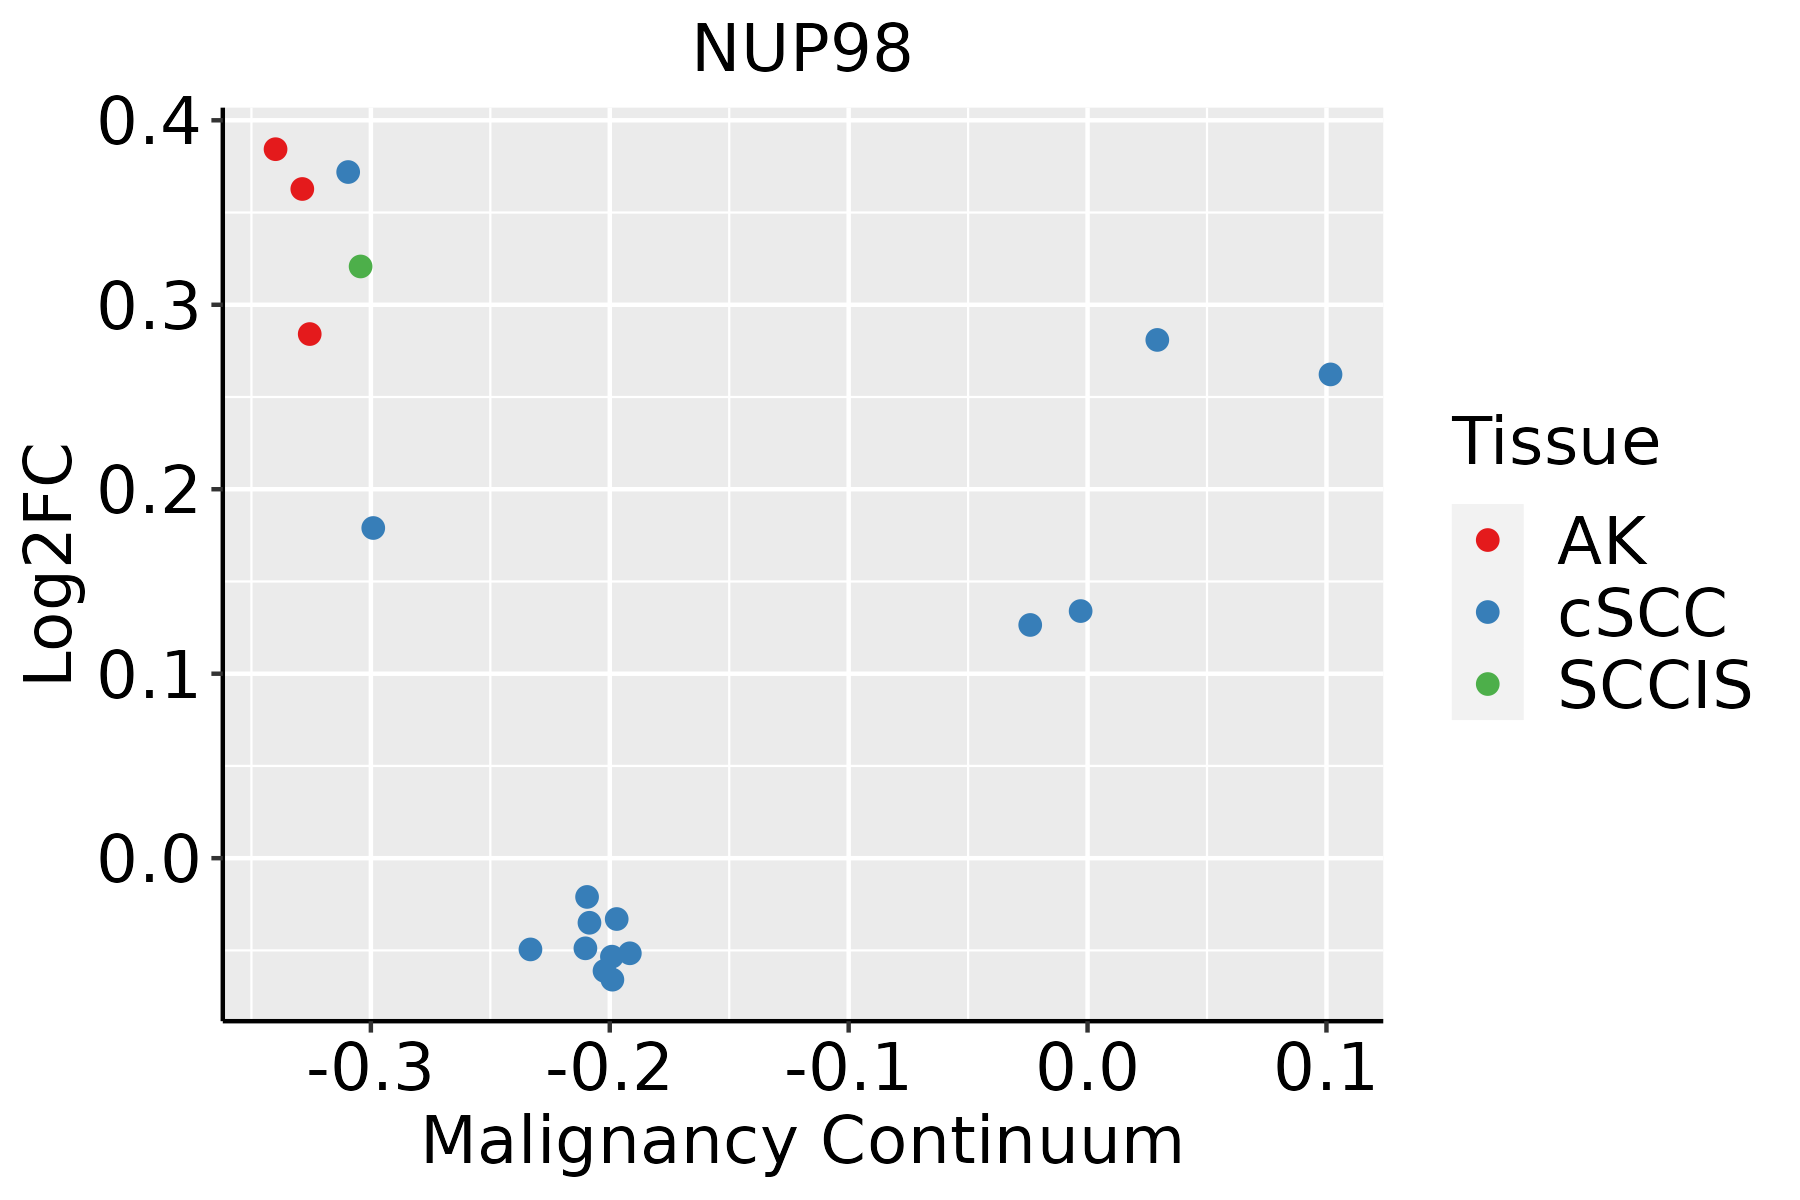 | AK: Actinic keratosis |
| cSCC: Cutaneous squamous cell carcinoma |
| SCCIS:squamous cell carcinoma in situ |
| GO ID | Tissue | Disease Stage | Description | Gene Ratio | Bg Ratio | pvalue | p.adjust | Count |
| GO:005116931 | Oral cavity | NEOLP | nuclear transport | 75/2005 | 301/18723 | 1.56e-12 | 3.20e-10 | 75 |
| GO:003450432 | Oral cavity | NEOLP | protein localization to nucleus | 71/2005 | 290/18723 | 1.49e-11 | 2.21e-09 | 71 |
| GO:003312032 | Oral cavity | NEOLP | positive regulation of RNA splicing | 19/2005 | 37/18723 | 8.91e-10 | 6.61e-08 | 19 |
| GO:000640331 | Oral cavity | NEOLP | RNA localization | 50/2005 | 201/18723 | 8.49e-09 | 4.39e-07 | 50 |
| GO:190331331 | Oral cavity | NEOLP | positive regulation of mRNA metabolic process | 35/2005 | 118/18723 | 1.25e-08 | 5.94e-07 | 35 |
| GO:007259432 | Oral cavity | NEOLP | establishment of protein localization to organelle | 84/2005 | 422/18723 | 1.30e-08 | 6.10e-07 | 84 |
| GO:005065731 | Oral cavity | NEOLP | nucleic acid transport | 40/2005 | 163/18723 | 3.74e-07 | 1.15e-05 | 40 |
| GO:005065831 | Oral cavity | NEOLP | RNA transport | 40/2005 | 163/18723 | 3.74e-07 | 1.15e-05 | 40 |
| GO:005123631 | Oral cavity | NEOLP | establishment of RNA localization | 40/2005 | 166/18723 | 6.24e-07 | 1.82e-05 | 40 |
| GO:001593131 | Oral cavity | NEOLP | nucleobase-containing compound transport | 48/2005 | 222/18723 | 1.51e-06 | 3.77e-05 | 48 |
| GO:004802632 | Oral cavity | NEOLP | positive regulation of mRNA splicing, via spliceosome | 11/2005 | 22/18723 | 4.74e-06 | 1.01e-04 | 11 |
| GO:005068531 | Oral cavity | NEOLP | positive regulation of mRNA processing | 13/2005 | 32/18723 | 1.14e-05 | 2.10e-04 | 13 |
| GO:005102831 | Oral cavity | NEOLP | mRNA transport | 31/2005 | 130/18723 | 1.38e-05 | 2.43e-04 | 31 |
| GO:005117031 | Oral cavity | NEOLP | import into nucleus | 35/2005 | 159/18723 | 2.54e-05 | 3.99e-04 | 35 |
| GO:001703831 | Oral cavity | NEOLP | protein import | 42/2005 | 206/18723 | 2.98e-05 | 4.54e-04 | 42 |
| GO:000660631 | Oral cavity | NEOLP | protein import into nucleus | 34/2005 | 155/18723 | 3.55e-05 | 5.20e-04 | 34 |
| GO:004693113 | Oral cavity | NEOLP | pore complex assembly | 8/2005 | 20/18723 | 6.57e-04 | 5.51e-03 | 8 |
| GO:00069973 | Oral cavity | NEOLP | nucleus organization | 27/2005 | 133/18723 | 7.89e-04 | 6.27e-03 | 27 |
| GO:00069992 | Oral cavity | NEOLP | nuclear pore organization | 6/2005 | 14/18723 | 2.10e-03 | 1.38e-02 | 6 |
| GO:190331116 | Prostate | BPH | regulation of mRNA metabolic process | 111/3107 | 288/18723 | 2.28e-19 | 1.17e-16 | 111 |
| Pathway ID | Tissue | Disease Stage | Description | Gene Ratio | Bg Ratio | pvalue | p.adjust | qvalue | Count |
| hsa0501420 | Endometrium | AEH | Amyotrophic lateral sclerosis | 123/1197 | 364/8465 | 2.17e-22 | 7.82e-21 | 5.72e-21 | 123 |
| hsa05014110 | Endometrium | AEH | Amyotrophic lateral sclerosis | 123/1197 | 364/8465 | 2.17e-22 | 7.82e-21 | 5.72e-21 | 123 |
| hsa0501425 | Endometrium | EEC | Amyotrophic lateral sclerosis | 128/1237 | 364/8465 | 9.83e-24 | 4.04e-22 | 3.01e-22 | 128 |
| hsa0501435 | Endometrium | EEC | Amyotrophic lateral sclerosis | 128/1237 | 364/8465 | 9.83e-24 | 4.04e-22 | 3.01e-22 | 128 |
| hsa0501430 | Esophagus | HGIN | Amyotrophic lateral sclerosis | 140/1383 | 364/8465 | 2.13e-25 | 1.16e-23 | 9.19e-24 | 140 |
| hsa030137 | Esophagus | HGIN | Nucleocytoplasmic transport | 31/1383 | 108/8465 | 8.29e-04 | 7.95e-03 | 6.31e-03 | 31 |
| hsa0516420 | Esophagus | HGIN | Influenza A | 42/1383 | 171/8465 | 3.41e-03 | 2.54e-02 | 2.02e-02 | 42 |
| hsa05014113 | Esophagus | HGIN | Amyotrophic lateral sclerosis | 140/1383 | 364/8465 | 2.13e-25 | 1.16e-23 | 9.19e-24 | 140 |
| hsa0301312 | Esophagus | HGIN | Nucleocytoplasmic transport | 31/1383 | 108/8465 | 8.29e-04 | 7.95e-03 | 6.31e-03 | 31 |
| hsa05164110 | Esophagus | HGIN | Influenza A | 42/1383 | 171/8465 | 3.41e-03 | 2.54e-02 | 2.02e-02 | 42 |
| hsa05014210 | Esophagus | ESCC | Amyotrophic lateral sclerosis | 266/4205 | 364/8465 | 1.31e-20 | 2.20e-18 | 1.13e-18 | 266 |
| hsa0301321 | Esophagus | ESCC | Nucleocytoplasmic transport | 89/4205 | 108/8465 | 1.20e-12 | 2.37e-11 | 1.21e-11 | 89 |
| hsa0516425 | Esophagus | ESCC | Influenza A | 122/4205 | 171/8465 | 5.01e-09 | 4.79e-08 | 2.45e-08 | 122 |
| hsa0501438 | Esophagus | ESCC | Amyotrophic lateral sclerosis | 266/4205 | 364/8465 | 1.31e-20 | 2.20e-18 | 1.13e-18 | 266 |
| hsa0301331 | Esophagus | ESCC | Nucleocytoplasmic transport | 89/4205 | 108/8465 | 1.20e-12 | 2.37e-11 | 1.21e-11 | 89 |
| hsa0516435 | Esophagus | ESCC | Influenza A | 122/4205 | 171/8465 | 5.01e-09 | 4.79e-08 | 2.45e-08 | 122 |
| hsa0501414 | Liver | Cirrhotic | Amyotrophic lateral sclerosis | 187/2530 | 364/8465 | 1.56e-18 | 6.50e-17 | 4.01e-17 | 187 |
| hsa0516410 | Liver | Cirrhotic | Influenza A | 66/2530 | 171/8465 | 8.56e-03 | 2.91e-02 | 1.79e-02 | 66 |
| hsa0501415 | Liver | Cirrhotic | Amyotrophic lateral sclerosis | 187/2530 | 364/8465 | 1.56e-18 | 6.50e-17 | 4.01e-17 | 187 |
| hsa0516411 | Liver | Cirrhotic | Influenza A | 66/2530 | 171/8465 | 8.56e-03 | 2.91e-02 | 1.79e-02 | 66 |
| Hugo Symbol | Variant Class | Variant Classification | dbSNP RS | HGVSc | HGVSp | HGVSp Short | SWISSPROT | BIOTYPE | SIFT | PolyPhen | Tumor Sample Barcode | Tissue | Histology | Sex | Age | Stage | Therapy Types | Drugs | Outcome |
| NUP98 | SNV | Missense_Mutation | novel | c.4906C>A | p.His1636Asn | p.H1636N | P52948 | protein_coding | tolerated(0.08) | probably_damaging(0.958) | TCGA-A2-A25A-01 | Breast | breast invasive carcinoma | Female | <65 | I/II | Unspecific | Cytoxan | SD |
| NUP98 | SNV | Missense_Mutation | | c.410N>G | p.Ser137Cys | p.S137C | P52948 | protein_coding | deleterious(0) | probably_damaging(0.983) | TCGA-A8-A08L-01 | Breast | breast invasive carcinoma | Female | >=65 | III/IV | Unknown | Unknown | SD |
| NUP98 | SNV | Missense_Mutation | | c.2317G>A | p.Asp773Asn | p.D773N | P52948 | protein_coding | deleterious(0) | benign(0.103) | TCGA-A8-A09G-01 | Breast | breast invasive carcinoma | Female | >=65 | III/IV | Unknown | Unknown | SD |
| NUP98 | SNV | Missense_Mutation | | c.4660N>T | p.His1554Tyr | p.H1554Y | P52948 | protein_coding | deleterious(0) | probably_damaging(0.995) | TCGA-A8-A09Z-01 | Breast | breast invasive carcinoma | Female | >=65 | I/II | Unknown | Unknown | SD |
| NUP98 | SNV | Missense_Mutation | | c.4966G>A | p.Asp1656Asn | p.D1656N | P52948 | protein_coding | tolerated(0.3) | possibly_damaging(0.862) | TCGA-AC-A23H-01 | Breast | breast invasive carcinoma | Female | >=65 | I/II | Unknown | Unknown | PD |
| NUP98 | SNV | Missense_Mutation | | c.1211G>A | p.Gly404Glu | p.G404E | P52948 | protein_coding | deleterious(0.01) | probably_damaging(1) | TCGA-AC-A23H-01 | Breast | breast invasive carcinoma | Female | >=65 | I/II | Unknown | Unknown | PD |
| NUP98 | SNV | Missense_Mutation | novel | c.988N>A | p.Leu330Ile | p.L330I | P52948 | protein_coding | tolerated(0.16) | probably_damaging(0.998) | TCGA-AN-A046-01 | Breast | breast invasive carcinoma | Female | >=65 | I/II | Unknown | Unknown | SD |
| NUP98 | SNV | Missense_Mutation | rs752419423 | c.3307N>T | p.Arg1103Cys | p.R1103C | P52948 | protein_coding | deleterious(0.02) | benign(0.398) | TCGA-AN-A0AK-01 | Breast | breast invasive carcinoma | Female | >=65 | I/II | Unknown | Unknown | SD |
| NUP98 | SNV | Missense_Mutation | novel | c.3459G>T | p.Gln1153His | p.Q1153H | P52948 | protein_coding | tolerated(0.08) | benign(0.001) | TCGA-AR-A2LL-01 | Breast | breast invasive carcinoma | Female | >=65 | I/II | Hormone Therapy | tamoxiphen | SD |
| NUP98 | SNV | Missense_Mutation | | c.4571N>T | p.Ser1524Leu | p.S1524L | P52948 | protein_coding | tolerated(0.07) | benign(0.202) | TCGA-BH-A18J-01 | Breast | breast invasive carcinoma | Female | <65 | III/IV | Unknown | Unknown | PD |


