Schematic overview of the cellular and molecular mechanisms involved in the cancer progression, including the proposed cellular and molecular mechanisms in cancer cells trajectory. AT1: alveolar type 1 cells; AT2: alveolar type 2 cells; AAH: atypical adenomatous hyperplasia; AIS: adenocarcinoma in situ; MIA: minimally invasive adenocarcinoma; IA: invasive adenocarcinoma; EMT: epithelial-mesenchymal transition

Home

Download

Statistics

Help

Contact

Center for Computational Systems Medicine
leaf

Gene summary

leaf

Malignant transformation analysis

leaf

Malignant transformation related pathway analysis

leaf

Cell-cell communication analysis

leaf

Single-cell gene regulatory network inference analysis

leaf

Somatic mutation of malignant transformation related genes

leaf

Related drugs of malignant transformation related genes

Gene: NONO

Gene summary for NONO

check button Gene summary.

Gene informationSpeciesHuman
Gene symbol

NONO

Gene ID

4841

Gene namenon-POU domain containing octamer binding
Gene AliasMRXS34
CytomapXq13.1
Gene Typeprotein-coding
GO ID

GO:0002218

UniProtAcc

A0A0S2Z4Z9


Top

Malignant transformation analysis

check button Identification of the aberrant gene expression in precancerous and cancerous lesions by comparing the gene expression of stem-like cells in diseased tissues with normal stem cells
check button Malignant transformation involving gene list.
Entrez IDSymbolReplicatesSpeciesOrganTissueAdj P-valueLog2FCMalignancy
4841NONOHTA11_3410_2000001011HumanColorectumAD1.23e-134.33e-010.0155
4841NONOHTA11_2487_2000001011HumanColorectumSER9.46e-034.21e-01-0.1808
4841NONOHTA11_2951_2000001011HumanColorectumAD4.35e-066.96e-010.0216
4841NONOHTA11_1938_2000001011HumanColorectumAD4.14e-127.21e-01-0.0811
4841NONOHTA11_78_2000001011HumanColorectumAD1.23e-155.48e-01-0.1088
4841NONOHTA11_347_2000001011HumanColorectumAD1.65e-217.20e-01-0.1954
4841NONOHTA11_411_2000001011HumanColorectumSER2.90e-027.13e-01-0.2602
4841NONOHTA11_83_2000001011HumanColorectumSER1.13e-022.55e-01-0.1526
4841NONOHTA11_696_2000001011HumanColorectumAD1.05e-155.04e-01-0.1464
4841NONOHTA11_866_2000001011HumanColorectumAD3.72e-063.65e-01-0.1001
4841NONOHTA11_1391_2000001011HumanColorectumAD3.04e-249.97e-01-0.059
4841NONOHTA11_546_2000001011HumanColorectumAD5.56e-106.28e-01-0.0842
4841NONOHTA11_7862_2000001011HumanColorectumAD9.41e-127.72e-01-0.0179
4841NONOHTA11_866_3004761011HumanColorectumAD3.85e-391.18e+000.096
4841NONOHTA11_4255_2000001011HumanColorectumSER3.21e-077.89e-010.0446
4841NONOHTA11_8622_2000001021HumanColorectumSER2.25e-119.43e-010.0528
4841NONOHTA11_7663_2000001011HumanColorectumSER9.88e-129.21e-010.0131
4841NONOHTA11_10623_2000001011HumanColorectumAD1.22e-087.20e-01-0.0177
4841NONOHTA11_6801_2000001011HumanColorectumSER3.65e-141.17e+000.0171
4841NONOHTA11_10711_2000001011HumanColorectumAD2.80e-075.53e-010.0338
Page: 1 2 3 4 5 6 7 8 9 

check button Transcriptomic changes along malignancy continuum.
TissueExpression DynamicsAbbreviation
Colorectum (GSE201348)The image shows the transcriptomic changes along malignancy continuum.log2FC in expression of this searched gene in stem-like cells from each diseased tissue sample relative to stem-like cells in normal samples in each tissue plotted against the malignancy continuum. Samples are colored based on if they are from different disease stage.FAP: Familial adenomatous polyposis
CRC: Colorectal cancer
Colorectum (HTA11)The image shows the transcriptomic changes along malignancy continuum.log2FC in expression of this searched gene in stem-like cells from each diseased tissue sample relative to stem-like cells in normal samples in each tissue plotted against the malignancy continuum. Samples are colored based on if they are from different disease stage.AD: Adenomas
SER: Sessile serrated lesions
MSI-H: Microsatellite-high colorectal cancer
MSS: Microsatellite stable colorectal cancer
EsophagusThe image shows the transcriptomic changes along malignancy continuum.log2FC in expression of this searched gene in stem-like cells from each diseased tissue sample relative to stem-like cells in normal samples in each tissue plotted against the malignancy continuum. Samples are colored based on if they are from different disease stage.ESCC: Esophageal squamous cell carcinoma
HGIN: High-grade intraepithelial neoplasias
LGIN: Low-grade intraepithelial neoplasias
LiverThe image shows the transcriptomic changes along malignancy continuum.log2FC in expression of this searched gene in stem-like cells from each diseased tissue sample relative to stem-like cells in normal samples in each tissue plotted against the malignancy continuum. Samples are colored based on if they are from different disease stage.HCC: Hepatocellular carcinoma
NAFLD: Non-alcoholic fatty liver disease
Oral CavityThe image shows the transcriptomic changes along malignancy continuum.log2FC in expression of this searched gene in stem-like cells from each diseased tissue sample relative to stem-like cells in normal samples in each tissue plotted against the malignancy continuum. Samples are colored based on if they are from different disease stage.EOLP: Erosive Oral lichen planus
LP: leukoplakia
NEOLP: Non-erosive oral lichen planus
OSCC: Oral squamous cell carcinoma
ProstateThe image shows the transcriptomic changes along malignancy continuum.log2FC in expression of this searched gene in stem-like cells from each diseased tissue sample relative to stem-like cells in normal samples in each tissue plotted against the malignancy continuum. Samples are colored based on if they are from different disease stage.
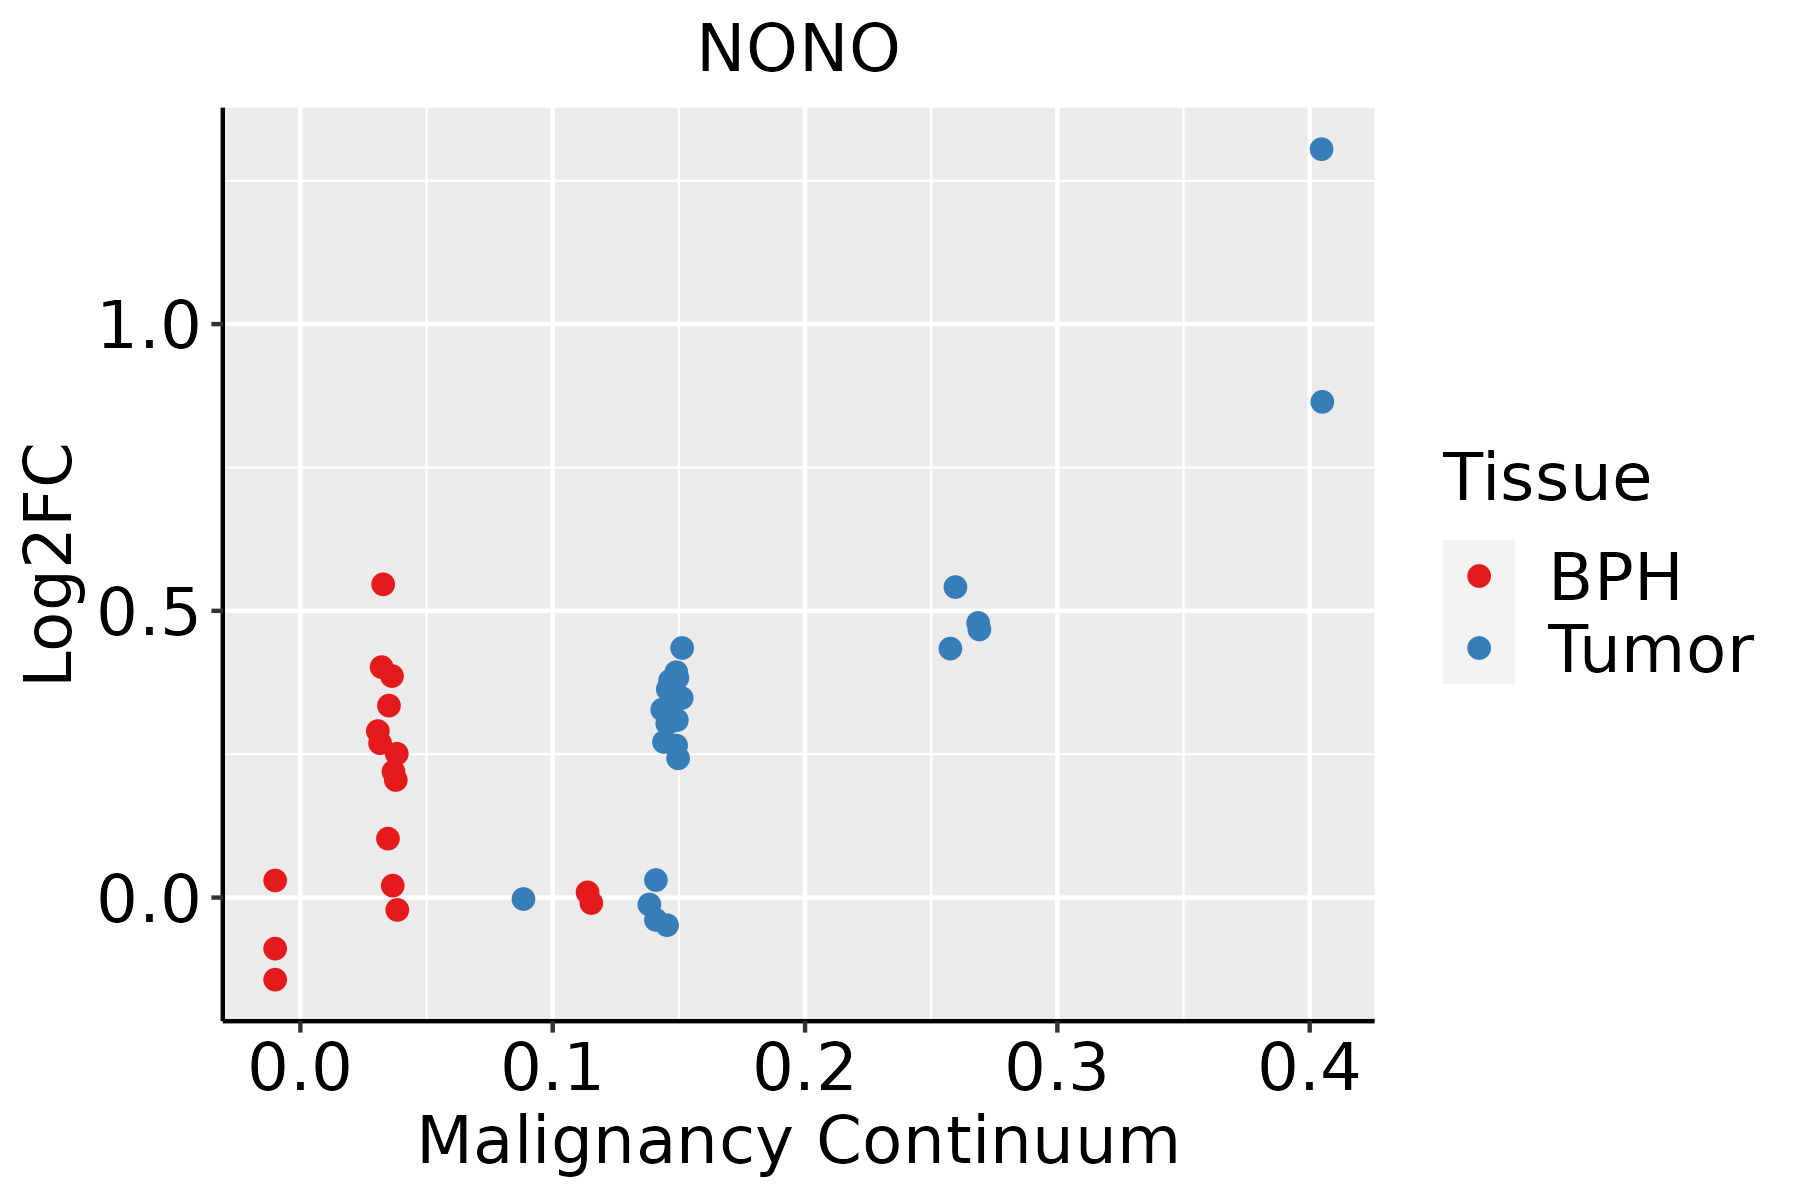
BPH: Benign Prostatic Hyperplasia
SkinThe image shows the transcriptomic changes along malignancy continuum.log2FC in expression of this searched gene in stem-like cells from each diseased tissue sample relative to stem-like cells in normal samples in each tissue plotted against the malignancy continuum. Samples are colored based on if they are from different disease stage.
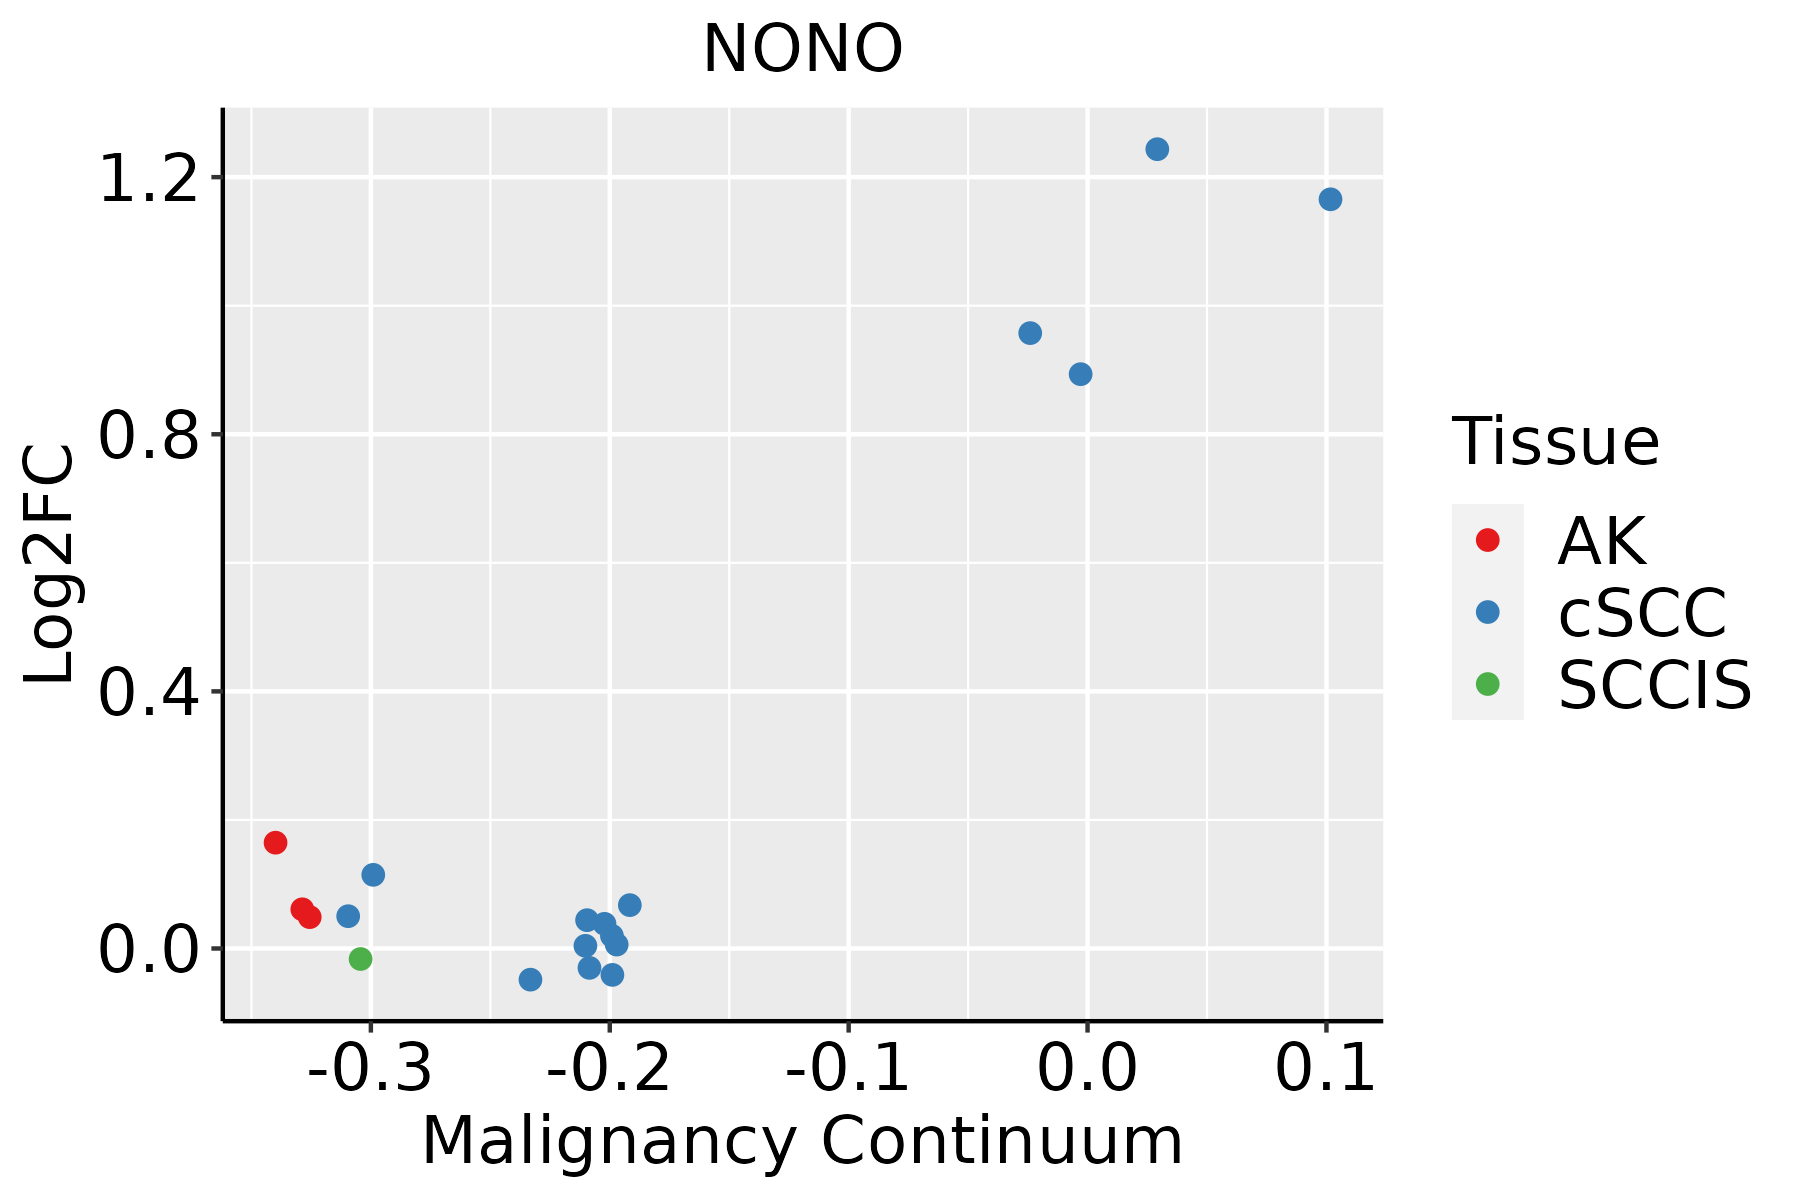
AK: Actinic keratosis
cSCC: Cutaneous squamous cell carcinoma
SCCIS:squamous cell carcinoma in situ
ThyroidThe image shows the transcriptomic changes along malignancy continuum.log2FC in expression of this searched gene in stem-like cells from each diseased tissue sample relative to stem-like cells in normal samples in each tissue plotted against the malignancy continuum. Samples are colored based on if they are from different disease stage.
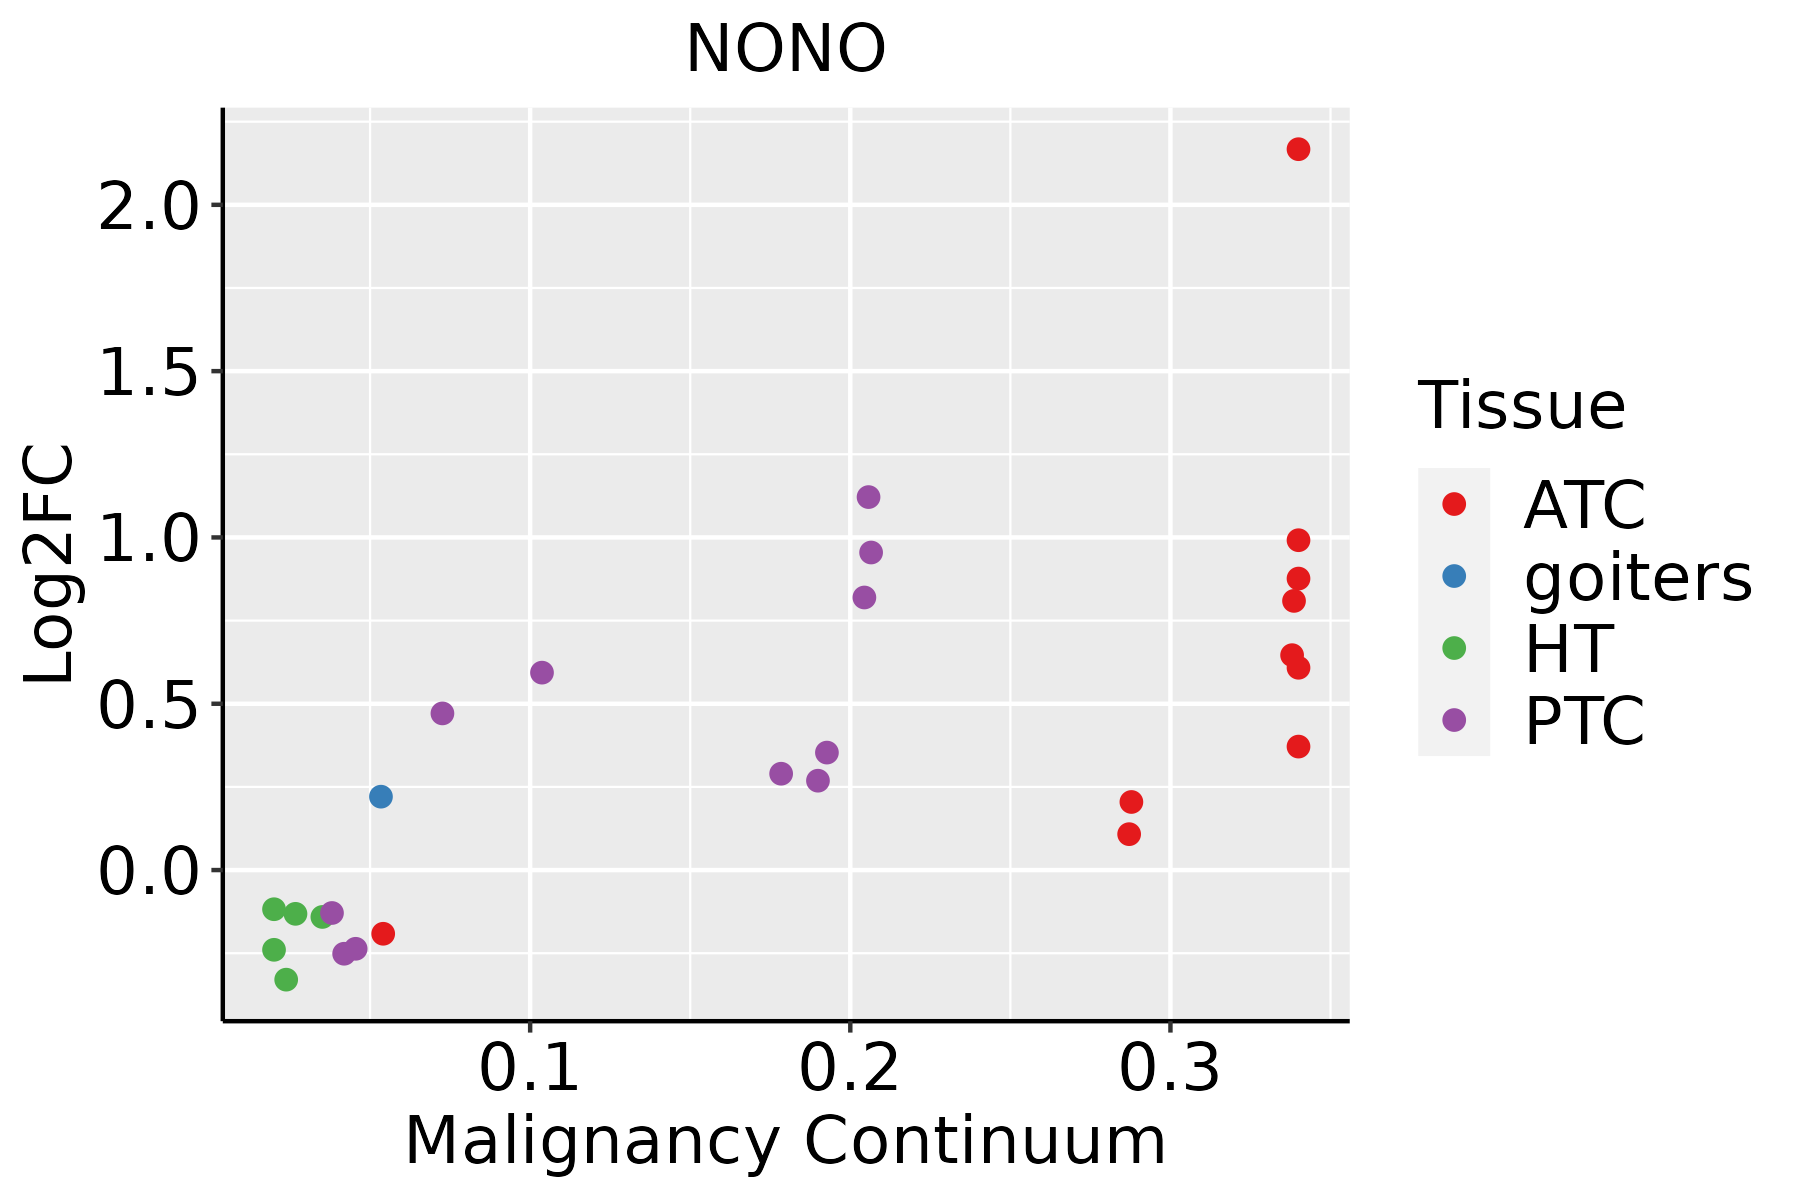
ATC: Anaplastic thyroid cancer
HT: Hashimoto's thyroiditis
PTC: Papillary thyroid cancer
∗log2FC in expression of this searched gene in stem-like cells from each diseased tissue sample relative to stem-like cells in normal samples in each tissue plotted against the malignancy continuum. Samples are colored based on if they are from different disease stage.

Top

Malignant transformation related pathway analysis

check buttonFind out the enriched GO biological processes and KEGG pathways involved in transition from healthy to precancer to cancer
check button Figure of enriched GO biological processes.
TissueDisease StageEnriched GO biological Processes
ColorectumADGO analysis - Figure of enriched GO biological processes: Top 15 enriched GO BP terms are showed in the bar plot of each disease state in each tissue. Each row represents a significant GO biological process which is colored according to the -log10(p.adjust).
ColorectumSERGO analysis - Figure of enriched GO biological processes: Top 15 enriched GO BP terms are showed in the bar plot of each disease state in each tissue. Each row represents a significant GO biological process which is colored according to the -log10(p.adjust).
ColorectumMSSGO analysis - Figure of enriched GO biological processes: Top 15 enriched GO BP terms are showed in the bar plot of each disease state in each tissue. Each row represents a significant GO biological process which is colored according to the -log10(p.adjust).
ColorectumMSI-HGO analysis - Figure of enriched GO biological processes: Top 15 enriched GO BP terms are showed in the bar plot of each disease state in each tissue. Each row represents a significant GO biological process which is colored according to the -log10(p.adjust).
ColorectumFAPGO analysis - Figure of enriched GO biological processes: Top 15 enriched GO BP terms are showed in the bar plot of each disease state in each tissue. Each row represents a significant GO biological process which is colored according to the -log10(p.adjust).
∗Top 15 enriched GO BP terms are showed in the bar plot of each disease state in each tissue. Each row represents a significant GO biological process which is colored according to the -log10(p.adjust).
Page: 1 2 3 4 5 6 7 8 9 

check button Enriched GO biological processes.
GO IDTissueDisease StageDescriptionGene RatioBg Ratiopvaluep.adjustCount
GO:000762321LiverHCCcircadian rhythm117/7958210/187237.29e-056.54e-04117
GO:00028312LiverHCCregulation of response to biotic stimulus173/7958327/187238.55e-057.48e-04173
GO:000863112LiverHCCintrinsic apoptotic signaling pathway in response to oxidative stress32/795845/187239.63e-058.34e-0432
GO:004352312LiverHCCregulation of neuron apoptotic process117/7958212/187231.25e-041.03e-03117
GO:190217512LiverHCCregulation of oxidative stress-induced intrinsic apoptotic signaling pathway22/795829/187232.73e-041.98e-0322
GO:004851121LiverHCCrhythmic process156/7958298/187233.54e-042.46e-03156
GO:190121512LiverHCCnegative regulation of neuron death113/7958208/187233.68e-042.54e-03113
GO:003647511LiverHCCneuron death in response to oxidative stress22/795831/187231.27e-036.92e-0322
GO:003647312LiverHCCcell death in response to oxidative stress55/795895/187231.76e-039.12e-0355
GO:00450881LiverHCCregulation of innate immune response113/7958218/187233.27e-031.50e-02113
GO:190217612LiverHCCnegative regulation of oxidative stress-induced intrinsic apoptotic signaling pathway15/795820/187233.31e-031.51e-0215
GO:0002218LiverHCCactivation of innate immune response32/795852/187234.35e-031.89e-0232
GO:190288212LiverHCCregulation of response to oxidative stress55/795898/187234.46e-031.93e-0255
GO:190040712LiverHCCregulation of cellular response to oxidative stress50/795889/187236.33e-032.58e-0250
GO:004275211LiverHCCregulation of circadian rhythm65/7958121/187238.25e-033.24e-0265
GO:190320112LiverHCCregulation of oxidative stress-induced cell death42/795874/187239.32e-033.57e-0242
GO:190320311LiverHCCregulation of oxidative stress-induced neuron death18/795827/187239.75e-033.66e-0218
GO:000838020Oral cavityOSCCRNA splicing308/7305434/187232.43e-427.70e-39308
GO:200123320Oral cavityOSCCregulation of apoptotic signaling pathway242/7305356/187236.66e-293.24e-26242
GO:009719320Oral cavityOSCCintrinsic apoptotic signaling pathway202/7305288/187234.64e-271.73e-24202
Page: 1 2 3 4 5 6 7 8 9 10 11 12 13 14 15 16 17 18 19 20 21 22 

check button Enriched KEGG pathways.
Pathway IDTissueDisease StageDescriptionGene RatioBg Ratiopvaluep.adjustqvalueCount
Page: 1 

Top

Cell-cell communication analysis

check buttonIdentification of potential cell-cell interactions between two cell types and their ligand-receptor pairs for different disease states
LigandReceptorLRpairPathwayTissueDisease Stage
Page: 1 

Top

Single-cell gene regulatory network inference analysis

check buttonFind out the significant the regulons (TFs) and the target genes of each regulon across cell types for different disease states
TFCell TypeTissueDisease StageTarget GeneRSSRegulon Activity
NONOSTMLiverCirrhoticMFSD9,HNRNPU,LCMT1, etc.4.68e-01The dot plots of a searched regulon are shown for all cell subpopulations in each disease state of each tissue based on the regulon specific score inferred using pySCENIC and by calculating the average expression.
∗The dot plots of a searched regulon are shown for all cell subpopulations in each disease state of each tissue based on the regulon specific score inferred using pySCENIC and by calculating the average expression.
Page: 1 

Top

Somatic mutation of malignant transformation related genes

check buttonAnnotation of somatic variants for genes involved in malignant transformation
Hugo SymbolVariant ClassVariant ClassificationdbSNP RSHGVScHGVSpHGVSp ShortSWISSPROTBIOTYPESIFTPolyPhenTumor Sample BarcodeTissueHistologySexAgeStageTherapy TypesDrugsOutcome
NONOSNVMissense_Mutationc.292N>Ap.Gly98Argp.G98RQ15233protein_codingdeleterious(0.01)possibly_damaging(0.768)TCGA-A2-A259-01Breastbreast invasive carcinomaFemale>=65I/IIHormone TherapyarimidexSD
NONOSNVMissense_Mutationc.911N>Ap.Arg304Hisp.R304HQ15233protein_codingtolerated(0.39)benign(0.003)TCGA-D8-A1JN-01Breastbreast invasive carcinomaFemale>=65III/IVHormone TherapyanastrozolumSD
NONOSNVMissense_Mutationnovelc.1081G>Ap.Glu361Lysp.E361KQ15233protein_codingdeleterious(0)possibly_damaging(0.587)TCGA-EW-A1J5-01Breastbreast invasive carcinomaFemale<65I/IIChemotherapyadriamycinSD
NONOinsertionFrame_Shift_Insnovelc.853_854insAp.Val285AspfsTer10p.V285Dfs*10Q15233protein_codingTCGA-A2-A0CT-01Breastbreast invasive carcinomaFemale>=65I/IIChemotherapycytoxanSD
NONOinsertionIn_Frame_Insnovelc.854_855insCTCp.Val285_Asp286insSerp.V285_D286insSQ15233protein_codingTCGA-A2-A0CT-01Breastbreast invasive carcinomaFemale>=65I/IIChemotherapycytoxanSD
NONOinsertionFrame_Shift_Insnovelc.1405_1406insACTTTAAGGGGGTGACATATATGTCTTACTTAp.Arg469HisfsTer26p.R469Hfs*26Q15233protein_codingTCGA-A7-A0D9-01Breastbreast invasive carcinomaFemale<65I/IIChemotherapytaxotereSD
NONOdeletionFrame_Shift_Delc.1268delGp.Gly423GlufsTer5p.G423Efs*5Q15233protein_codingTCGA-EW-A2FV-01Breastbreast invasive carcinomaFemale<65III/IVChemotherapydocetaxelSD
NONOSNVMissense_Mutationnovelc.523N>Cp.Glu175Glnp.E175QQ15233protein_codingdeleterious(0)probably_damaging(0.995)TCGA-C5-A8XJ-01Cervixcervical & endocervical cancerFemale>=65I/IIChemotherapycisplatinSD
NONOSNVMissense_Mutationnovelc.265N>Ap.Glu89Lysp.E89KQ15233protein_codingdeleterious(0)benign(0.021)TCGA-EX-A8YF-01Cervixcervical & endocervical cancerFemale<65I/IIUnknownUnknownPD
NONOSNVMissense_Mutationc.694N>Cp.Asp232Hisp.D232HQ15233protein_codingdeleterious(0)probably_damaging(0.985)TCGA-LP-A4AV-01Cervixcervical & endocervical cancerFemale<65I/IIUnknownUnknownSD
Page: 1 2 3 4 5 6 7 8 

Top

Related drugs of malignant transformation related genes

check buttonIdentification of chemicals and drugs interact with genes involved in malignant transfromation
(DGIdb 4.0)
Entrez IDSymbolCategoryInteraction TypesDrug Claim NameDrug NamePMIDs
Page: 1