| Tissue | Expression Dynamics | Abbreviation |
| Breast |  | IDC: Invasive ductal carcinoma |
| DCIS: Ductal carcinoma in situ |
| Precancer(BRCA1-mut): Precancerous lesion from BRCA1 mutation carriers |
| Cervix |  | CC: Cervix cancer |
| HSIL_HPV: HPV-infected high-grade squamous intraepithelial lesions |
| N_HPV: HPV-infected normal cervix |
| Endometrium | 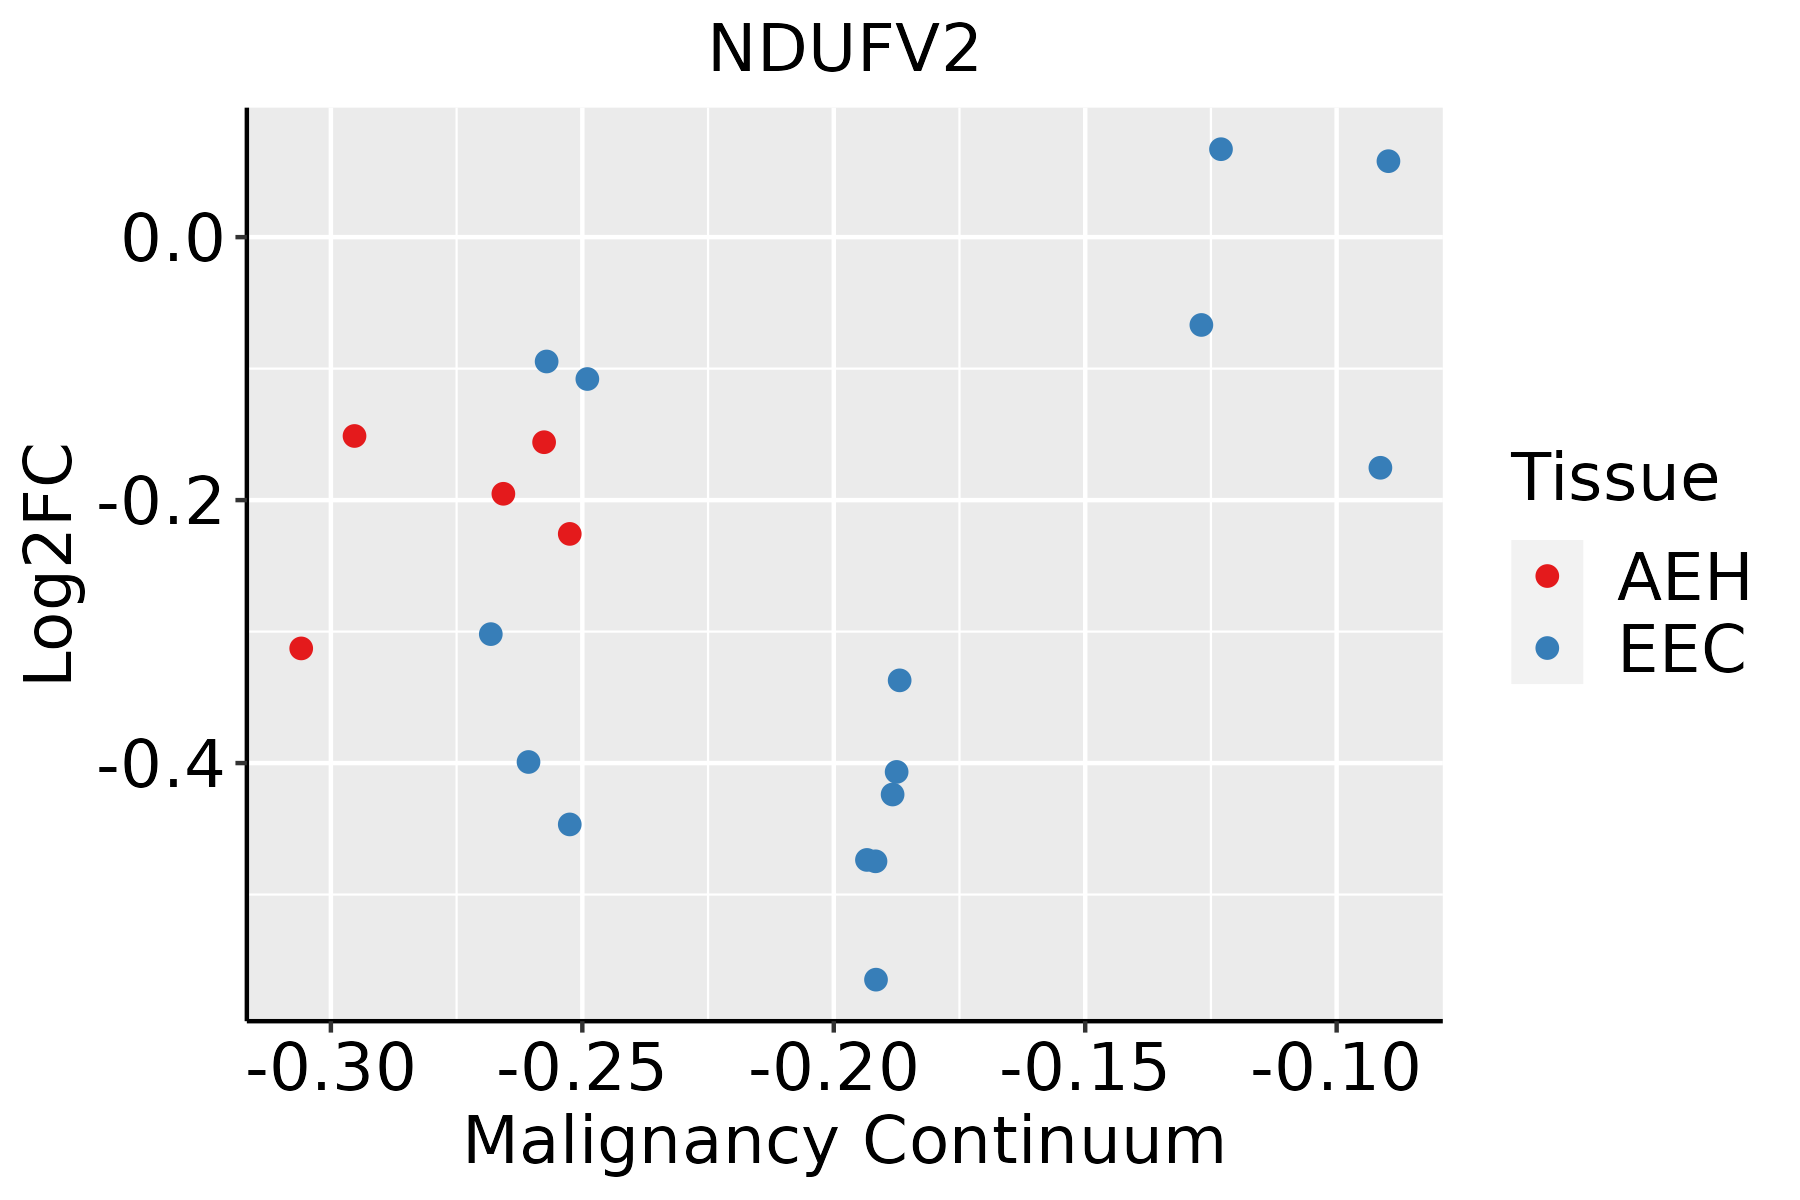 | AEH: Atypical endometrial hyperplasia |
| EEC: Endometrioid Cancer |
| Esophagus | 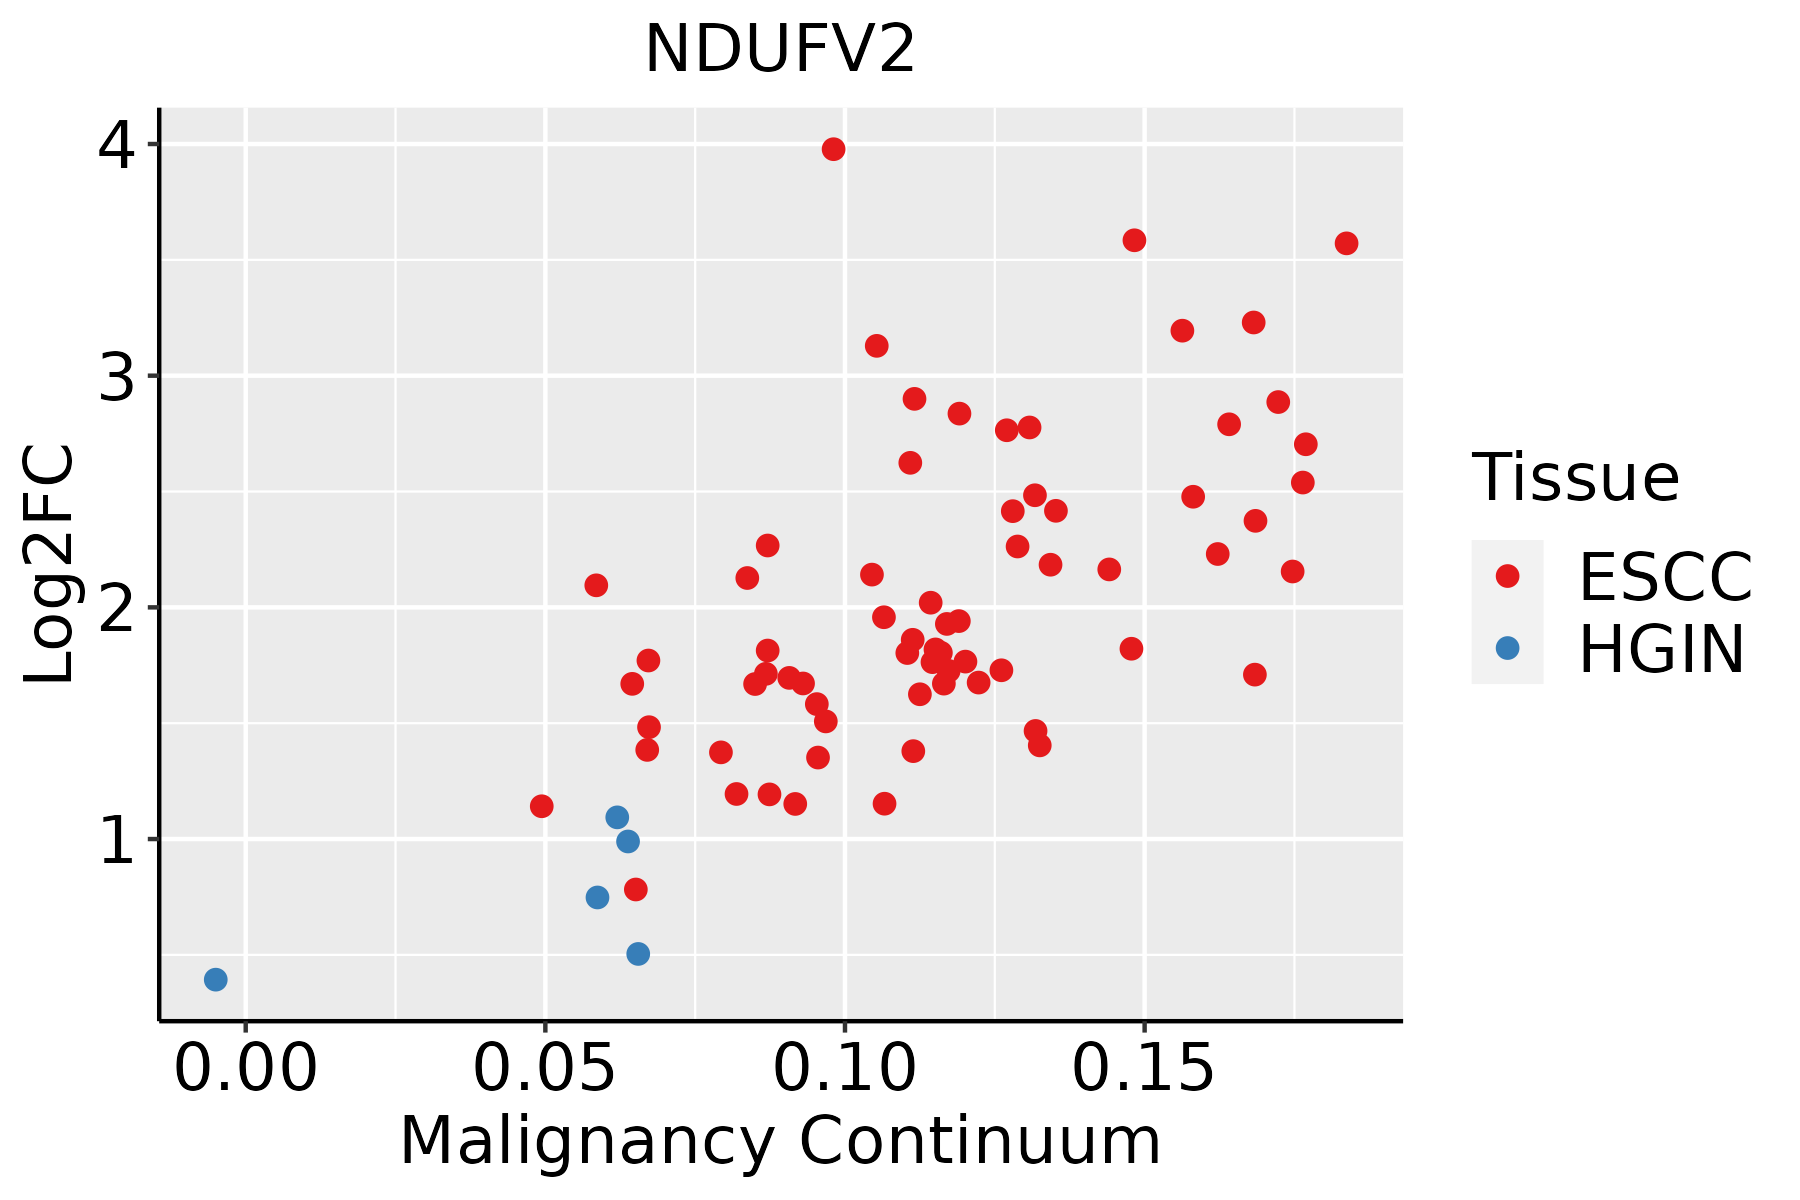 | ESCC: Esophageal squamous cell carcinoma |
| HGIN: High-grade intraepithelial neoplasias |
| LGIN: Low-grade intraepithelial neoplasias |
| GC | 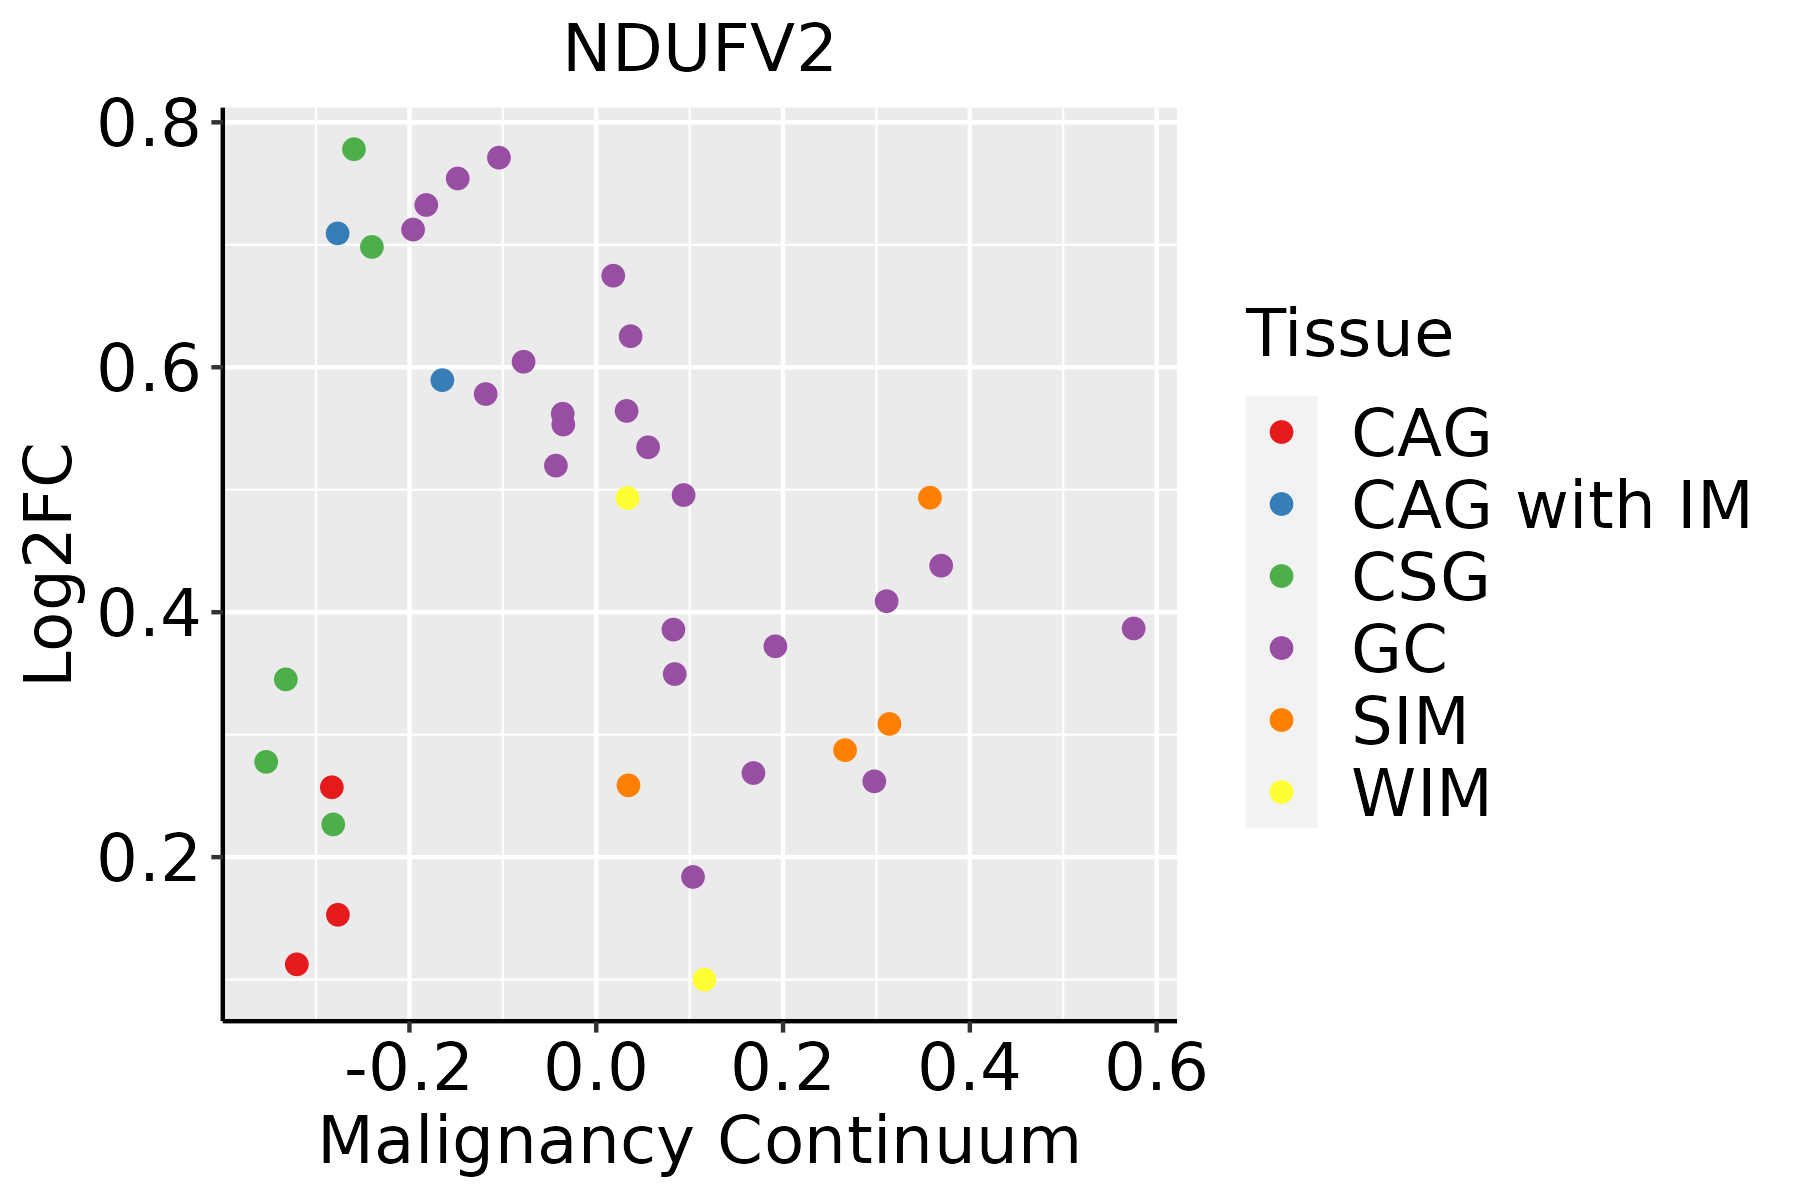 | CAG: Chronic atrophic gastritis |
| CAG with IM: Chronic atrophic gastritis with intestinal metaplasia |
| CSG: Chronic superficial gastritis |
| GC: Gastric cancer |
| SIM: Severe intestinal metaplasia |
| WIM: Wild intestinal metaplasia |
| Liver |  | HCC: Hepatocellular carcinoma |
| NAFLD: Non-alcoholic fatty liver disease |
| Oral Cavity | 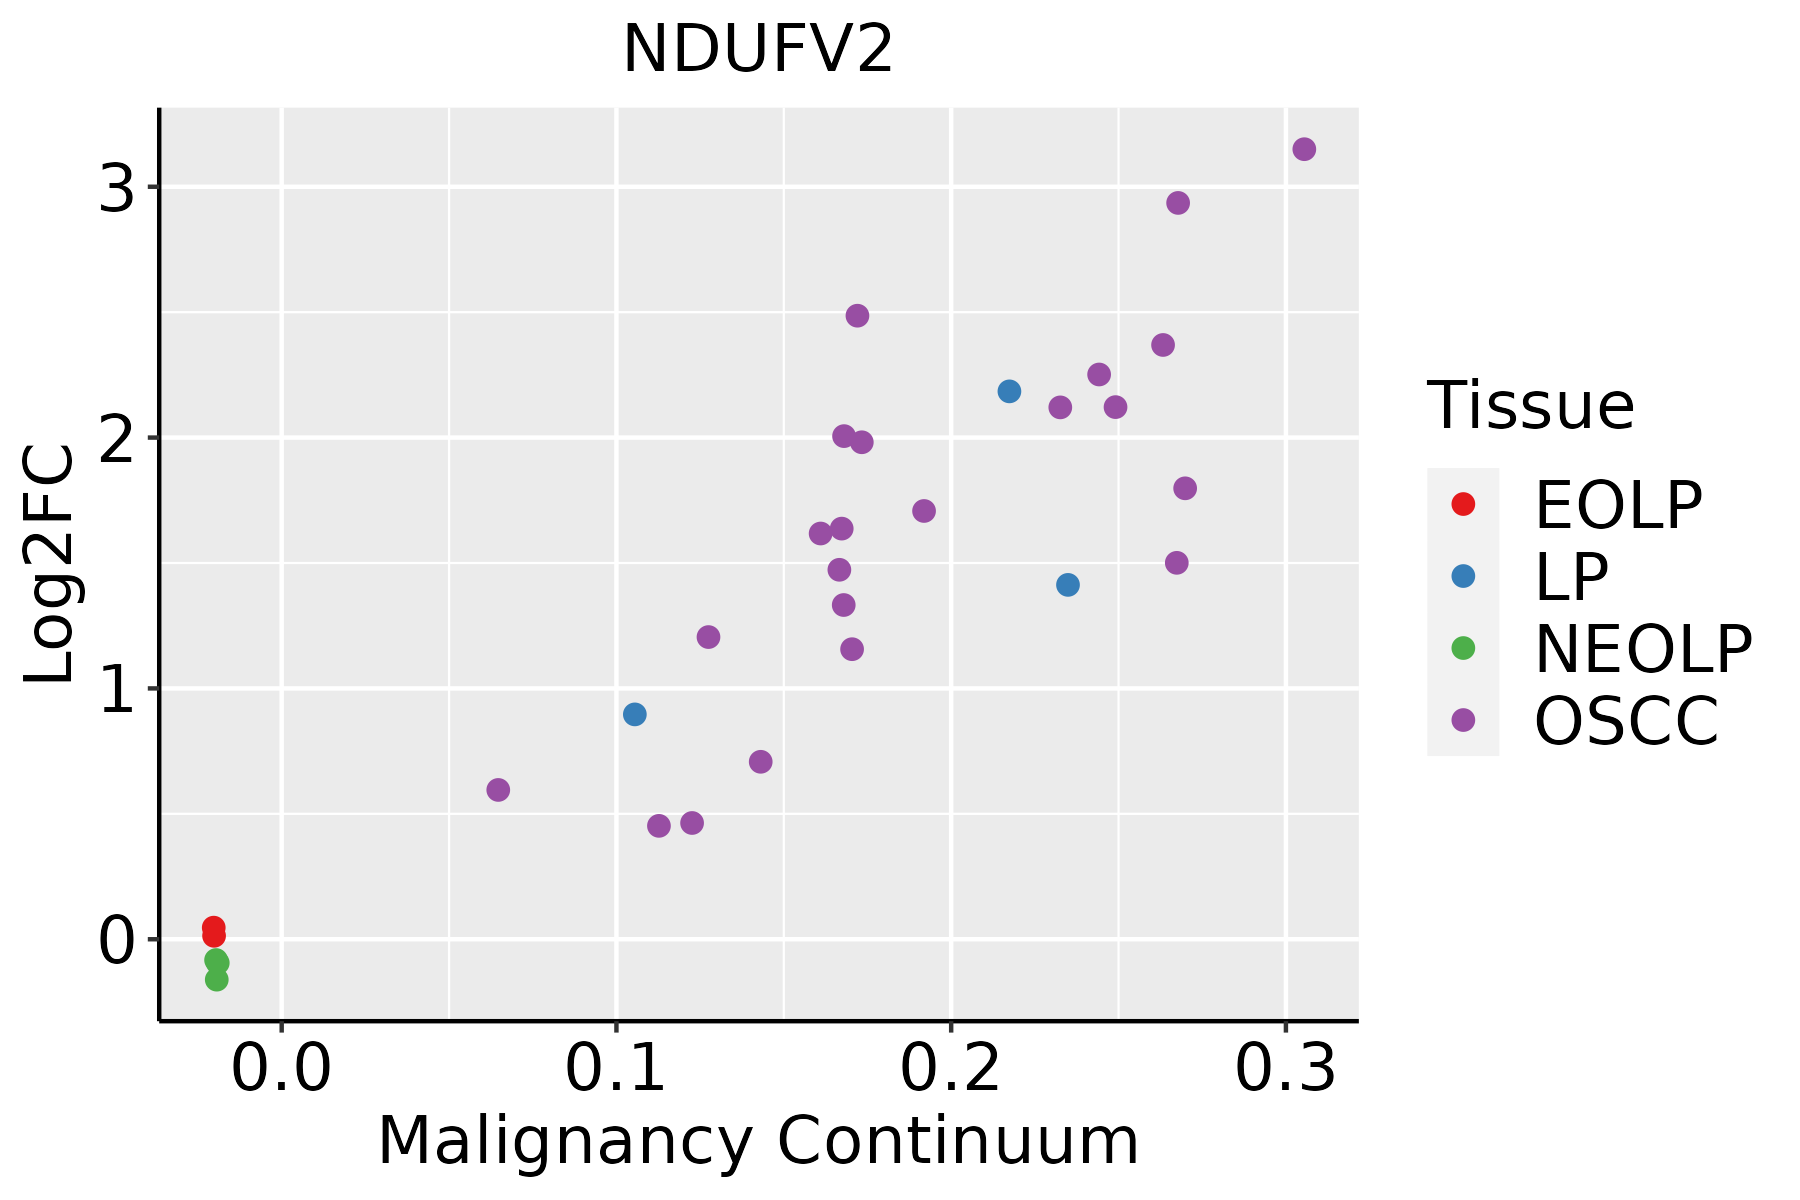 | EOLP: Erosive Oral lichen planus |
| LP: leukoplakia |
| NEOLP: Non-erosive oral lichen planus |
| OSCC: Oral squamous cell carcinoma |
| Prostate | 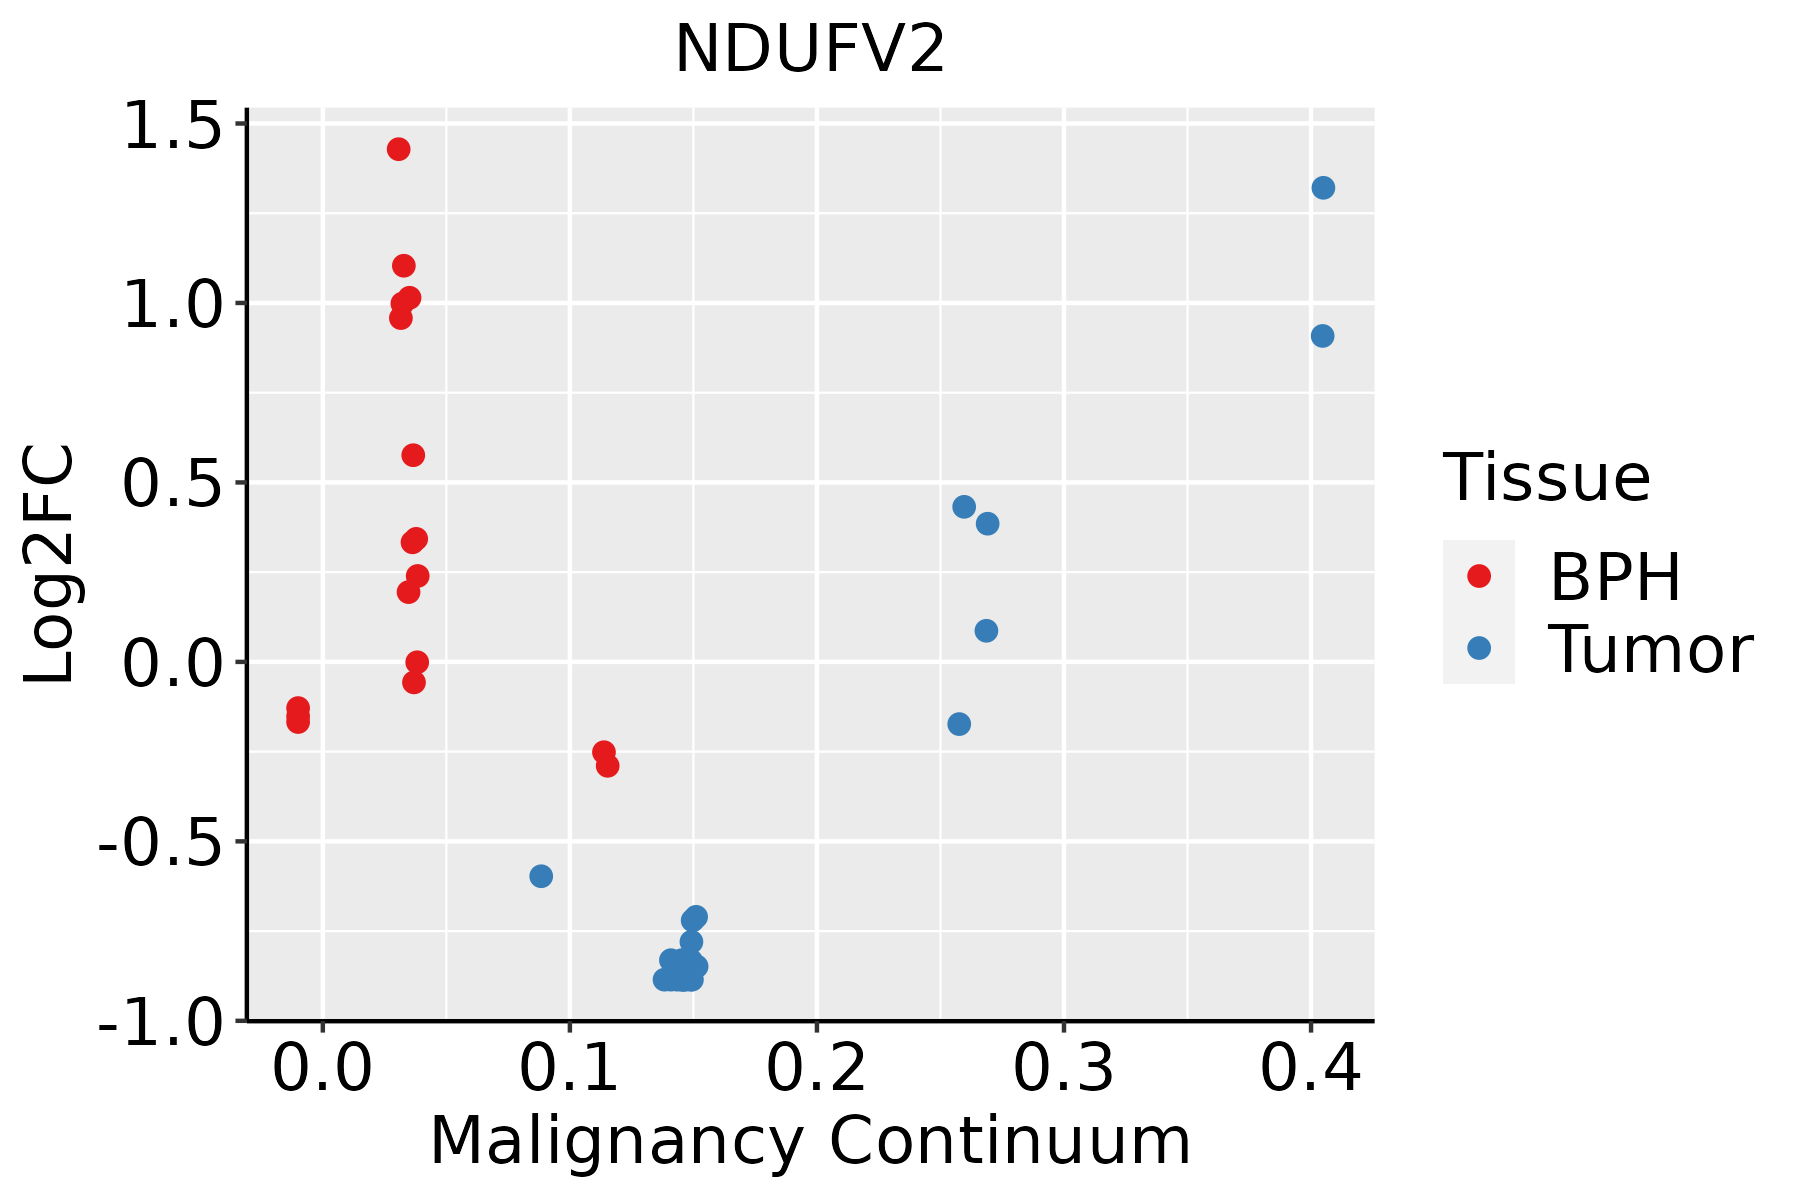 | BPH: Benign Prostatic Hyperplasia |
| Skin | 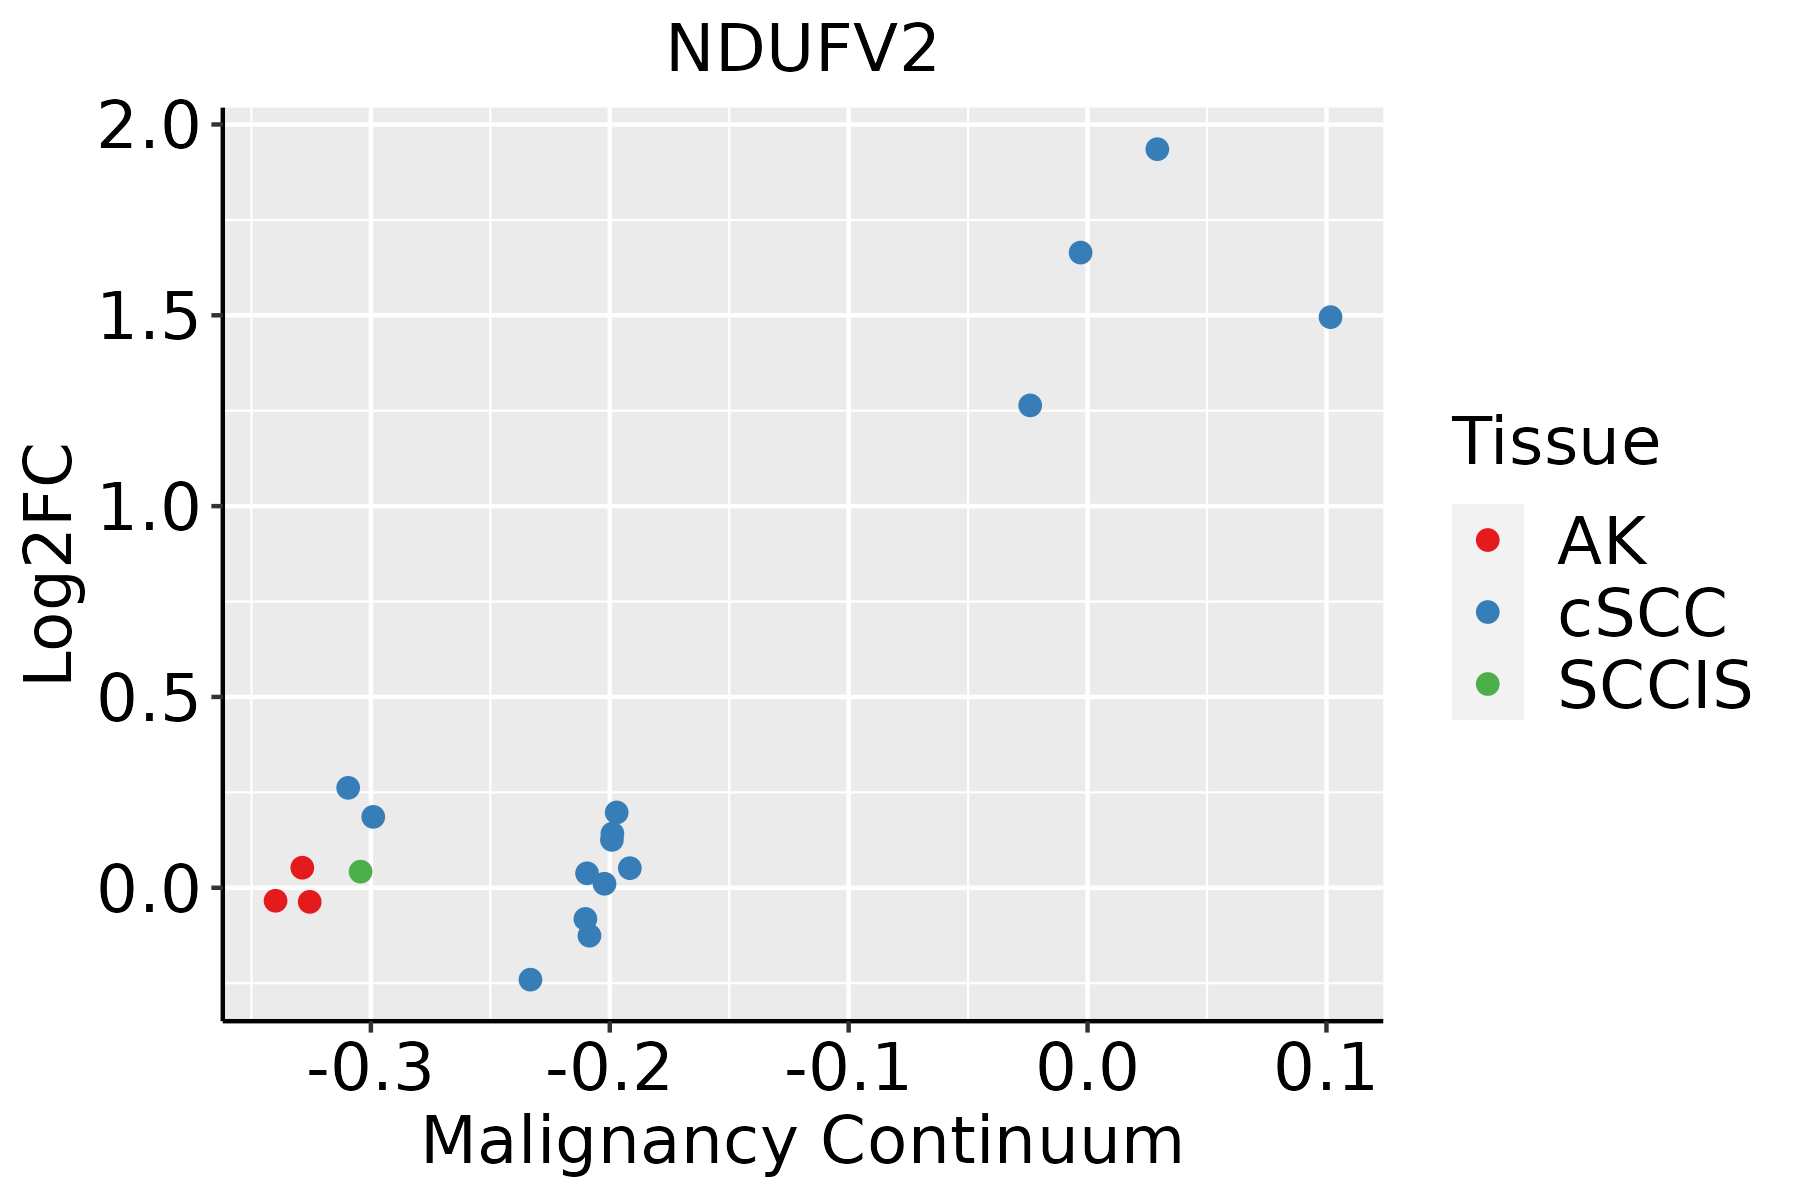 | AK: Actinic keratosis |
| cSCC: Cutaneous squamous cell carcinoma |
| SCCIS:squamous cell carcinoma in situ |
| Thyroid | 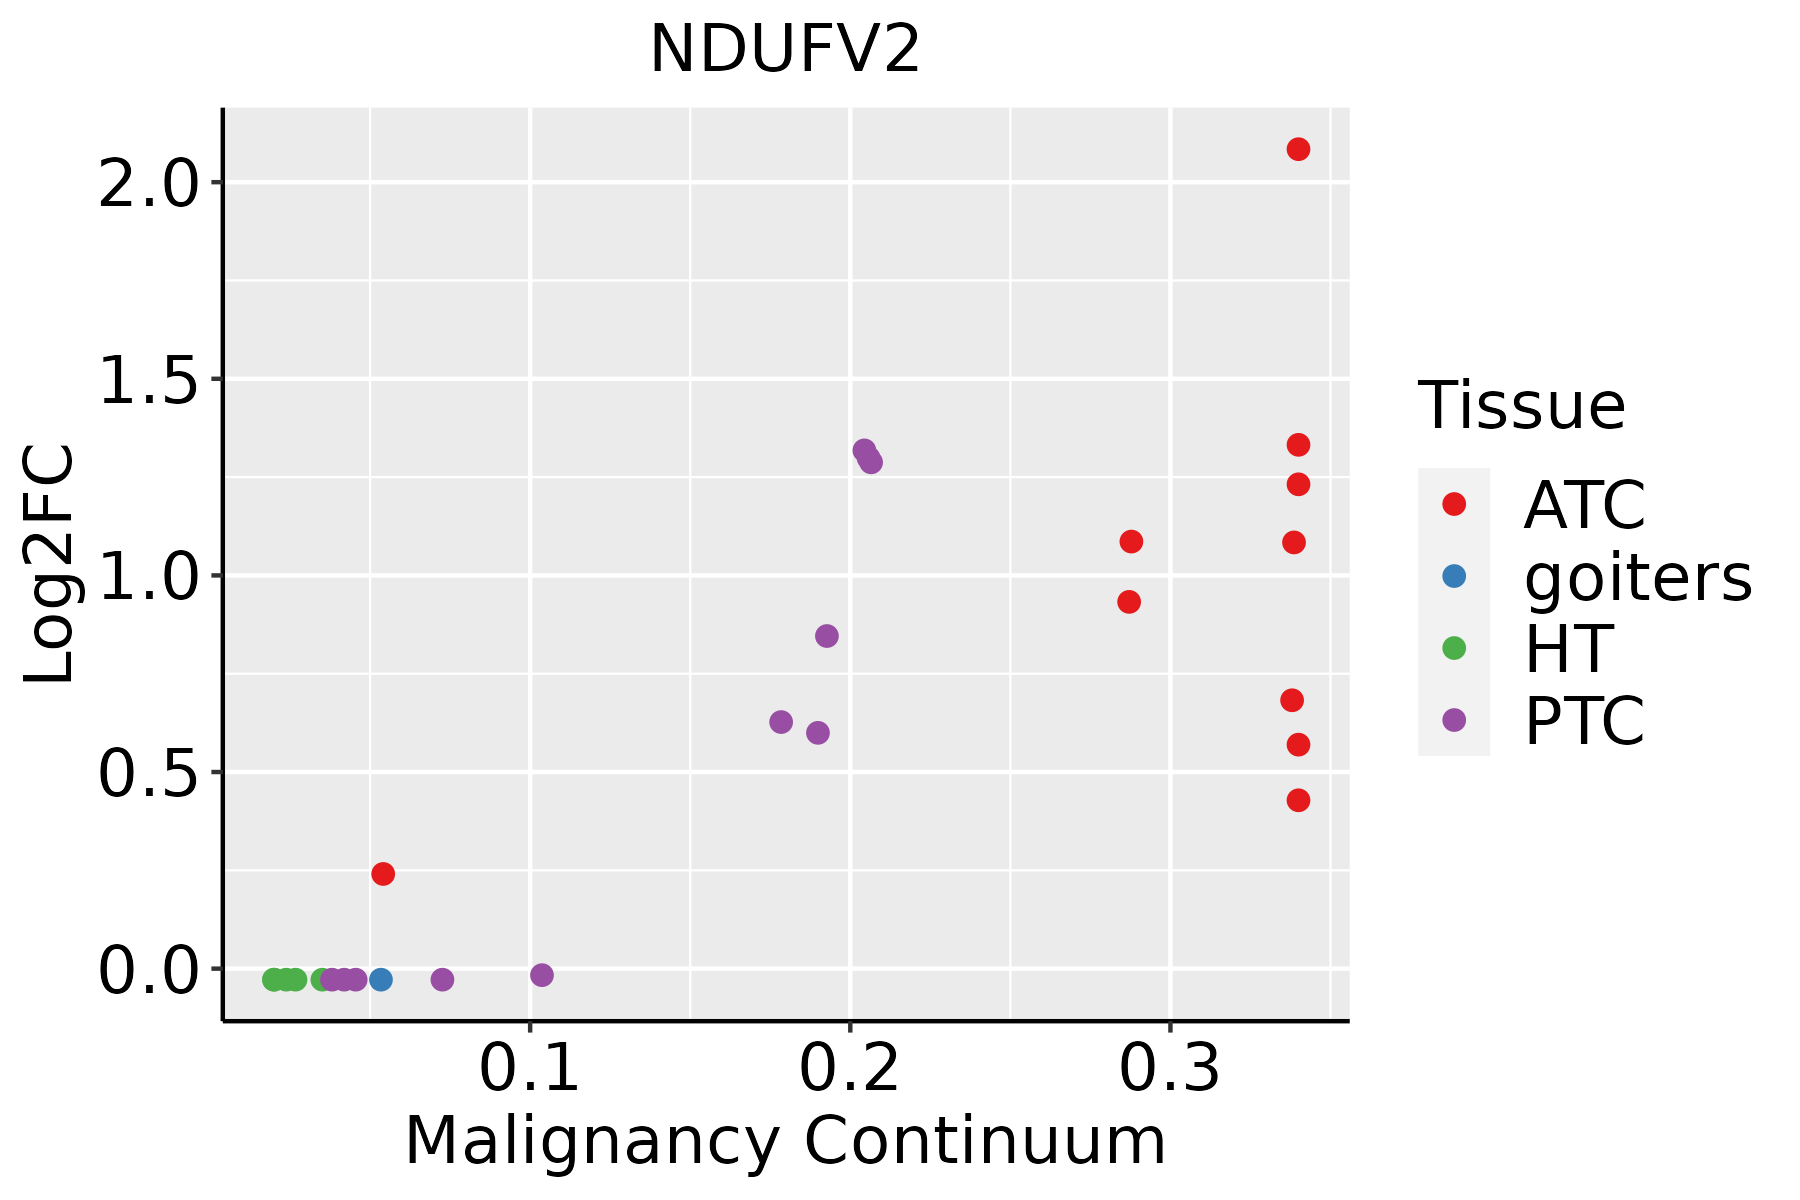 | ATC: Anaplastic thyroid cancer |
| HT: Hashimoto's thyroiditis |
| PTC: Papillary thyroid cancer |
| GO ID | Tissue | Disease Stage | Description | Gene Ratio | Bg Ratio | pvalue | p.adjust | Count |
| GO:0006091111 | Skin | cSCC | generation of precursor metabolites and energy | 224/4864 | 490/18723 | 1.13e-21 | 2.21e-19 | 224 |
| GO:002290026 | Skin | cSCC | electron transport chain | 104/4864 | 175/18723 | 7.28e-21 | 1.23e-18 | 104 |
| GO:0006119112 | Skin | cSCC | oxidative phosphorylation | 89/4864 | 141/18723 | 1.56e-20 | 2.49e-18 | 89 |
| GO:004277326 | Skin | cSCC | ATP synthesis coupled electron transport | 68/4864 | 95/18723 | 1.59e-20 | 2.49e-18 | 68 |
| GO:004277526 | Skin | cSCC | mitochondrial ATP synthesis coupled electron transport | 68/4864 | 95/18723 | 1.59e-20 | 2.49e-18 | 68 |
| GO:0046034112 | Skin | cSCC | ATP metabolic process | 142/4864 | 277/18723 | 1.38e-19 | 1.96e-17 | 142 |
| GO:002290426 | Skin | cSCC | respiratory electron transport chain | 74/4864 | 114/18723 | 2.52e-18 | 3.29e-16 | 74 |
| GO:001598026 | Skin | cSCC | energy derivation by oxidation of organic compounds | 154/4864 | 318/18723 | 4.19e-18 | 5.15e-16 | 154 |
| GO:001964626 | Skin | cSCC | aerobic electron transport chain | 61/4864 | 87/18723 | 7.73e-18 | 8.97e-16 | 61 |
| GO:000612026 | Skin | cSCC | mitochondrial electron transport, NADH to ubiquinone | 40/4864 | 51/18723 | 6.69e-15 | 5.06e-13 | 40 |
| GO:00460346 | Stomach | GC | ATP metabolic process | 73/1159 | 277/18723 | 5.03e-27 | 1.37e-23 | 73 |
| GO:00061196 | Stomach | GC | oxidative phosphorylation | 46/1159 | 141/18723 | 1.23e-21 | 2.24e-18 | 46 |
| GO:00060916 | Stomach | GC | generation of precursor metabolites and energy | 88/1159 | 490/18723 | 6.82e-20 | 9.27e-17 | 88 |
| GO:00090606 | Stomach | GC | aerobic respiration | 49/1159 | 189/18723 | 3.25e-18 | 3.54e-15 | 49 |
| GO:00453336 | Stomach | GC | cellular respiration | 54/1159 | 230/18723 | 7.63e-18 | 6.91e-15 | 54 |
| GO:00159806 | Stomach | GC | energy derivation by oxidation of organic compounds | 64/1159 | 318/18723 | 2.79e-17 | 2.16e-14 | 64 |
| GO:00229006 | Stomach | GC | electron transport chain | 41/1159 | 175/18723 | 7.75e-14 | 4.68e-11 | 41 |
| GO:00196466 | Stomach | GC | aerobic electron transport chain | 28/1159 | 87/18723 | 1.55e-13 | 7.03e-11 | 28 |
| GO:00229046 | Stomach | GC | respiratory electron transport chain | 31/1159 | 114/18723 | 1.27e-12 | 4.30e-10 | 31 |
| GO:00427736 | Stomach | GC | ATP synthesis coupled electron transport | 28/1159 | 95/18723 | 1.79e-12 | 5.40e-10 | 28 |
| Pathway ID | Tissue | Disease Stage | Description | Gene Ratio | Bg Ratio | pvalue | p.adjust | qvalue | Count |
| hsa0501218 | Breast | Precancer | Parkinson disease | 99/684 | 266/8465 | 3.58e-42 | 5.65e-40 | 4.33e-40 | 99 |
| hsa0502016 | Breast | Precancer | Prion disease | 95/684 | 273/8465 | 1.39e-37 | 1.46e-35 | 1.12e-35 | 95 |
| hsa0501616 | Breast | Precancer | Huntington disease | 98/684 | 306/8465 | 2.85e-35 | 2.25e-33 | 1.72e-33 | 98 |
| hsa0019016 | Breast | Precancer | Oxidative phosphorylation | 59/684 | 134/8465 | 6.15e-30 | 3.24e-28 | 2.48e-28 | 59 |
| hsa0501016 | Breast | Precancer | Alzheimer disease | 103/684 | 384/8465 | 1.03e-29 | 4.66e-28 | 3.57e-28 | 103 |
| hsa0501416 | Breast | Precancer | Amyotrophic lateral sclerosis | 98/684 | 364/8465 | 2.13e-28 | 8.41e-27 | 6.44e-27 | 98 |
| hsa0502216 | Breast | Precancer | Pathways of neurodegeneration - multiple diseases | 112/684 | 476/8465 | 6.96e-27 | 2.44e-25 | 1.87e-25 | 112 |
| hsa0520818 | Breast | Precancer | Chemical carcinogenesis - reactive oxygen species | 68/684 | 223/8465 | 3.61e-23 | 1.14e-21 | 8.73e-22 | 68 |
| hsa0471418 | Breast | Precancer | Thermogenesis | 68/684 | 232/8465 | 4.40e-22 | 1.26e-20 | 9.69e-21 | 68 |
| hsa0541518 | Breast | Precancer | Diabetic cardiomyopathy | 63/684 | 203/8465 | 5.63e-22 | 1.48e-20 | 1.14e-20 | 63 |
| hsa0493216 | Breast | Precancer | Non-alcoholic fatty liver disease | 48/684 | 155/8465 | 6.16e-17 | 1.50e-15 | 1.15e-15 | 48 |
| hsa0472316 | Breast | Precancer | Retrograde endocannabinoid signaling | 25/684 | 148/8465 | 3.05e-04 | 2.47e-03 | 1.89e-03 | 25 |
| hsa0501219 | Breast | Precancer | Parkinson disease | 99/684 | 266/8465 | 3.58e-42 | 5.65e-40 | 4.33e-40 | 99 |
| hsa0502017 | Breast | Precancer | Prion disease | 95/684 | 273/8465 | 1.39e-37 | 1.46e-35 | 1.12e-35 | 95 |
| hsa0501617 | Breast | Precancer | Huntington disease | 98/684 | 306/8465 | 2.85e-35 | 2.25e-33 | 1.72e-33 | 98 |
| hsa0019017 | Breast | Precancer | Oxidative phosphorylation | 59/684 | 134/8465 | 6.15e-30 | 3.24e-28 | 2.48e-28 | 59 |
| hsa0501017 | Breast | Precancer | Alzheimer disease | 103/684 | 384/8465 | 1.03e-29 | 4.66e-28 | 3.57e-28 | 103 |
| hsa0501417 | Breast | Precancer | Amyotrophic lateral sclerosis | 98/684 | 364/8465 | 2.13e-28 | 8.41e-27 | 6.44e-27 | 98 |
| hsa0502217 | Breast | Precancer | Pathways of neurodegeneration - multiple diseases | 112/684 | 476/8465 | 6.96e-27 | 2.44e-25 | 1.87e-25 | 112 |
| hsa0520819 | Breast | Precancer | Chemical carcinogenesis - reactive oxygen species | 68/684 | 223/8465 | 3.61e-23 | 1.14e-21 | 8.73e-22 | 68 |
| Hugo Symbol | Variant Class | Variant Classification | dbSNP RS | HGVSc | HGVSp | HGVSp Short | SWISSPROT | BIOTYPE | SIFT | PolyPhen | Tumor Sample Barcode | Tissue | Histology | Sex | Age | Stage | Therapy Types | Drugs | Outcome |
| NDUFV2 | SNV | Missense_Mutation | | c.743N>T | p.Gly248Val | p.G248V | P19404 | protein_coding | deleterious(0.01) | benign(0.197) | TCGA-A2-A04U-01 | Breast | breast invasive carcinoma | Female | <65 | I/II | Chemotherapy | adriamycin | SD |
| NDUFV2 | SNV | Missense_Mutation | | c.391N>G | p.His131Asp | p.H131D | P19404 | protein_coding | deleterious(0.01) | possibly_damaging(0.883) | TCGA-A8-A06Q-01 | Breast | breast invasive carcinoma | Female | <65 | III/IV | Unknown | Unknown | SD |
| NDUFV2 | SNV | Missense_Mutation | | c.647N>A | p.Pro216Gln | p.P216Q | P19404 | protein_coding | deleterious(0.02) | benign(0.091) | TCGA-AN-A0AK-01 | Breast | breast invasive carcinoma | Female | >=65 | I/II | Unknown | Unknown | SD |
| NDUFV2 | SNV | Missense_Mutation | | c.691N>G | p.Leu231Val | p.L231V | P19404 | protein_coding | tolerated(0.12) | benign(0.067) | TCGA-VS-A953-01 | Cervix | cervical & endocervical cancer | Female | <65 | I/II | Unknown | Unknown | PD |
| NDUFV2 | SNV | Missense_Mutation | novel | c.697N>C | p.Ser233Pro | p.S233P | P19404 | protein_coding | deleterious(0) | possibly_damaging(0.786) | TCGA-CI-6620-01 | Colorectum | rectum adenocarcinoma | Female | <65 | I/II | Ancillary | leucovorin | PD |
| NDUFV2 | SNV | Missense_Mutation | novel | c.193N>A | p.Ala65Thr | p.A65T | P19404 | protein_coding | tolerated(0.13) | benign(0.196) | TCGA-A5-A1OF-01 | Endometrium | uterine corpus endometrioid carcinoma | Female | <65 | I/II | Unknown | Unknown | SD |
| NDUFV2 | SNV | Missense_Mutation | novel | c.583N>T | p.Asp195Tyr | p.D195Y | P19404 | protein_coding | deleterious(0) | probably_damaging(0.996) | TCGA-AJ-A3EK-01 | Endometrium | uterine corpus endometrioid carcinoma | Female | <65 | I/II | Chemotherapy | carboplatin | CR |
| NDUFV2 | SNV | Missense_Mutation | novel | c.163T>C | p.Phe55Leu | p.F55L | P19404 | protein_coding | deleterious(0.02) | probably_damaging(0.968) | TCGA-AJ-A3EL-01 | Endometrium | uterine corpus endometrioid carcinoma | Female | <65 | I/II | Unknown | Unknown | SD |
| NDUFV2 | SNV | Missense_Mutation | novel | c.725N>A | p.Gly242Glu | p.G242E | P19404 | protein_coding | deleterious(0.01) | probably_damaging(0.978) | TCGA-AP-A051-01 | Endometrium | uterine corpus endometrioid carcinoma | Female | >=65 | I/II | Unknown | Unknown | SD |
| NDUFV2 | SNV | Missense_Mutation | novel | c.194N>T | p.Ala65Val | p.A65V | P19404 | protein_coding | tolerated(0.09) | benign(0.05) | TCGA-AP-A1DH-01 | Endometrium | uterine corpus endometrioid carcinoma | Female | <65 | I/II | Unknown | Unknown | SD |


