
|
|||||
|
 | |
| |
| |
| |
| |
| |
|
Gene: NDUFAF2 |
Gene summary for NDUFAF2 |
| Gene information | Species | Human | Gene symbol | NDUFAF2 | Gene ID | 91942 |
| Gene name | NADH:ubiquinone oxidoreductase complex assembly factor 2 | |
| Gene Alias | B17.2L | |
| Cytomap | 5q12.1 | |
| Gene Type | protein-coding | GO ID | GO:0001678 | UniProtAcc | A0A0S2Z5U1 |
Top |
Malignant transformation analysis |
| Identification of the aberrant gene expression in precancerous and cancerous lesions by comparing the gene expression of stem-like cells in diseased tissues with normal stem cells |
| Entrez ID | Symbol | Replicates | Species | Organ | Tissue | Adj P-value | Log2FC | Malignancy |
| 91942 | NDUFAF2 | HTA11_3410_2000001011 | Human | Colorectum | AD | 1.64e-12 | -5.33e-01 | 0.0155 |
| 91942 | NDUFAF2 | HTA11_2487_2000001011 | Human | Colorectum | SER | 3.03e-04 | -4.95e-01 | -0.1808 |
| 91942 | NDUFAF2 | HTA11_3361_2000001011 | Human | Colorectum | AD | 1.23e-03 | -5.56e-01 | -0.1207 |
| 91942 | NDUFAF2 | HTA11_696_2000001011 | Human | Colorectum | AD | 4.54e-16 | -3.99e-01 | -0.1464 |
| 91942 | NDUFAF2 | HTA11_866_2000001011 | Human | Colorectum | AD | 8.48e-11 | -4.09e-01 | -0.1001 |
| 91942 | NDUFAF2 | HTA11_5212_2000001011 | Human | Colorectum | AD | 2.25e-02 | -6.60e-01 | -0.2061 |
| 91942 | NDUFAF2 | HTA11_546_2000001011 | Human | Colorectum | AD | 4.99e-03 | -5.36e-01 | -0.0842 |
| 91942 | NDUFAF2 | HTA11_866_3004761011 | Human | Colorectum | AD | 4.61e-08 | -5.13e-01 | 0.096 |
| 91942 | NDUFAF2 | HTA11_10711_2000001011 | Human | Colorectum | AD | 5.87e-03 | -4.96e-01 | 0.0338 |
| 91942 | NDUFAF2 | HTA11_7696_3000711011 | Human | Colorectum | AD | 7.78e-20 | -4.64e-01 | 0.0674 |
| 91942 | NDUFAF2 | HTA11_99999970781_79442 | Human | Colorectum | MSS | 5.53e-13 | -4.56e-01 | 0.294 |
| 91942 | NDUFAF2 | HTA11_99999971662_82457 | Human | Colorectum | MSS | 8.33e-08 | -3.28e-01 | 0.3859 |
| 91942 | NDUFAF2 | HTA11_99999974143_84620 | Human | Colorectum | MSS | 1.01e-14 | -4.73e-01 | 0.3005 |
| 91942 | NDUFAF2 | A001-C-207 | Human | Colorectum | FAP | 2.27e-03 | -3.62e-01 | 0.1278 |
| 91942 | NDUFAF2 | A015-C-203 | Human | Colorectum | FAP | 1.34e-29 | -4.92e-01 | -0.1294 |
| 91942 | NDUFAF2 | A015-C-204 | Human | Colorectum | FAP | 8.49e-06 | -4.03e-01 | -0.0228 |
| 91942 | NDUFAF2 | A002-C-201 | Human | Colorectum | FAP | 6.93e-16 | -5.70e-01 | 0.0324 |
| 91942 | NDUFAF2 | A002-C-203 | Human | Colorectum | FAP | 2.56e-04 | -2.04e-01 | 0.2786 |
| 91942 | NDUFAF2 | A001-C-119 | Human | Colorectum | FAP | 3.47e-08 | -5.31e-01 | -0.1557 |
| 91942 | NDUFAF2 | A001-C-108 | Human | Colorectum | FAP | 6.48e-16 | -3.87e-01 | -0.0272 |
| Page: 1 2 3 4 5 6 7 8 |
| Tissue | Expression Dynamics | Abbreviation |
| Colorectum (GSE201348) |  | FAP: Familial adenomatous polyposis |
| CRC: Colorectal cancer | ||
| Colorectum (HTA11) |  | AD: Adenomas |
| SER: Sessile serrated lesions | ||
| MSI-H: Microsatellite-high colorectal cancer | ||
| MSS: Microsatellite stable colorectal cancer | ||
| Esophagus | 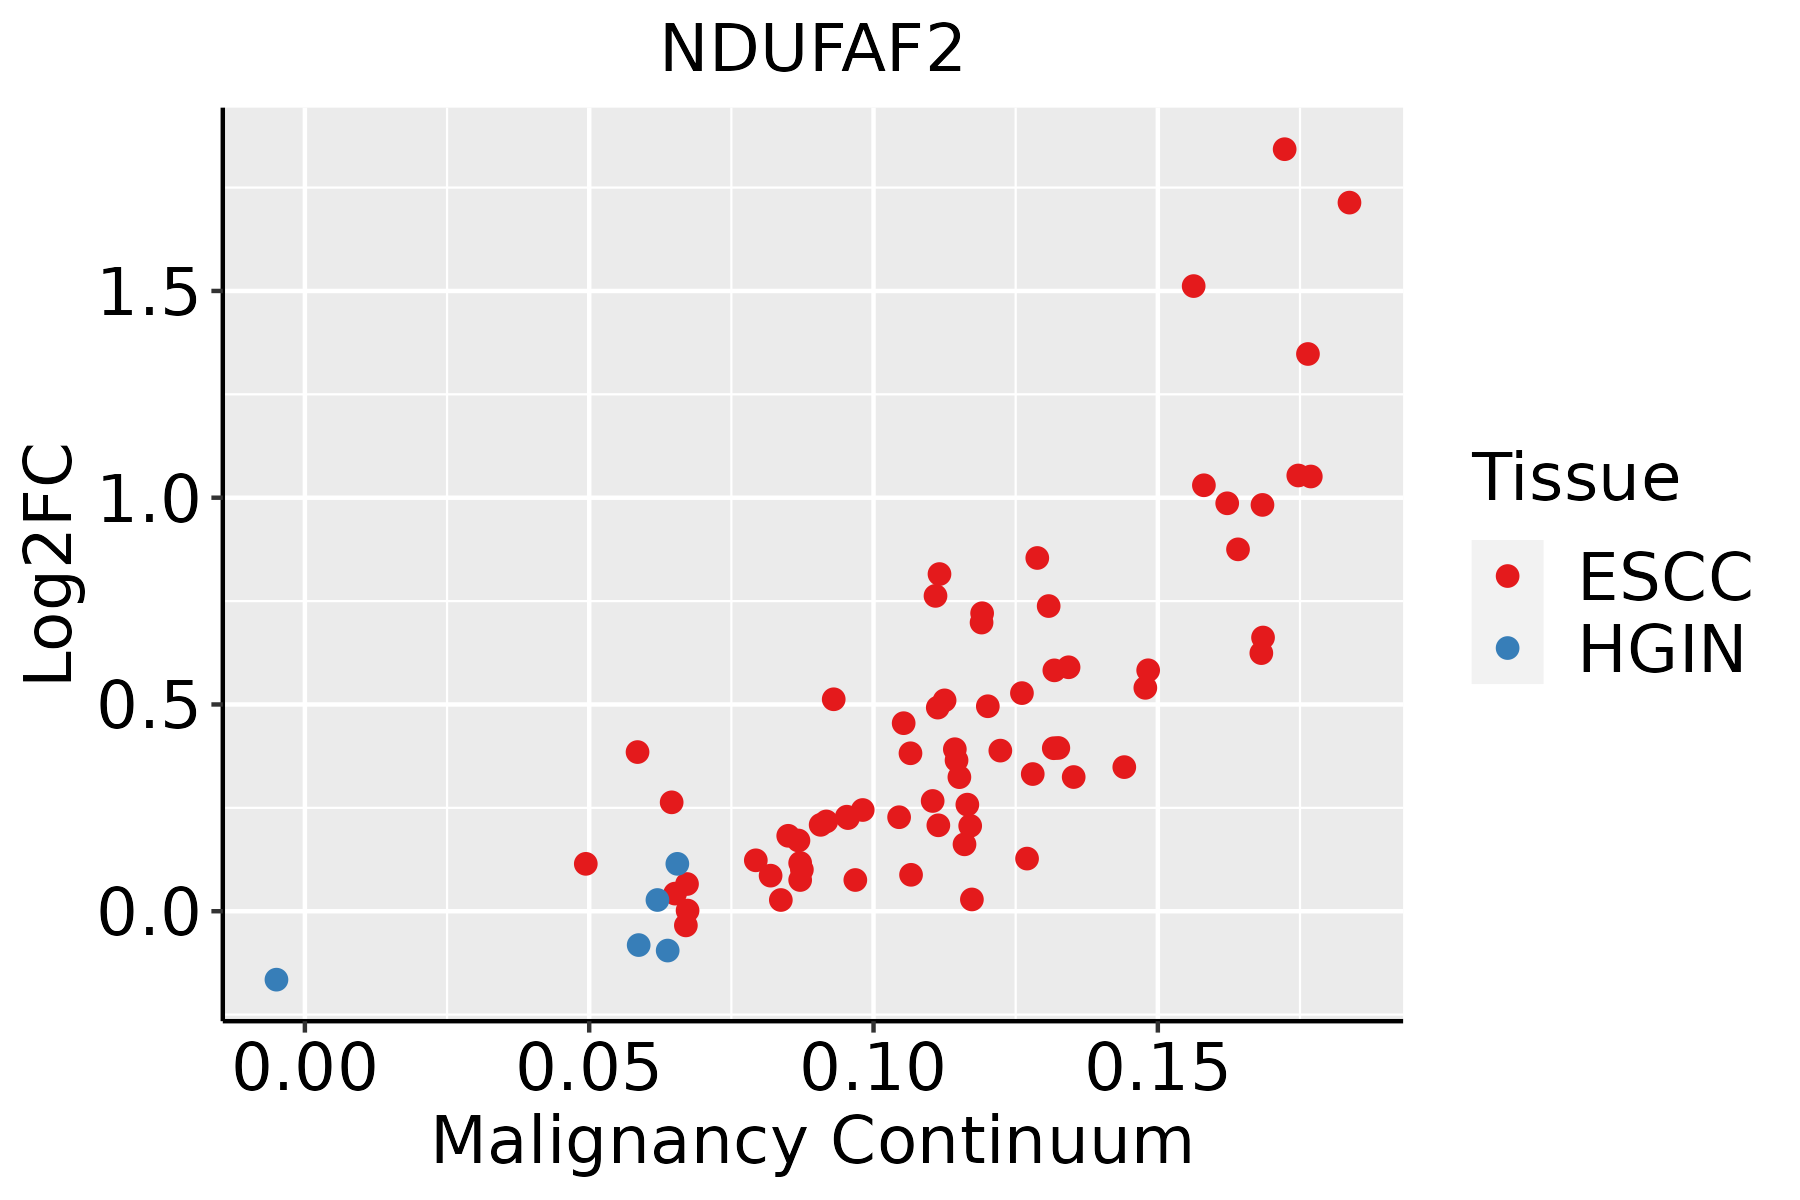 | ESCC: Esophageal squamous cell carcinoma |
| HGIN: High-grade intraepithelial neoplasias | ||
| LGIN: Low-grade intraepithelial neoplasias | ||
| Liver |  | HCC: Hepatocellular carcinoma |
| NAFLD: Non-alcoholic fatty liver disease | ||
| Oral Cavity | 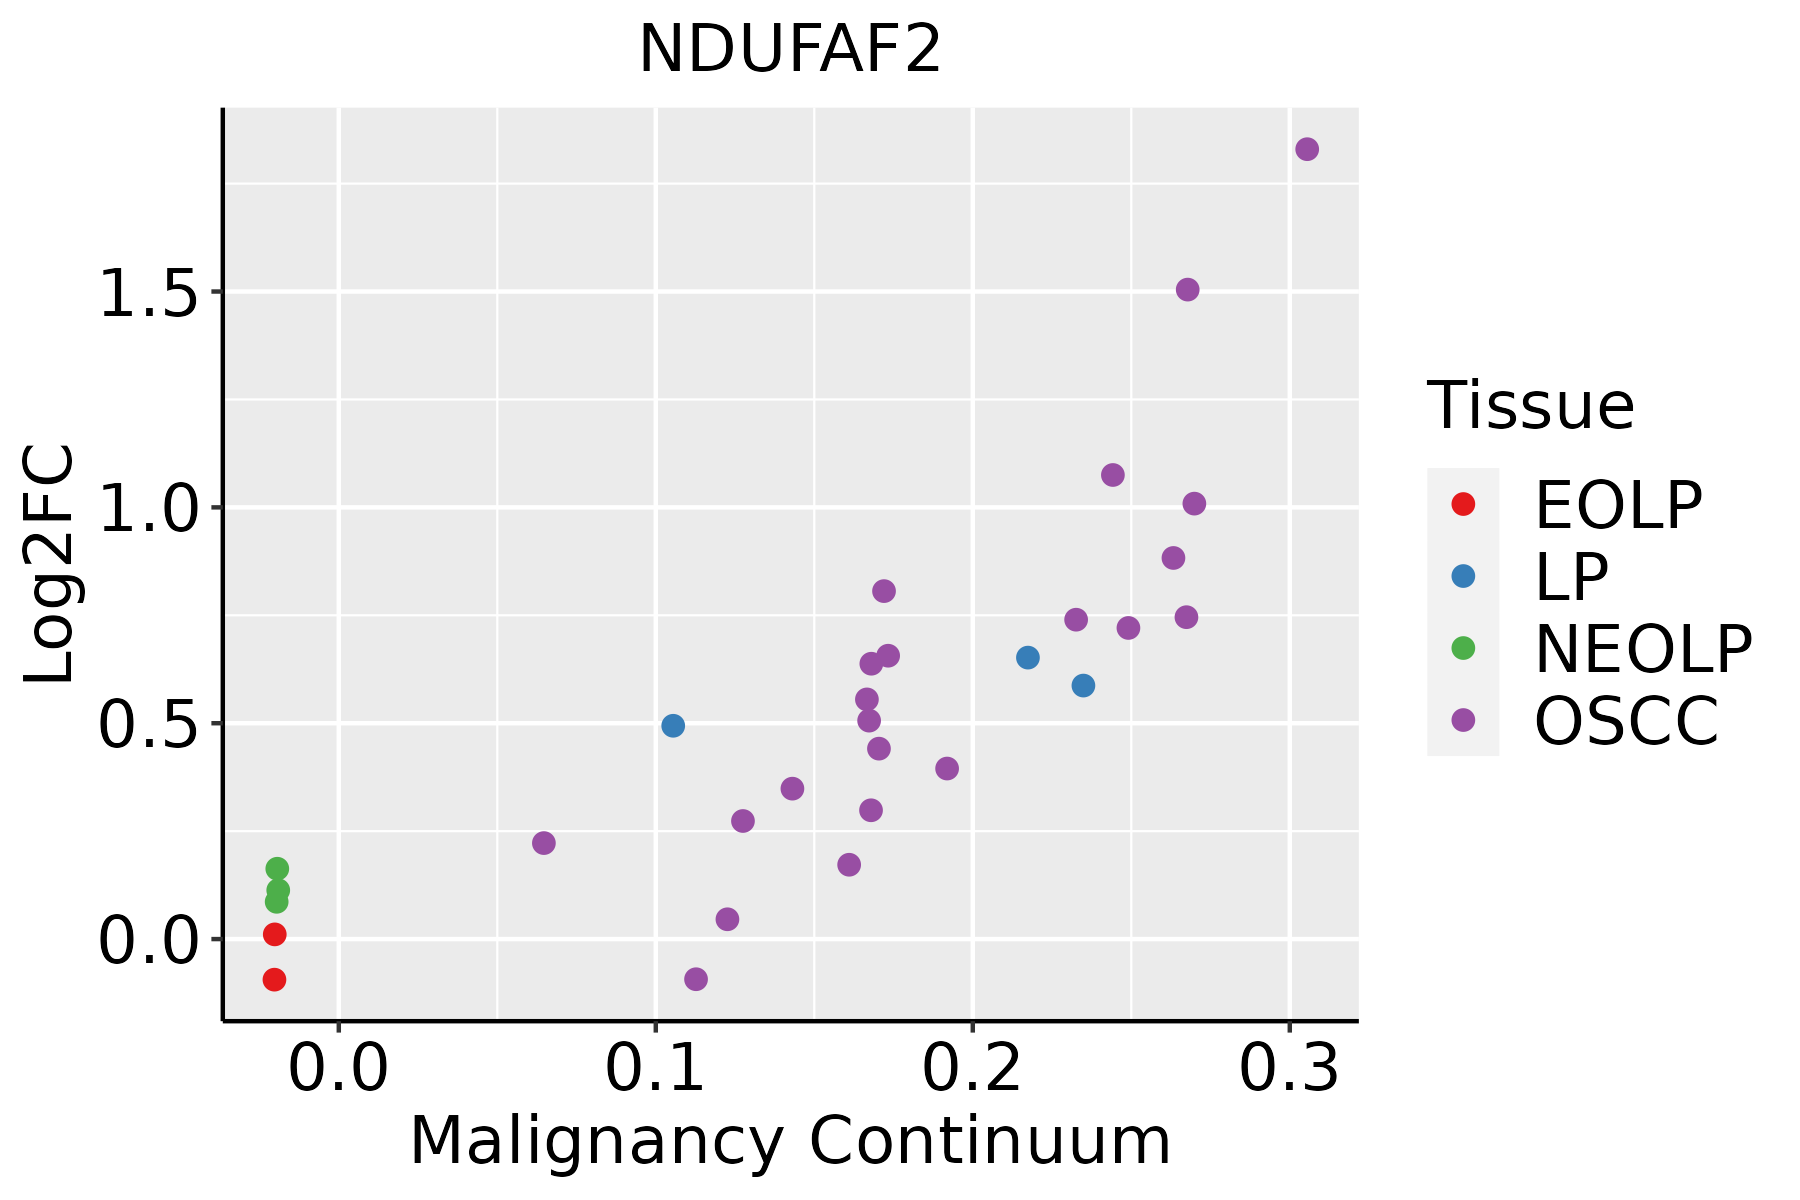 | EOLP: Erosive Oral lichen planus |
| LP: leukoplakia | ||
| NEOLP: Non-erosive oral lichen planus | ||
| OSCC: Oral squamous cell carcinoma | ||
| Skin |  | AK: Actinic keratosis |
| cSCC: Cutaneous squamous cell carcinoma | ||
| SCCIS:squamous cell carcinoma in situ | ||
| Thyroid |  | ATC: Anaplastic thyroid cancer |
| HT: Hashimoto's thyroiditis | ||
| PTC: Papillary thyroid cancer |
| ∗log2FC in expression of this searched gene in stem-like cells from each diseased tissue sample relative to stem-like cells in normal samples in each tissue plotted against the malignancy continuum. Samples are colored based on if they are from different disease stage. |
Top |
Malignant transformation related pathway analysis |
| Find out the enriched GO biological processes and KEGG pathways involved in transition from healthy to precancer to cancer |
| Tissue | Disease Stage | Enriched GO biological Processes |
| Colorectum | AD |  |
| Colorectum | SER |  |
| Colorectum | MSS |  |
| Colorectum | MSI-H |  |
| Colorectum | FAP |  |
| ∗Top 15 enriched GO BP terms are showed in the bar plot of each disease state in each tissue. Each row represents a significant GO biological process which is colored according to the -log10(p.adjust). |
| Page: 1 2 3 4 5 6 7 8 9 |
| GO ID | Tissue | Disease Stage | Description | Gene Ratio | Bg Ratio | pvalue | p.adjust | Count |
| GO:00466762 | Skin | cSCC | negative regulation of insulin secretion | 17/4864 | 38/18723 | 9.41e-03 | 4.25e-02 | 17 |
| GO:0033108111 | Thyroid | PTC | mitochondrial respiratory chain complex assembly | 65/5968 | 93/18723 | 5.60e-14 | 3.21e-12 | 65 |
| GO:0010257111 | Thyroid | PTC | NADH dehydrogenase complex assembly | 43/5968 | 57/18723 | 1.73e-11 | 6.81e-10 | 43 |
| GO:0032981111 | Thyroid | PTC | mitochondrial respiratory chain complex I assembly | 43/5968 | 57/18723 | 1.73e-11 | 6.81e-10 | 43 |
| GO:0009743113 | Thyroid | PTC | response to carbohydrate | 111/5968 | 253/18723 | 3.77e-05 | 3.48e-04 | 111 |
| GO:0034284112 | Thyroid | PTC | response to monosaccharide | 99/5968 | 225/18723 | 8.42e-05 | 7.03e-04 | 99 |
| GO:19049507 | Thyroid | PTC | negative regulation of establishment of protein localization | 61/5968 | 131/18723 | 3.01e-04 | 2.12e-03 | 61 |
| GO:0009746112 | Thyroid | PTC | response to hexose | 94/5968 | 219/18723 | 3.62e-04 | 2.45e-03 | 94 |
| GO:00512246 | Thyroid | PTC | negative regulation of protein transport | 59/5968 | 127/18723 | 4.04e-04 | 2.71e-03 | 59 |
| GO:0009749111 | Thyroid | PTC | response to glucose | 91/5968 | 212/18723 | 4.44e-04 | 2.95e-03 | 91 |
| GO:0001678110 | Thyroid | PTC | cellular glucose homeostasis | 72/5968 | 172/18723 | 3.58e-03 | 1.73e-02 | 72 |
| GO:0033500110 | Thyroid | PTC | carbohydrate homeostasis | 103/5968 | 259/18723 | 4.19e-03 | 1.99e-02 | 103 |
| GO:0071322111 | Thyroid | PTC | cellular response to carbohydrate stimulus | 68/5968 | 163/18723 | 5.00e-03 | 2.31e-02 | 68 |
| GO:0042593110 | Thyroid | PTC | glucose homeostasis | 102/5968 | 258/18723 | 5.34e-03 | 2.46e-02 | 102 |
| GO:00510518 | Thyroid | PTC | negative regulation of transport | 176/5968 | 470/18723 | 5.44e-03 | 2.49e-02 | 176 |
| GO:0071333110 | Thyroid | PTC | cellular response to glucose stimulus | 63/5968 | 151/18723 | 6.69e-03 | 2.89e-02 | 63 |
| GO:007169216 | Thyroid | PTC | protein localization to extracellular region | 139/5968 | 368/18723 | 8.95e-03 | 3.72e-02 | 139 |
| GO:0071331110 | Thyroid | PTC | cellular response to hexose stimulus | 63/5968 | 153/18723 | 9.35e-03 | 3.85e-02 | 63 |
| GO:0071326110 | Thyroid | PTC | cellular response to monosaccharide stimulus | 63/5968 | 154/18723 | 1.10e-02 | 4.39e-02 | 63 |
| GO:000930618 | Thyroid | PTC | protein secretion | 135/5968 | 359/18723 | 1.16e-02 | 4.58e-02 | 135 |
| Page: 1 2 3 4 5 6 7 8 9 10 11 12 13 14 |
| Pathway ID | Tissue | Disease Stage | Description | Gene Ratio | Bg Ratio | pvalue | p.adjust | qvalue | Count |
| hsa04714 | Colorectum | AD | Thermogenesis | 120/2092 | 232/8465 | 2.76e-19 | 1.16e-17 | 7.37e-18 | 120 |
| hsa047141 | Colorectum | AD | Thermogenesis | 120/2092 | 232/8465 | 2.76e-19 | 1.16e-17 | 7.37e-18 | 120 |
| hsa047142 | Colorectum | SER | Thermogenesis | 106/1580 | 232/8465 | 1.15e-21 | 6.34e-20 | 4.61e-20 | 106 |
| hsa047143 | Colorectum | SER | Thermogenesis | 106/1580 | 232/8465 | 1.15e-21 | 6.34e-20 | 4.61e-20 | 106 |
| hsa047144 | Colorectum | MSS | Thermogenesis | 113/1875 | 232/8465 | 1.52e-19 | 4.62e-18 | 2.83e-18 | 113 |
| hsa047145 | Colorectum | MSS | Thermogenesis | 113/1875 | 232/8465 | 1.52e-19 | 4.62e-18 | 2.83e-18 | 113 |
| hsa047148 | Colorectum | FAP | Thermogenesis | 70/1404 | 232/8465 | 1.38e-07 | 3.08e-06 | 1.87e-06 | 70 |
| hsa047149 | Colorectum | FAP | Thermogenesis | 70/1404 | 232/8465 | 1.38e-07 | 3.08e-06 | 1.87e-06 | 70 |
| hsa04714211 | Esophagus | ESCC | Thermogenesis | 163/4205 | 232/8465 | 9.22e-11 | 1.14e-09 | 5.86e-10 | 163 |
| hsa04714310 | Esophagus | ESCC | Thermogenesis | 163/4205 | 232/8465 | 9.22e-11 | 1.14e-09 | 5.86e-10 | 163 |
| hsa0471414 | Liver | Cirrhotic | Thermogenesis | 121/2530 | 232/8465 | 5.70e-13 | 1.36e-11 | 8.36e-12 | 121 |
| hsa0471415 | Liver | Cirrhotic | Thermogenesis | 121/2530 | 232/8465 | 5.70e-13 | 1.36e-11 | 8.36e-12 | 121 |
| hsa0471422 | Liver | HCC | Thermogenesis | 170/4020 | 232/8465 | 5.36e-16 | 2.25e-14 | 1.25e-14 | 170 |
| hsa0471432 | Liver | HCC | Thermogenesis | 170/4020 | 232/8465 | 5.36e-16 | 2.25e-14 | 1.25e-14 | 170 |
| hsa0471430 | Oral cavity | OSCC | Thermogenesis | 138/3704 | 232/8465 | 7.67e-07 | 4.35e-06 | 2.22e-06 | 138 |
| hsa04714113 | Oral cavity | OSCC | Thermogenesis | 138/3704 | 232/8465 | 7.67e-07 | 4.35e-06 | 2.22e-06 | 138 |
| Page: 1 |
Top |
Cell-cell communication analysis |
| Identification of potential cell-cell interactions between two cell types and their ligand-receptor pairs for different disease states |
| Ligand | Receptor | LRpair | Pathway | Tissue | Disease Stage |
| Page: 1 |
Top |
Single-cell gene regulatory network inference analysis |
| Find out the significant the regulons (TFs) and the target genes of each regulon across cell types for different disease states |
| TF | Cell Type | Tissue | Disease Stage | Target Gene | RSS | Regulon Activity |
| ∗The dot plots of a searched regulon are shown for all cell subpopulations in each disease state of each tissue based on the regulon specific score inferred using pySCENIC and by calculating the average expression. |
| Page: 1 |
Top |
Somatic mutation of malignant transformation related genes |
| Annotation of somatic variants for genes involved in malignant transformation |
| Hugo Symbol | Variant Class | Variant Classification | dbSNP RS | HGVSc | HGVSp | HGVSp Short | SWISSPROT | BIOTYPE | SIFT | PolyPhen | Tumor Sample Barcode | Tissue | Histology | Sex | Age | Stage | Therapy Types | Drugs | Outcome |
| NDUFAF2 | SNV | Missense_Mutation | novel | c.222G>T | p.Trp74Cys | p.W74C | Q8N183 | protein_coding | deleterious(0) | probably_damaging(0.999) | TCGA-AR-A24W-01 | Breast | breast invasive carcinoma | Female | <65 | I/II | Hormone Therapy | letrozole | SD |
| NDUFAF2 | SNV | Missense_Mutation | rs769323668 | c.25N>T | p.Arg9Cys | p.R9C | Q8N183 | protein_coding | deleterious(0) | benign(0.011) | TCGA-A6-4105-01 | Colorectum | colon adenocarcinoma | Male | >=65 | I/II | Unknown | Unknown | PD |
| NDUFAF2 | SNV | Missense_Mutation | c.410N>G | p.Tyr137Cys | p.Y137C | Q8N183 | protein_coding | tolerated(0.08) | benign(0.43) | TCGA-AA-3494-01 | Colorectum | colon adenocarcinoma | Male | <65 | III/IV | Chemotherapy | folinic | PR | |
| NDUFAF2 | SNV | Missense_Mutation | novel | c.134N>G | p.Thr45Ser | p.T45S | Q8N183 | protein_coding | tolerated(0.38) | possibly_damaging(0.54) | TCGA-AA-3666-01 | Colorectum | colon adenocarcinoma | Male | >=65 | III/IV | Unknown | Unknown | PD |
| NDUFAF2 | SNV | Missense_Mutation | c.128N>A | p.Gly43Glu | p.G43E | Q8N183 | protein_coding | deleterious(0) | probably_damaging(1) | TCGA-AA-3870-01 | Colorectum | colon adenocarcinoma | Female | >=65 | III/IV | Chemotherapy | folinic | CR | |
| NDUFAF2 | deletion | Frame_Shift_Del | c.184_185delNN | p.Tyr62Ter | p.Y62* | Q8N183 | protein_coding | TCGA-AA-3496-01 | Colorectum | colon adenocarcinoma | Female | >=65 | I/II | Unknown | Unknown | SD | |||
| NDUFAF2 | SNV | Missense_Mutation | c.303N>C | p.Lys101Asn | p.K101N | Q8N183 | protein_coding | deleterious(0) | possibly_damaging(0.614) | TCGA-AP-A059-01 | Endometrium | uterine corpus endometrioid carcinoma | Female | >=65 | I/II | Unknown | Unknown | SD | |
| NDUFAF2 | SNV | Missense_Mutation | novel | c.477N>T | p.Trp159Cys | p.W159C | Q8N183 | protein_coding | deleterious(0) | probably_damaging(0.998) | TCGA-AP-A1DK-01 | Endometrium | uterine corpus endometrioid carcinoma | Female | <65 | I/II | Unknown | Unknown | SD |
| NDUFAF2 | SNV | Missense_Mutation | novel | c.117N>T | p.Lys39Asn | p.K39N | Q8N183 | protein_coding | deleterious(0.01) | possibly_damaging(0.681) | TCGA-AP-A1DV-01 | Endometrium | uterine corpus endometrioid carcinoma | Female | <65 | I/II | Unknown | Unknown | SD |
| NDUFAF2 | SNV | Missense_Mutation | novel | c.145N>G | p.Lys49Glu | p.K49E | Q8N183 | protein_coding | deleterious(0.04) | benign(0.391) | TCGA-DD-AADQ-01 | Liver | liver hepatocellular carcinoma | Male | <65 | I/II | Unknown | Unknown | SD |
| Page: 1 2 |
Top |
Related drugs of malignant transformation related genes |
| Identification of chemicals and drugs interact with genes involved in malignant transfromation |
| (DGIdb 4.0) |
| Entrez ID | Symbol | Category | Interaction Types | Drug Claim Name | Drug Name | PMIDs |
| 91942 | NDUFAF2 | ENZYME | inhibitor | CHEMBL1703 | METFORMIN HYDROCHLORIDE | |
| 91942 | NDUFAF2 | ENZYME | inhibitor | CHEMBL3545135 | NV-128 | |
| 91942 | NDUFAF2 | ENZYME | inhibitor | CHEMBL3545320 | ME-344 |
| Page: 1 |

Copyright 2023-Present -The University of Texas Health Science Center at Houston |