
|
|||||
|
 | |
| |
| |
| |
| |
| |
|
Gene: MGAT5 |
Gene summary for MGAT5 |
| Gene information | Species | Human | Gene symbol | MGAT5 | Gene ID | 4249 |
| Gene name | alpha-1,6-mannosylglycoprotein 6-beta-N-acetylglucosaminyltransferase | |
| Gene Alias | GNT-V | |
| Cytomap | 2q21.2-q21.3 | |
| Gene Type | protein-coding | GO ID | GO:0006464 | UniProtAcc | Q09328 |
Top |
Malignant transformation analysis |
| Identification of the aberrant gene expression in precancerous and cancerous lesions by comparing the gene expression of stem-like cells in diseased tissues with normal stem cells |
| Entrez ID | Symbol | Replicates | Species | Organ | Tissue | Adj P-value | Log2FC | Malignancy |
| 4249 | MGAT5 | CCI_1 | Human | Cervix | CC | 7.83e-06 | 1.04e+00 | 0.528 |
| 4249 | MGAT5 | CCI_3 | Human | Cervix | CC | 4.67e-09 | 6.55e-01 | 0.516 |
| 4249 | MGAT5 | HTA11_347_2000001011 | Human | Colorectum | AD | 5.71e-03 | 4.88e-01 | -0.1954 |
| 4249 | MGAT5 | HTA11_411_2000001011 | Human | Colorectum | SER | 1.23e-04 | 9.22e-01 | -0.2602 |
| 4249 | MGAT5 | HTA11_2112_2000001011 | Human | Colorectum | SER | 2.85e-02 | 7.53e-01 | -0.2196 |
| 4249 | MGAT5 | HTA11_696_2000001011 | Human | Colorectum | AD | 5.48e-03 | 3.97e-01 | -0.1464 |
| 4249 | MGAT5 | HTA11_1391_2000001011 | Human | Colorectum | AD | 9.93e-03 | 5.98e-01 | -0.059 |
| 4249 | MGAT5 | HTA11_4255_2000001011 | Human | Colorectum | SER | 2.28e-03 | 9.52e-01 | 0.0446 |
| 4249 | MGAT5 | HTA11_7696_3000711011 | Human | Colorectum | AD | 1.89e-03 | 5.42e-01 | 0.0674 |
| 4249 | MGAT5 | HTA11_6818_2000001021 | Human | Colorectum | AD | 4.60e-14 | 1.39e+00 | 0.0588 |
| 4249 | MGAT5 | HTA11_99999970781_79442 | Human | Colorectum | MSS | 2.42e-38 | 1.42e+00 | 0.294 |
| 4249 | MGAT5 | HTA11_99999965062_69753 | Human | Colorectum | MSI-H | 1.26e-11 | 1.57e+00 | 0.3487 |
| 4249 | MGAT5 | HTA11_99999965104_69814 | Human | Colorectum | MSS | 3.70e-21 | 1.38e+00 | 0.281 |
| 4249 | MGAT5 | HTA11_99999971662_82457 | Human | Colorectum | MSS | 9.27e-32 | 1.84e+00 | 0.3859 |
| 4249 | MGAT5 | HTA11_99999973899_84307 | Human | Colorectum | MSS | 1.91e-09 | 1.15e+00 | 0.2585 |
| 4249 | MGAT5 | HTA11_99999974143_84620 | Human | Colorectum | MSS | 1.82e-39 | 1.47e+00 | 0.3005 |
| 4249 | MGAT5 | F007 | Human | Colorectum | FAP | 6.75e-04 | 4.52e-01 | 0.1176 |
| 4249 | MGAT5 | A002-C-010 | Human | Colorectum | FAP | 1.00e-09 | 3.84e-01 | 0.242 |
| 4249 | MGAT5 | A001-C-207 | Human | Colorectum | FAP | 1.27e-25 | 8.60e-01 | 0.1278 |
| 4249 | MGAT5 | A015-C-203 | Human | Colorectum | FAP | 1.65e-16 | -1.46e-02 | -0.1294 |
| Page: 1 2 3 4 5 6 7 8 |
| Tissue | Expression Dynamics | Abbreviation |
| Cervix |  | CC: Cervix cancer |
| HSIL_HPV: HPV-infected high-grade squamous intraepithelial lesions | ||
| N_HPV: HPV-infected normal cervix | ||
| Colorectum (GSE201348) |  | FAP: Familial adenomatous polyposis |
| CRC: Colorectal cancer | ||
| Colorectum (HTA11) |  | AD: Adenomas |
| SER: Sessile serrated lesions | ||
| MSI-H: Microsatellite-high colorectal cancer | ||
| MSS: Microsatellite stable colorectal cancer | ||
| Endometrium | 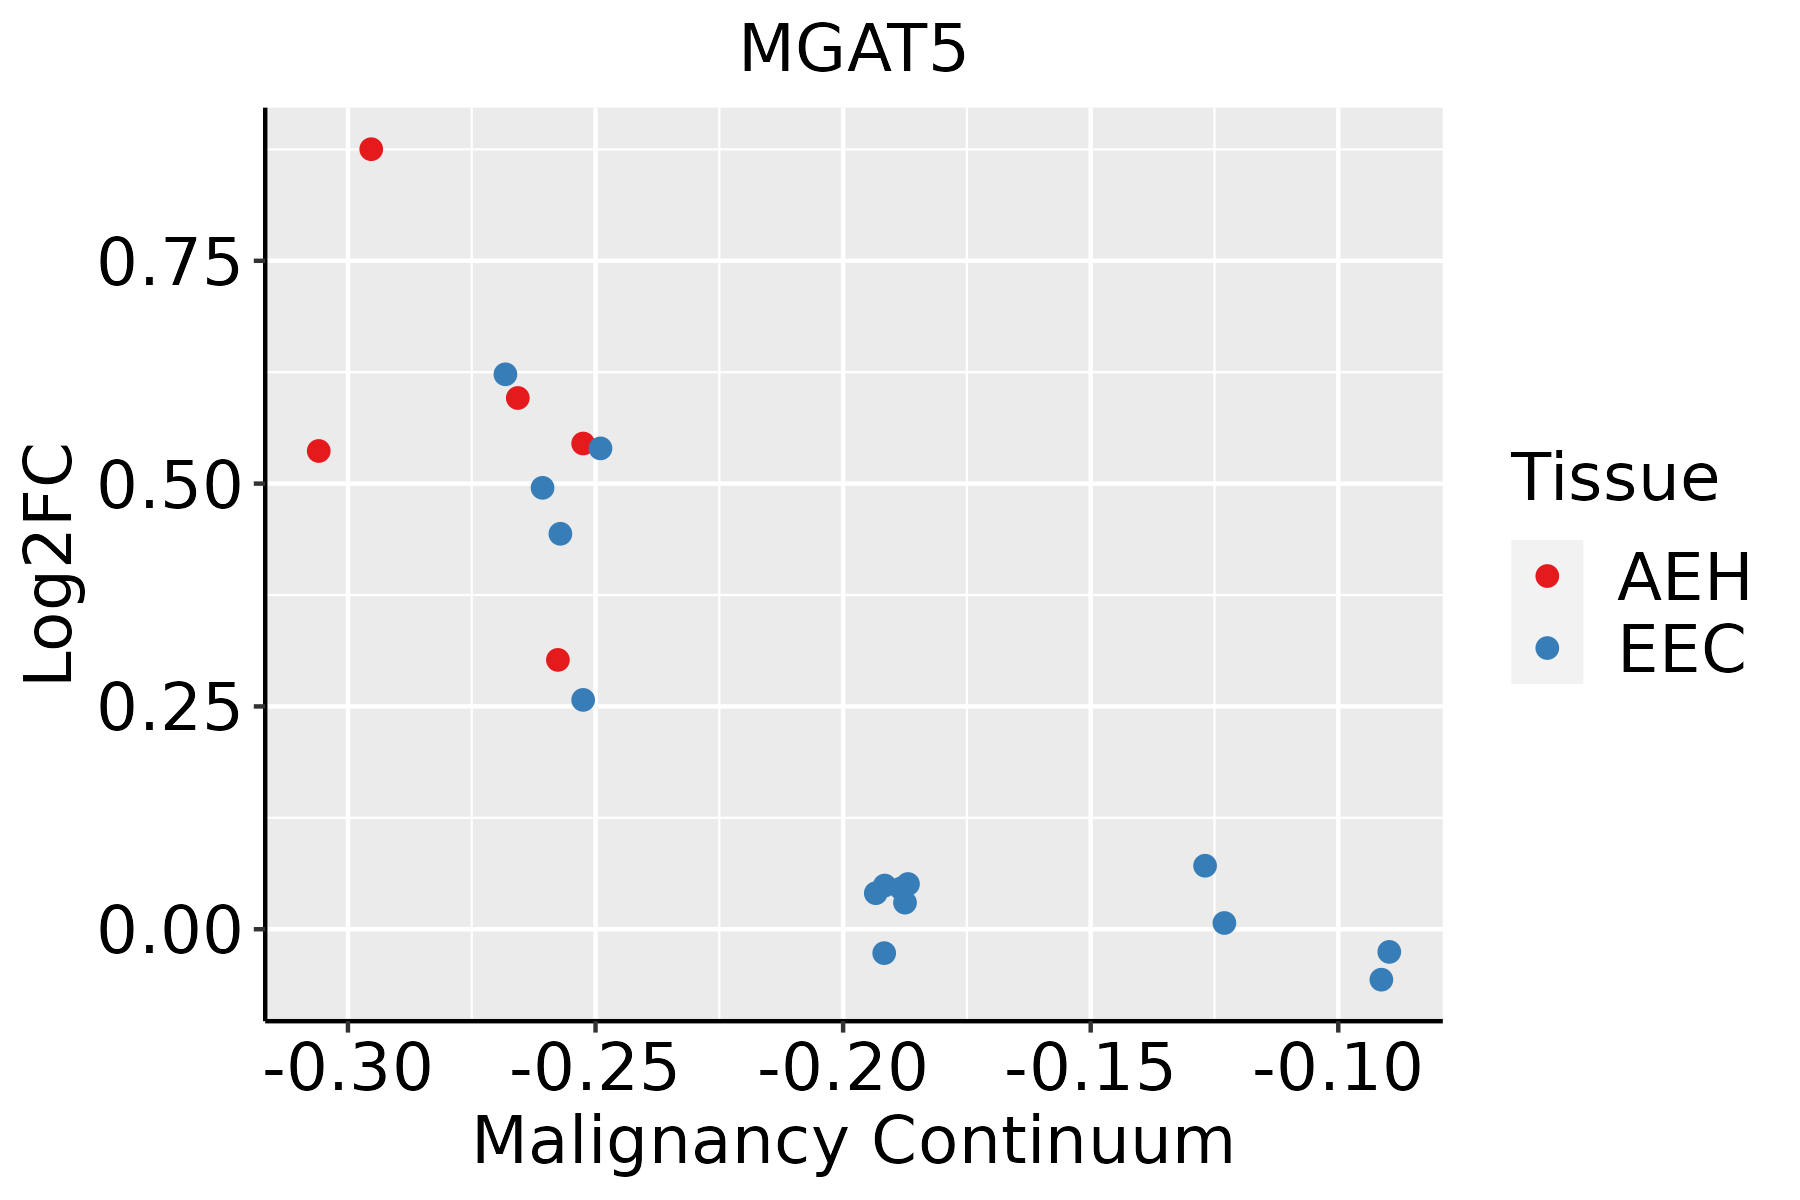 | AEH: Atypical endometrial hyperplasia |
| EEC: Endometrioid Cancer | ||
| Esophagus | 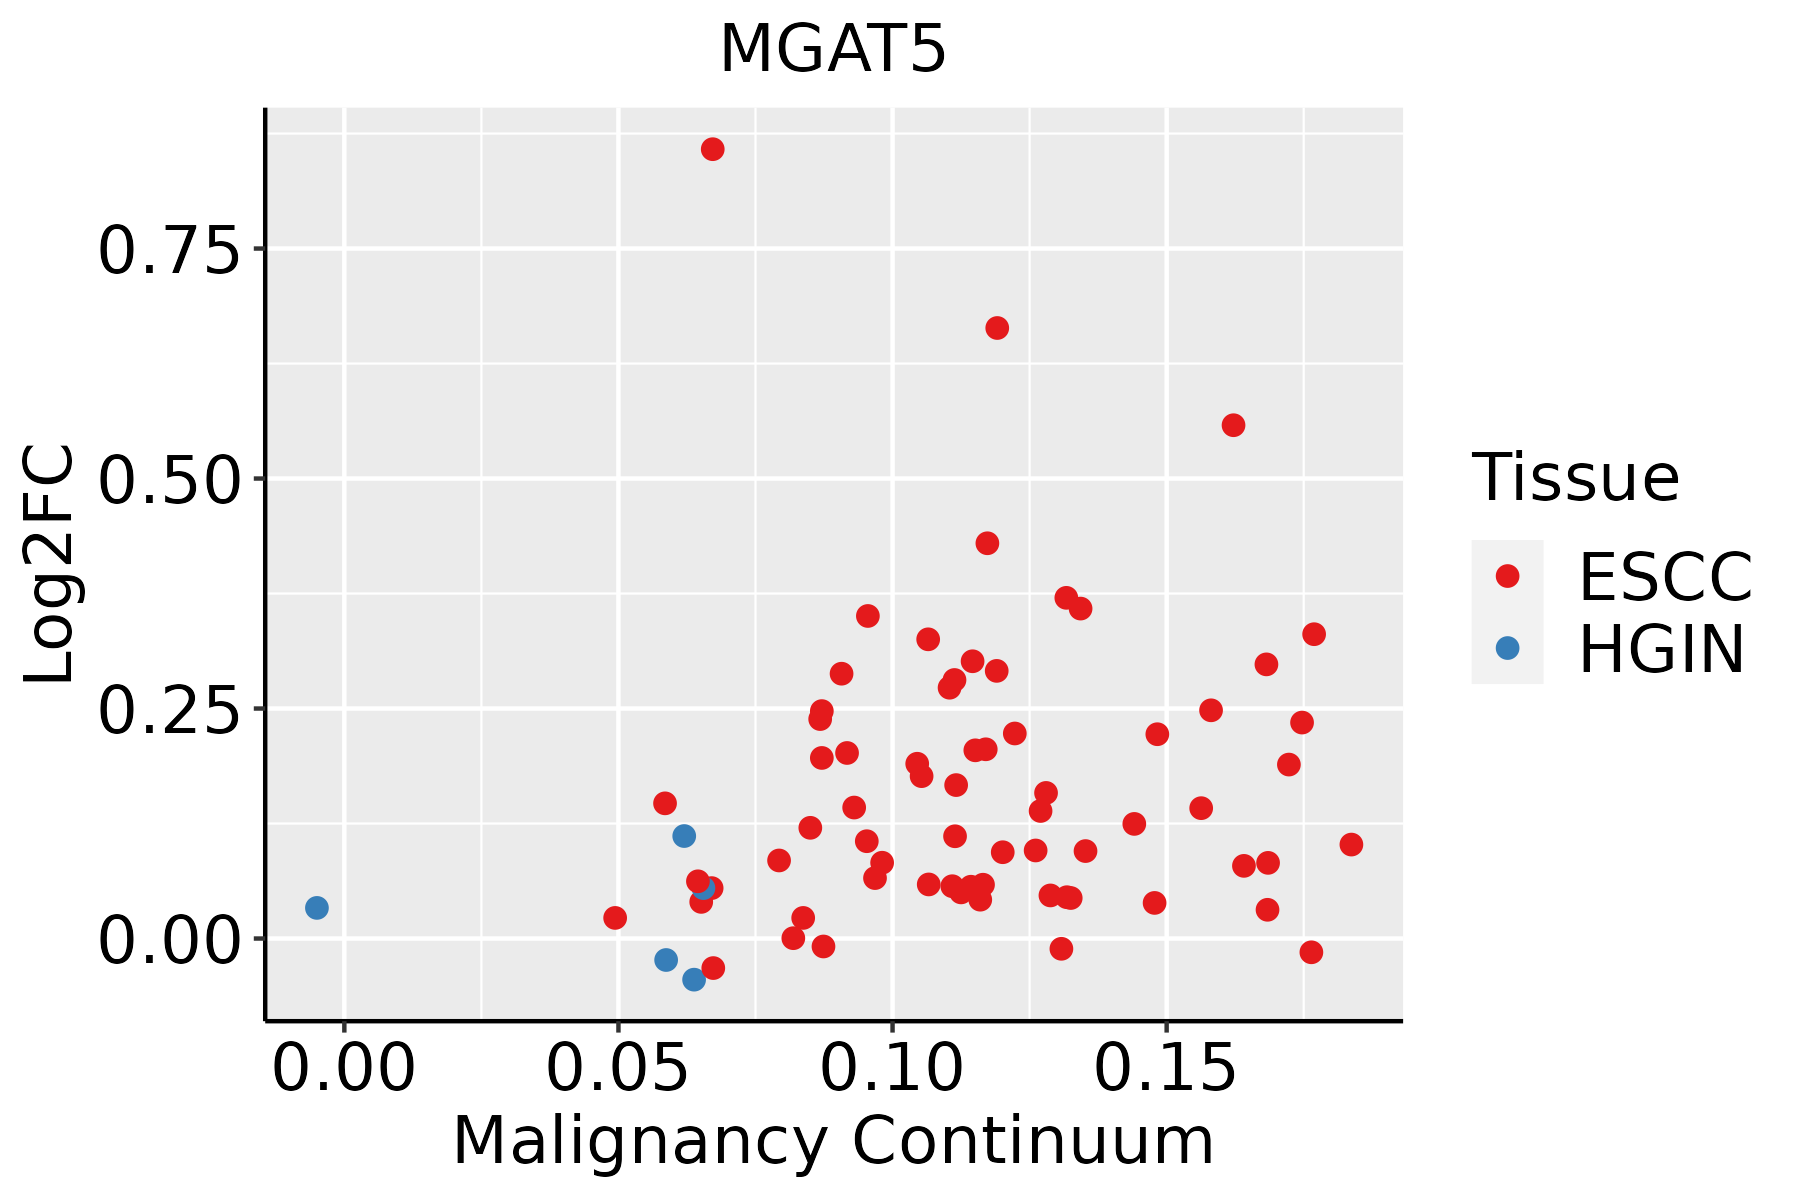 | ESCC: Esophageal squamous cell carcinoma |
| HGIN: High-grade intraepithelial neoplasias | ||
| LGIN: Low-grade intraepithelial neoplasias | ||
| GC | 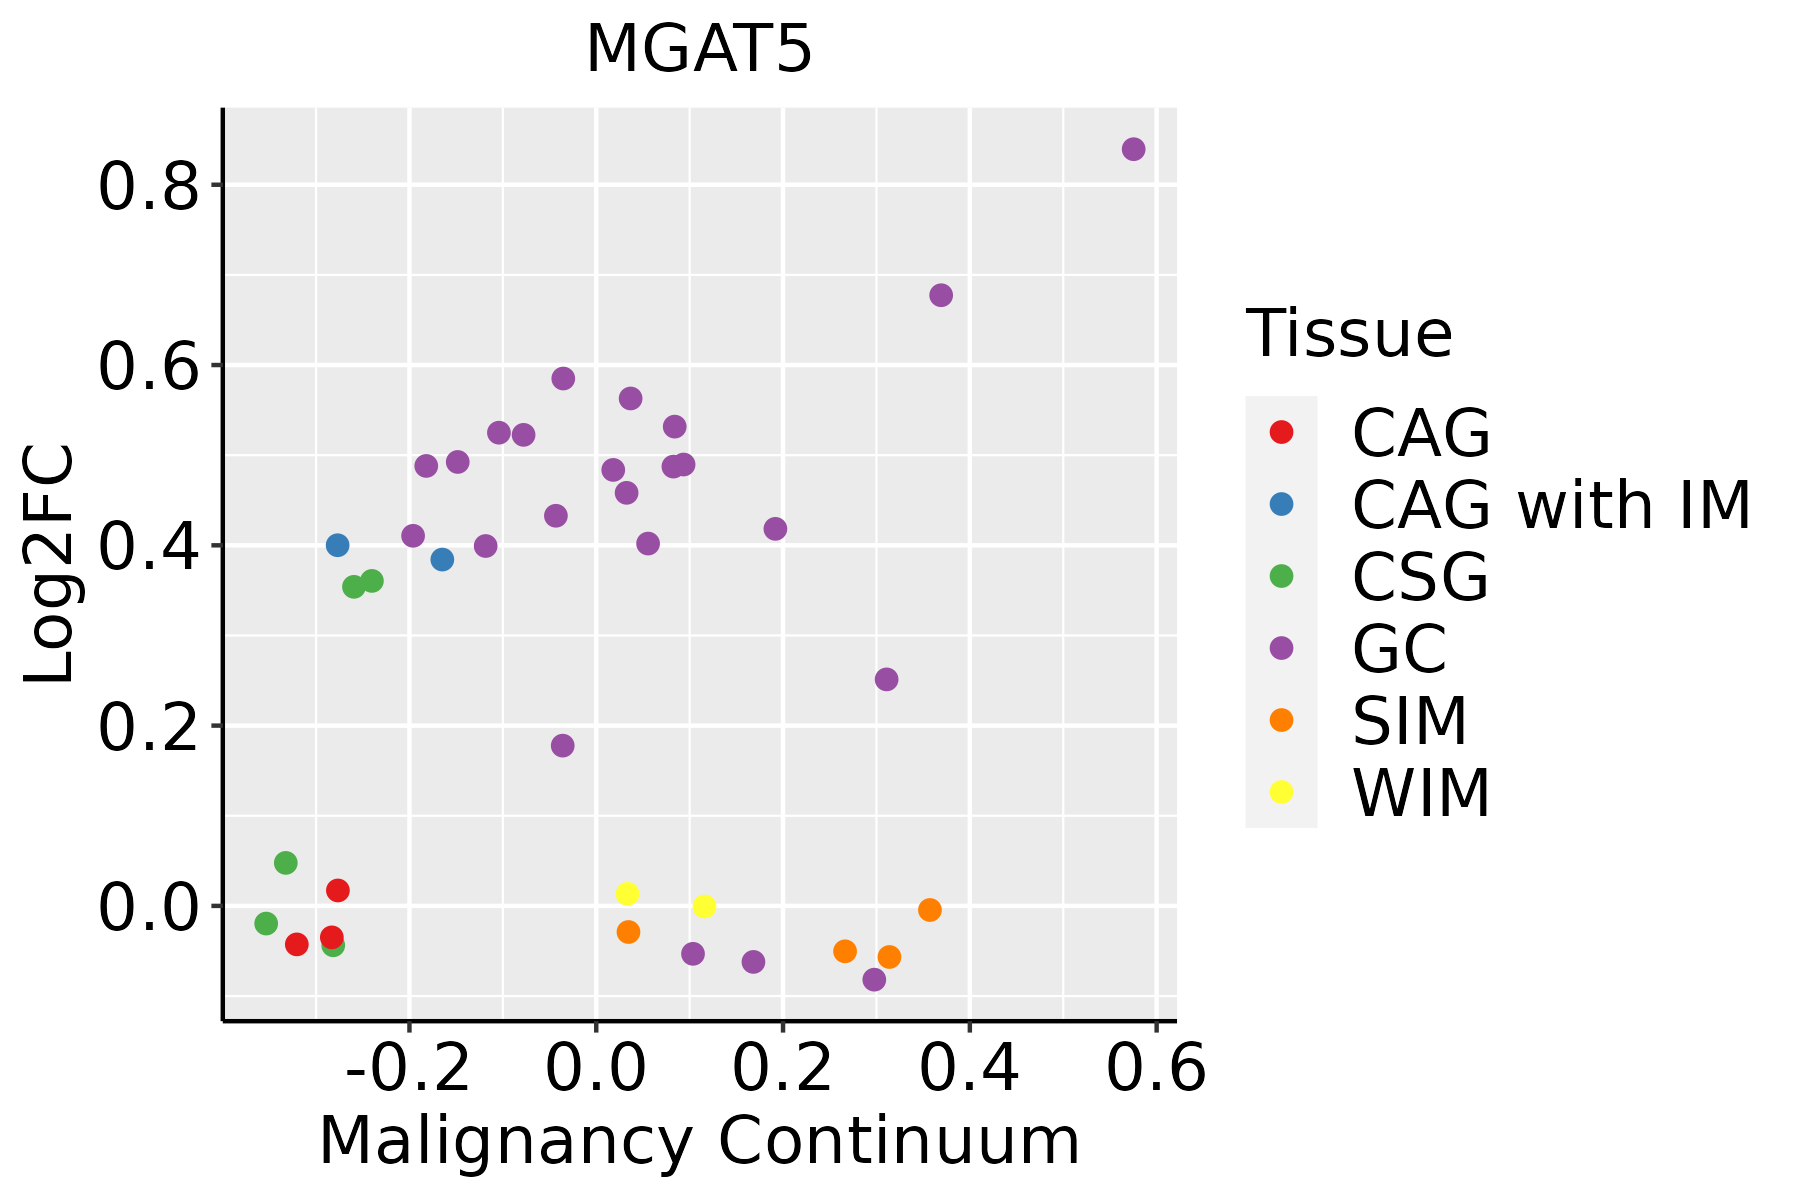 | CAG: Chronic atrophic gastritis |
| CAG with IM: Chronic atrophic gastritis with intestinal metaplasia | ||
| CSG: Chronic superficial gastritis | ||
| GC: Gastric cancer | ||
| SIM: Severe intestinal metaplasia | ||
| WIM: Wild intestinal metaplasia | ||
| Liver | 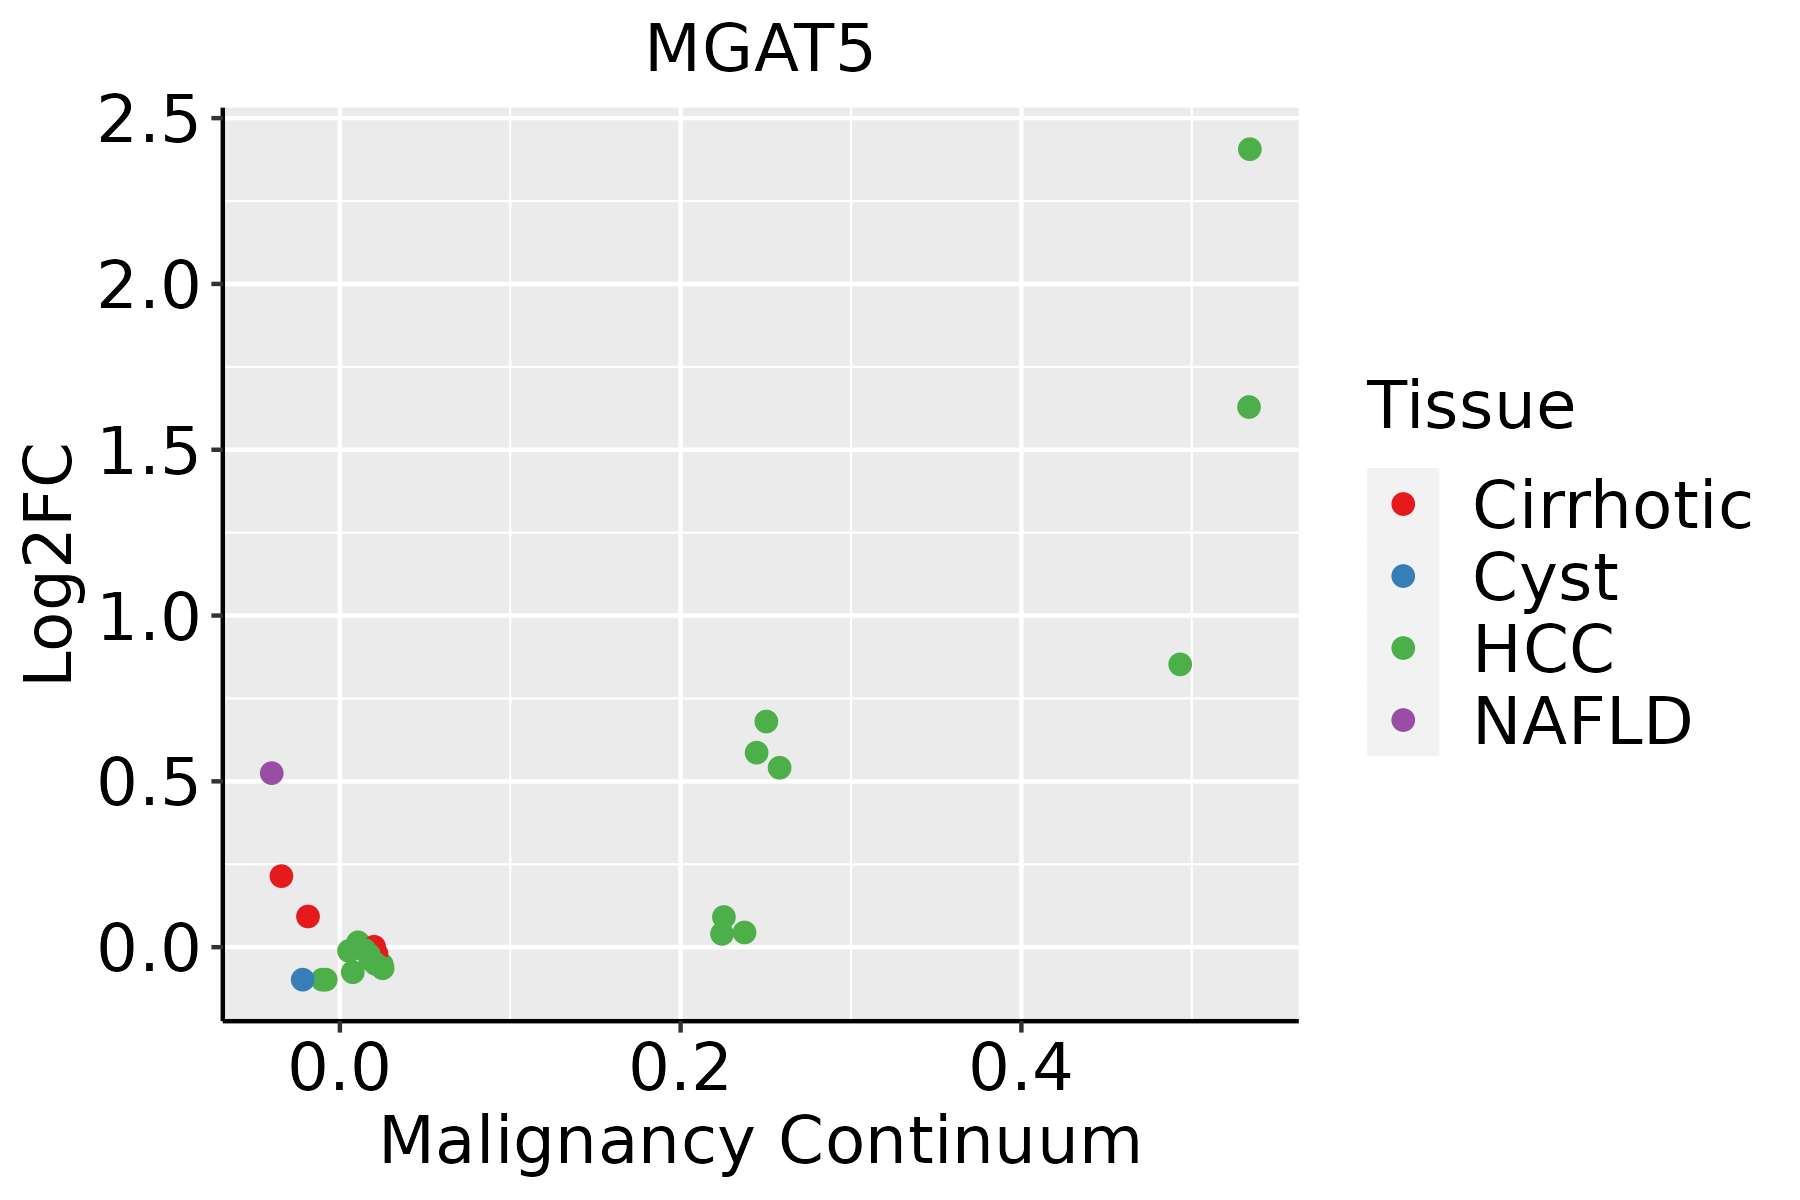 | HCC: Hepatocellular carcinoma |
| NAFLD: Non-alcoholic fatty liver disease | ||
| Lung |  | AAH: Atypical adenomatous hyperplasia |
| AIS: Adenocarcinoma in situ | ||
| IAC: Invasive lung adenocarcinoma | ||
| MIA: Minimally invasive adenocarcinoma | ||
| Thyroid | 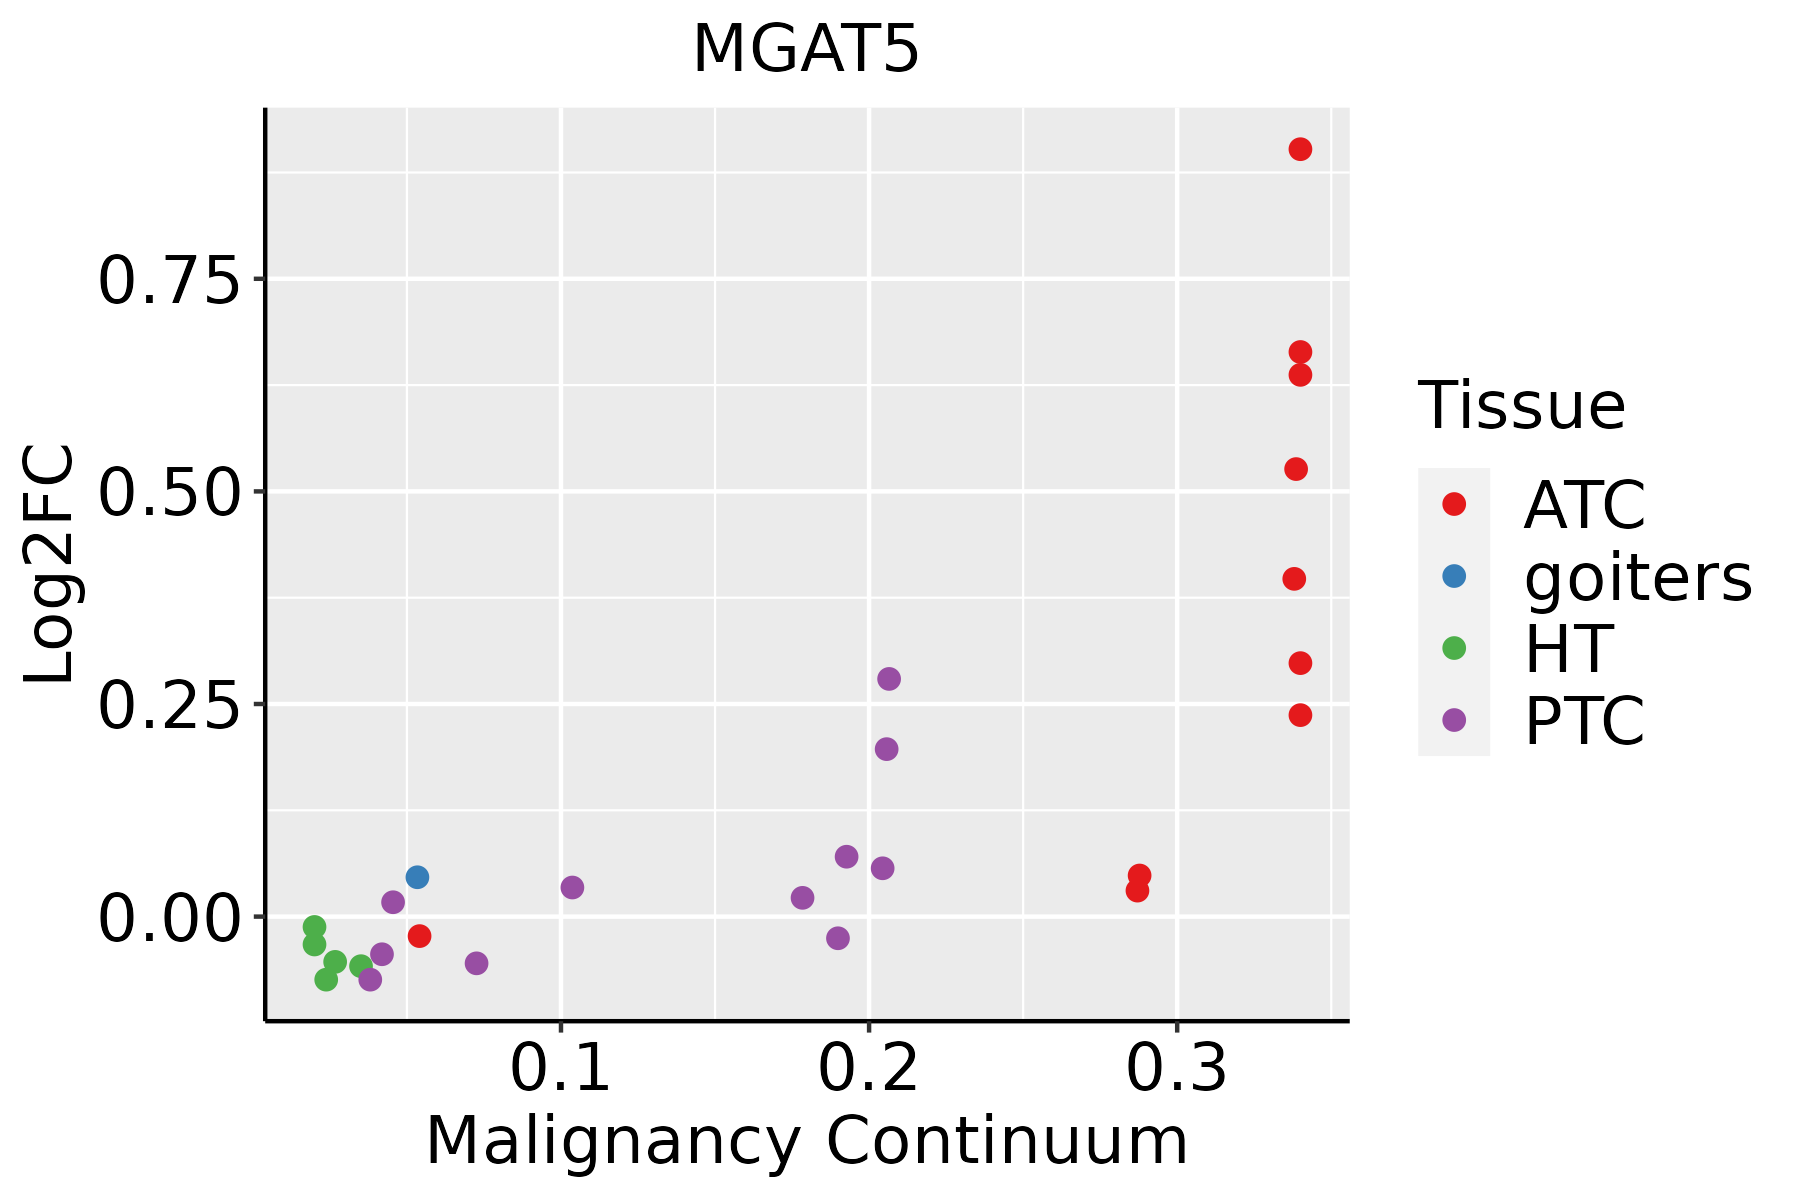 | ATC: Anaplastic thyroid cancer |
| HT: Hashimoto's thyroiditis | ||
| PTC: Papillary thyroid cancer |
| ∗log2FC in expression of this searched gene in stem-like cells from each diseased tissue sample relative to stem-like cells in normal samples in each tissue plotted against the malignancy continuum. Samples are colored based on if they are from different disease stage. |
Top |
Malignant transformation related pathway analysis |
| Find out the enriched GO biological processes and KEGG pathways involved in transition from healthy to precancer to cancer |
| Tissue | Disease Stage | Enriched GO biological Processes |
| Colorectum | AD |  |
| Colorectum | SER |  |
| Colorectum | MSS |  |
| Colorectum | MSI-H |  |
| Colorectum | FAP |  |
| ∗Top 15 enriched GO BP terms are showed in the bar plot of each disease state in each tissue. Each row represents a significant GO biological process which is colored according to the -log10(p.adjust). |
| Page: 1 2 3 4 5 6 7 8 9 |
| GO ID | Tissue | Disease Stage | Description | Gene Ratio | Bg Ratio | pvalue | p.adjust | Count |
| GO:0016032113 | Thyroid | PTC | viral process | 236/5968 | 415/18723 | 2.48e-26 | 8.24e-24 | 236 |
| GO:0010563113 | Thyroid | PTC | negative regulation of phosphorus metabolic process | 219/5968 | 442/18723 | 4.47e-15 | 3.07e-13 | 219 |
| GO:0045936113 | Thyroid | PTC | negative regulation of phosphate metabolic process | 218/5968 | 441/18723 | 7.08e-15 | 4.75e-13 | 218 |
| GO:0019080110 | Thyroid | PTC | viral gene expression | 65/5968 | 94/18723 | 1.25e-13 | 6.69e-12 | 65 |
| GO:003530427 | Thyroid | PTC | regulation of protein dephosphorylation | 51/5968 | 90/18723 | 1.01e-06 | 1.50e-05 | 51 |
| GO:003530324 | Thyroid | PTC | regulation of dephosphorylation | 67/5968 | 128/18723 | 1.19e-06 | 1.72e-05 | 67 |
| GO:001827915 | Thyroid | PTC | protein N-linked glycosylation via asparagine | 18/5968 | 23/18723 | 6.38e-06 | 7.63e-05 | 18 |
| GO:00064878 | Thyroid | PTC | protein N-linked glycosylation | 38/5968 | 65/18723 | 8.71e-06 | 9.94e-05 | 38 |
| GO:001631116 | Thyroid | PTC | dephosphorylation | 174/5968 | 417/18723 | 1.20e-05 | 1.31e-04 | 174 |
| GO:000647020 | Thyroid | PTC | protein dephosphorylation | 123/5968 | 281/18723 | 1.69e-05 | 1.77e-04 | 123 |
| GO:001819615 | Thyroid | PTC | peptidyl-asparagine modification | 18/5968 | 24/18723 | 1.79e-05 | 1.86e-04 | 18 |
| GO:001092116 | Thyroid | PTC | regulation of phosphatase activity | 44/5968 | 84/18723 | 7.53e-05 | 6.48e-04 | 44 |
| GO:004366620 | Thyroid | PTC | regulation of phosphoprotein phosphatase activity | 32/5968 | 58/18723 | 2.01e-04 | 1.50e-03 | 32 |
| GO:00190827 | Thyroid | PTC | viral protein processing | 18/5968 | 29/18723 | 7.83e-04 | 4.86e-03 | 18 |
| GO:00064866 | Thyroid | PTC | protein glycosylation | 94/5968 | 226/18723 | 1.25e-03 | 7.13e-03 | 94 |
| GO:00434136 | Thyroid | PTC | macromolecule glycosylation | 94/5968 | 226/18723 | 1.25e-03 | 7.13e-03 | 94 |
| GO:00353058 | Thyroid | PTC | negative regulation of dephosphorylation | 24/5968 | 45/18723 | 2.28e-03 | 1.20e-02 | 24 |
| GO:003530819 | Thyroid | PTC | negative regulation of protein dephosphorylation | 19/5968 | 34/18723 | 3.21e-03 | 1.57e-02 | 19 |
| GO:0051346112 | Thyroid | PTC | negative regulation of hydrolase activity | 146/5968 | 379/18723 | 3.33e-03 | 1.62e-02 | 146 |
| GO:00700855 | Thyroid | PTC | glycosylation | 96/5968 | 240/18723 | 4.57e-03 | 2.15e-02 | 96 |
| Page: 1 2 3 4 5 6 7 8 9 10 11 12 13 14 |
| Pathway ID | Tissue | Disease Stage | Description | Gene Ratio | Bg Ratio | pvalue | p.adjust | qvalue | Count |
| hsa00510 | Colorectum | AD | N-Glycan biosynthesis | 21/2092 | 53/8465 | 1.15e-02 | 4.24e-02 | 2.71e-02 | 21 |
| hsa005101 | Colorectum | AD | N-Glycan biosynthesis | 21/2092 | 53/8465 | 1.15e-02 | 4.24e-02 | 2.71e-02 | 21 |
| hsa005102 | Colorectum | MSS | N-Glycan biosynthesis | 20/1875 | 53/8465 | 7.17e-03 | 2.83e-02 | 1.73e-02 | 20 |
| hsa005103 | Colorectum | MSS | N-Glycan biosynthesis | 20/1875 | 53/8465 | 7.17e-03 | 2.83e-02 | 1.73e-02 | 20 |
| hsa0051023 | Esophagus | ESCC | N-Glycan biosynthesis | 39/4205 | 53/8465 | 3.26e-04 | 1.15e-03 | 5.89e-04 | 39 |
| hsa0051033 | Esophagus | ESCC | N-Glycan biosynthesis | 39/4205 | 53/8465 | 3.26e-04 | 1.15e-03 | 5.89e-04 | 39 |
| hsa0051021 | Liver | HCC | N-Glycan biosynthesis | 40/4020 | 53/8465 | 2.95e-05 | 1.87e-04 | 1.04e-04 | 40 |
| hsa0051031 | Liver | HCC | N-Glycan biosynthesis | 40/4020 | 53/8465 | 2.95e-05 | 1.87e-04 | 1.04e-04 | 40 |
| Page: 1 |
Top |
Cell-cell communication analysis |
| Identification of potential cell-cell interactions between two cell types and their ligand-receptor pairs for different disease states |
| Ligand | Receptor | LRpair | Pathway | Tissue | Disease Stage |
| Page: 1 |
Top |
Single-cell gene regulatory network inference analysis |
| Find out the significant the regulons (TFs) and the target genes of each regulon across cell types for different disease states |
| TF | Cell Type | Tissue | Disease Stage | Target Gene | RSS | Regulon Activity |
| ∗The dot plots of a searched regulon are shown for all cell subpopulations in each disease state of each tissue based on the regulon specific score inferred using pySCENIC and by calculating the average expression. |
| Page: 1 |
Top |
Somatic mutation of malignant transformation related genes |
| Annotation of somatic variants for genes involved in malignant transformation |
| Hugo Symbol | Variant Class | Variant Classification | dbSNP RS | HGVSc | HGVSp | HGVSp Short | SWISSPROT | BIOTYPE | SIFT | PolyPhen | Tumor Sample Barcode | Tissue | Histology | Sex | Age | Stage | Therapy Types | Drugs | Outcome |
| MGAT5 | SNV | Missense_Mutation | rs375709714 | c.700N>A | p.Glu234Lys | p.E234K | Q09328 | protein_coding | tolerated(0.2) | probably_damaging(0.991) | TCGA-3C-AAAU-01 | Breast | breast invasive carcinoma | Female | <65 | I/II | Chemotherapy | zoladex | SD |
| MGAT5 | SNV | Missense_Mutation | novel | c.133A>C | p.Met45Leu | p.M45L | Q09328 | protein_coding | tolerated(0.25) | benign(0.001) | TCGA-A8-A0A4-01 | Breast | breast invasive carcinoma | Female | >=65 | I/II | Hormone Therapy | tamoxiphen | CR |
| MGAT5 | SNV | Missense_Mutation | rs548835362 | c.110N>A | p.Arg37Gln | p.R37Q | Q09328 | protein_coding | tolerated(0.12) | benign(0.003) | TCGA-A8-A0A7-01 | Breast | breast invasive carcinoma | Female | <65 | I/II | Unknown | Unknown | SD |
| MGAT5 | SNV | Missense_Mutation | c.1080N>C | p.Lys360Asn | p.K360N | Q09328 | protein_coding | tolerated(0.06) | probably_damaging(0.994) | TCGA-AC-A23H-01 | Breast | breast invasive carcinoma | Female | >=65 | I/II | Unknown | Unknown | PD | |
| MGAT5 | SNV | Missense_Mutation | rs755158785 | c.742G>A | p.Ala248Thr | p.A248T | Q09328 | protein_coding | tolerated(0.4) | benign(0.003) | TCGA-AC-A62V-01 | Breast | breast invasive carcinoma | Male | <65 | III/IV | Targeted Molecular therapy | denosumab | PD |
| MGAT5 | SNV | Missense_Mutation | novel | c.1304N>T | p.Ser435Ile | p.S435I | Q09328 | protein_coding | deleterious(0.01) | probably_damaging(0.994) | TCGA-D8-A27R-01 | Breast | breast invasive carcinoma | Female | <65 | III/IV | Chemotherapy | adriamycin+cyclophosphamide | SD |
| MGAT5 | SNV | Missense_Mutation | rs376303600 | c.1181C>T | p.Ser394Leu | p.S394L | Q09328 | protein_coding | tolerated(0.86) | benign(0.007) | TCGA-E9-A295-01 | Breast | breast invasive carcinoma | Female | >=65 | I/II | Hormone Therapy | tamoxiphen | SD |
| MGAT5 | insertion | Frame_Shift_Ins | novel | c.135_136insTTAACACACGCAGACGCACA | p.Arg47ThrfsTer38 | p.R47Tfs*38 | Q09328 | protein_coding | TCGA-A8-A0A4-01 | Breast | breast invasive carcinoma | Female | >=65 | I/II | Hormone Therapy | tamoxiphen | CR | ||
| MGAT5 | insertion | In_Frame_Ins | novel | c.514_515insTTTTCATTGCTGAGGTTCAGTGTGGTCAAG | p.Cys172delinsPhePheIleAlaGluValGlnCysGlyGlnGly | p.C172delinsFFIAEVQCGQG | Q09328 | protein_coding | TCGA-A8-A0A9-01 | Breast | breast invasive carcinoma | Female | >=65 | I/II | Hormone Therapy | anastrozole | SD | ||
| MGAT5 | insertion | In_Frame_Ins | novel | c.1901_1902insTGGAAG | p.Pro634_Leu635insGlySer | p.P634_L635insGS | Q09328 | protein_coding | TCGA-AO-A0JB-01 | Breast | breast invasive carcinoma | Female | <65 | III/IV | Chemotherapy | cyclophosphamide | SD |
| Page: 1 2 3 4 5 6 7 8 9 10 11 |
Top |
Related drugs of malignant transformation related genes |
| Identification of chemicals and drugs interact with genes involved in malignant transfromation |
| (DGIdb 4.0) |
| Entrez ID | Symbol | Category | Interaction Types | Drug Claim Name | Drug Name | PMIDs |
| Page: 1 |

Copyright 2023-Present -The University of Texas Health Science Center at Houston |