Schematic overview of the cellular and molecular mechanisms involved in the cancer progression, including the proposed cellular and molecular mechanisms in cancer cells trajectory. AT1: alveolar type 1 cells; AT2: alveolar type 2 cells; AAH: atypical adenomatous hyperplasia; AIS: adenocarcinoma in situ; MIA: minimally invasive adenocarcinoma; IA: invasive adenocarcinoma; EMT: epithelial-mesenchymal transition

Home

Download

Statistics

Help

Contact

Center for Computational Systems Medicine
leaf

Gene summary

leaf

Malignant transformation analysis

leaf

Malignant transformation related pathway analysis

leaf

Cell-cell communication analysis

leaf

Single-cell gene regulatory network inference analysis

leaf

Somatic mutation of malignant transformation related genes

leaf

Related drugs of malignant transformation related genes

Gene: MAFB

Gene summary for MAFB

check button Gene summary.

Gene informationSpeciesHuman
Gene symbol

MAFB

Gene ID

9935

Gene nameMAF bZIP transcription factor B
Gene AliasDURS3
Cytomap20q12
Gene Typeprotein-coding
GO ID

GO:0001775

UniProtAcc

Q9Y5Q3


Top

Malignant transformation analysis

check button Identification of the aberrant gene expression in precancerous and cancerous lesions by comparing the gene expression of stem-like cells in diseased tissues with normal stem cells
check button Malignant transformation involving gene list.
Entrez IDSymbolReplicatesSpeciesOrganTissueAdj P-valueLog2FCMalignancy
9935MAFBGSM4909280HumanBreastPrecancer5.81e-047.33e-010.0305
9935MAFBGSM4909282HumanBreastIDC1.48e-277.71e-01-0.0288
9935MAFBGSM4909286HumanBreastIDC7.83e-11-3.72e-010.1081
9935MAFBGSM4909287HumanBreastIDC6.96e-03-3.06e-010.2057
9935MAFBGSM4909296HumanBreastIDC9.99e-03-2.58e-010.1524
9935MAFBGSM4909298HumanBreastIDC3.44e-02-3.73e-020.1551
9935MAFBGSM4909301HumanBreastIDC5.15e-08-3.22e-010.1577
9935MAFBGSM4909311HumanBreastIDC7.05e-10-3.48e-010.1534
9935MAFBGSM4909312HumanBreastIDC1.11e-02-2.89e-010.1552
9935MAFBGSM4909319HumanBreastIDC1.68e-09-3.62e-010.1563
9935MAFBbrca2HumanBreastPrecancer5.07e-03-2.51e-01-0.024
9935MAFBbrca10HumanBreastPrecancer3.81e-04-3.31e-01-0.0029
9935MAFBP1HumanBreastIDC1.33e-06-3.05e-010.1527
9935MAFBDCIS2HumanBreastDCIS1.05e-389.93e-020.0085
9935MAFBAEH-subject1HumanEndometriumAEH1.96e-287.92e-01-0.3059
9935MAFBAEH-subject2HumanEndometriumAEH7.96e-155.48e-01-0.2525
9935MAFBAEH-subject3HumanEndometriumAEH1.77e-114.55e-01-0.2576
9935MAFBEEC-subject2HumanEndometriumEEC1.74e-063.53e-01-0.2607
9935MAFBEEC-subject3HumanEndometriumEEC1.04e-06-1.35e-01-0.2525
9935MAFBGSM6177620_NYU_UCEC1_lib1_lib1HumanEndometriumEEC5.40e-03-4.65e-02-0.1869
Page: 1 2 3 4 5 6 7 8 

check button Transcriptomic changes along malignancy continuum.
TissueExpression DynamicsAbbreviation
BreastThe image shows the transcriptomic changes along malignancy continuum.log2FC in expression of this searched gene in stem-like cells from each diseased tissue sample relative to stem-like cells in normal samples in each tissue plotted against the malignancy continuum. Samples are colored based on if they are from different disease stage.
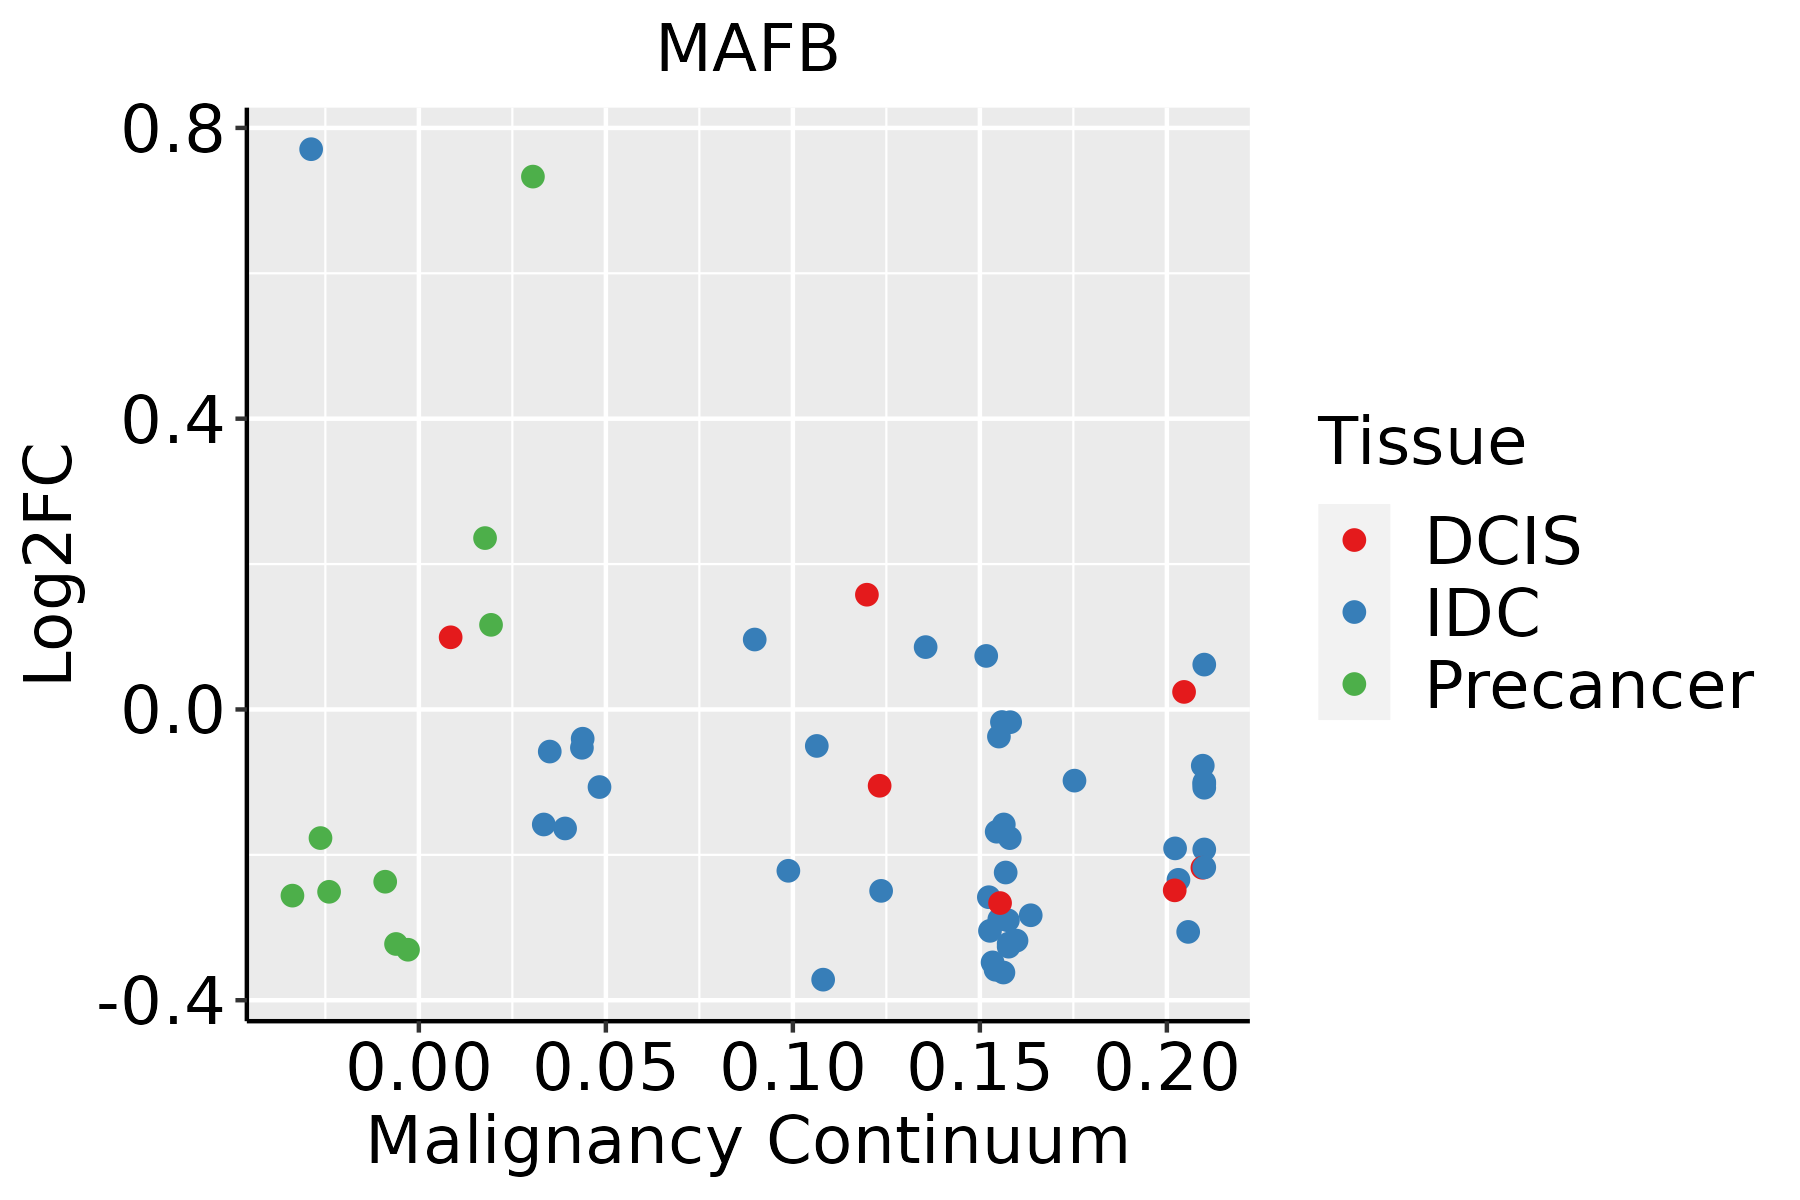
IDC: Invasive ductal carcinoma
DCIS: Ductal carcinoma in situ
Precancer(BRCA1-mut): Precancerous lesion from BRCA1 mutation carriers
EndometriumThe image shows the transcriptomic changes along malignancy continuum.log2FC in expression of this searched gene in stem-like cells from each diseased tissue sample relative to stem-like cells in normal samples in each tissue plotted against the malignancy continuum. Samples are colored based on if they are from different disease stage.
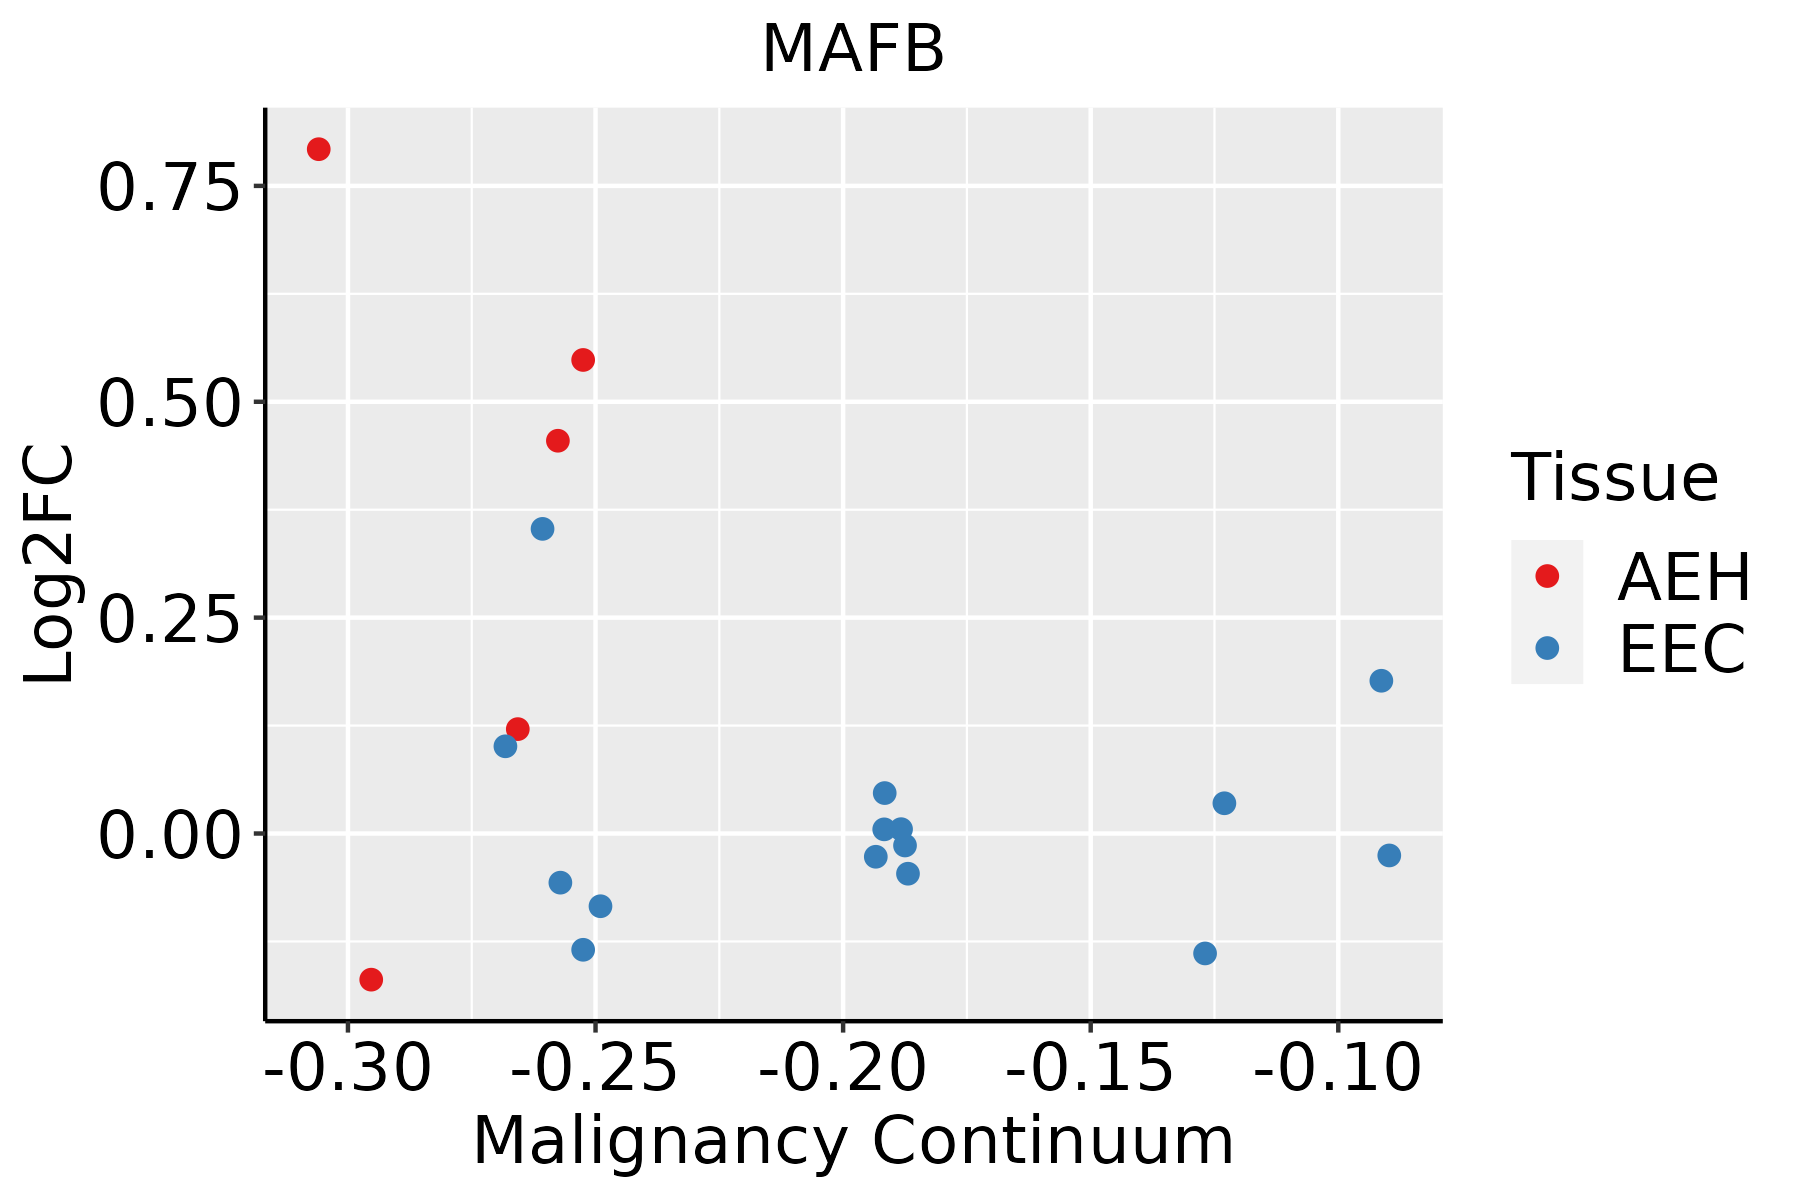
AEH: Atypical endometrial hyperplasia
EEC: Endometrioid Cancer
EsophagusThe image shows the transcriptomic changes along malignancy continuum.log2FC in expression of this searched gene in stem-like cells from each diseased tissue sample relative to stem-like cells in normal samples in each tissue plotted against the malignancy continuum. Samples are colored based on if they are from different disease stage.
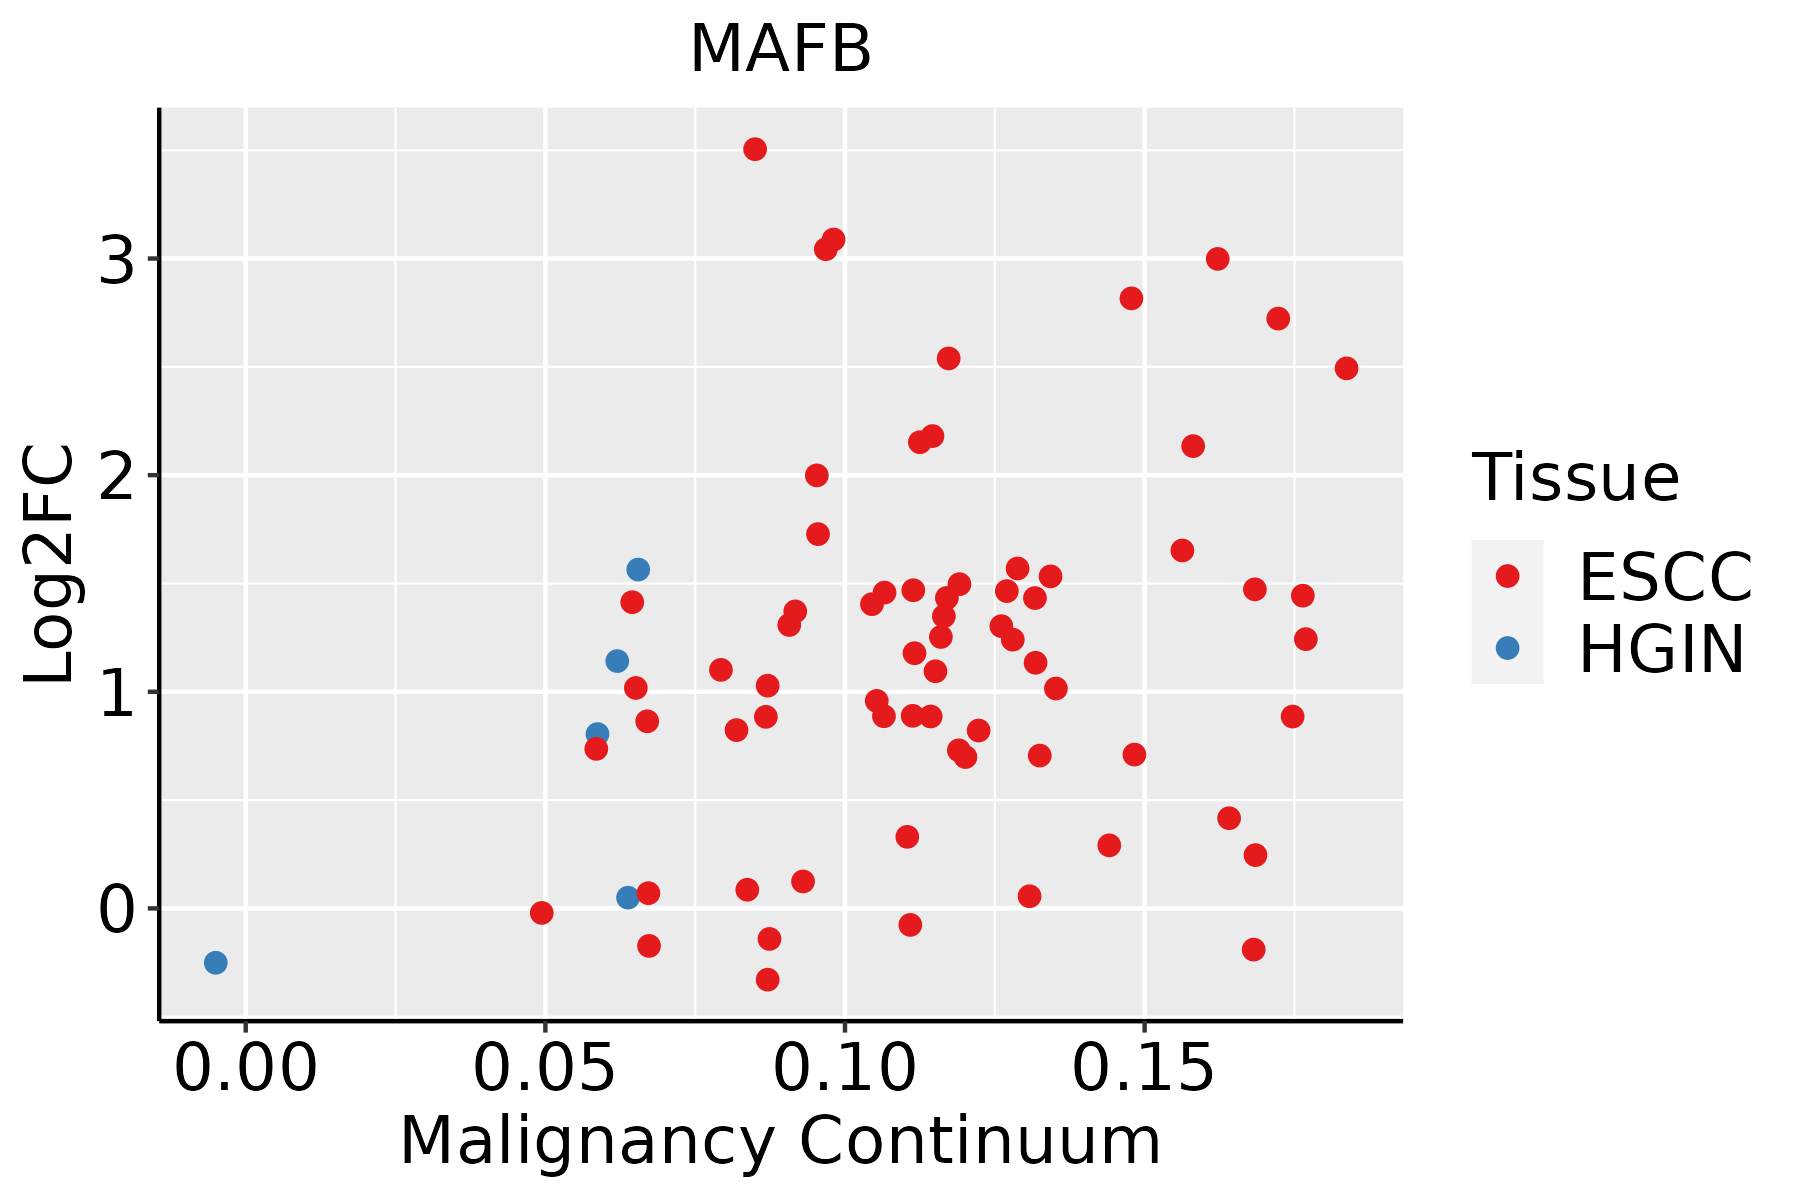
ESCC: Esophageal squamous cell carcinoma
HGIN: High-grade intraepithelial neoplasias
LGIN: Low-grade intraepithelial neoplasias
LiverThe image shows the transcriptomic changes along malignancy continuum.log2FC in expression of this searched gene in stem-like cells from each diseased tissue sample relative to stem-like cells in normal samples in each tissue plotted against the malignancy continuum. Samples are colored based on if they are from different disease stage.
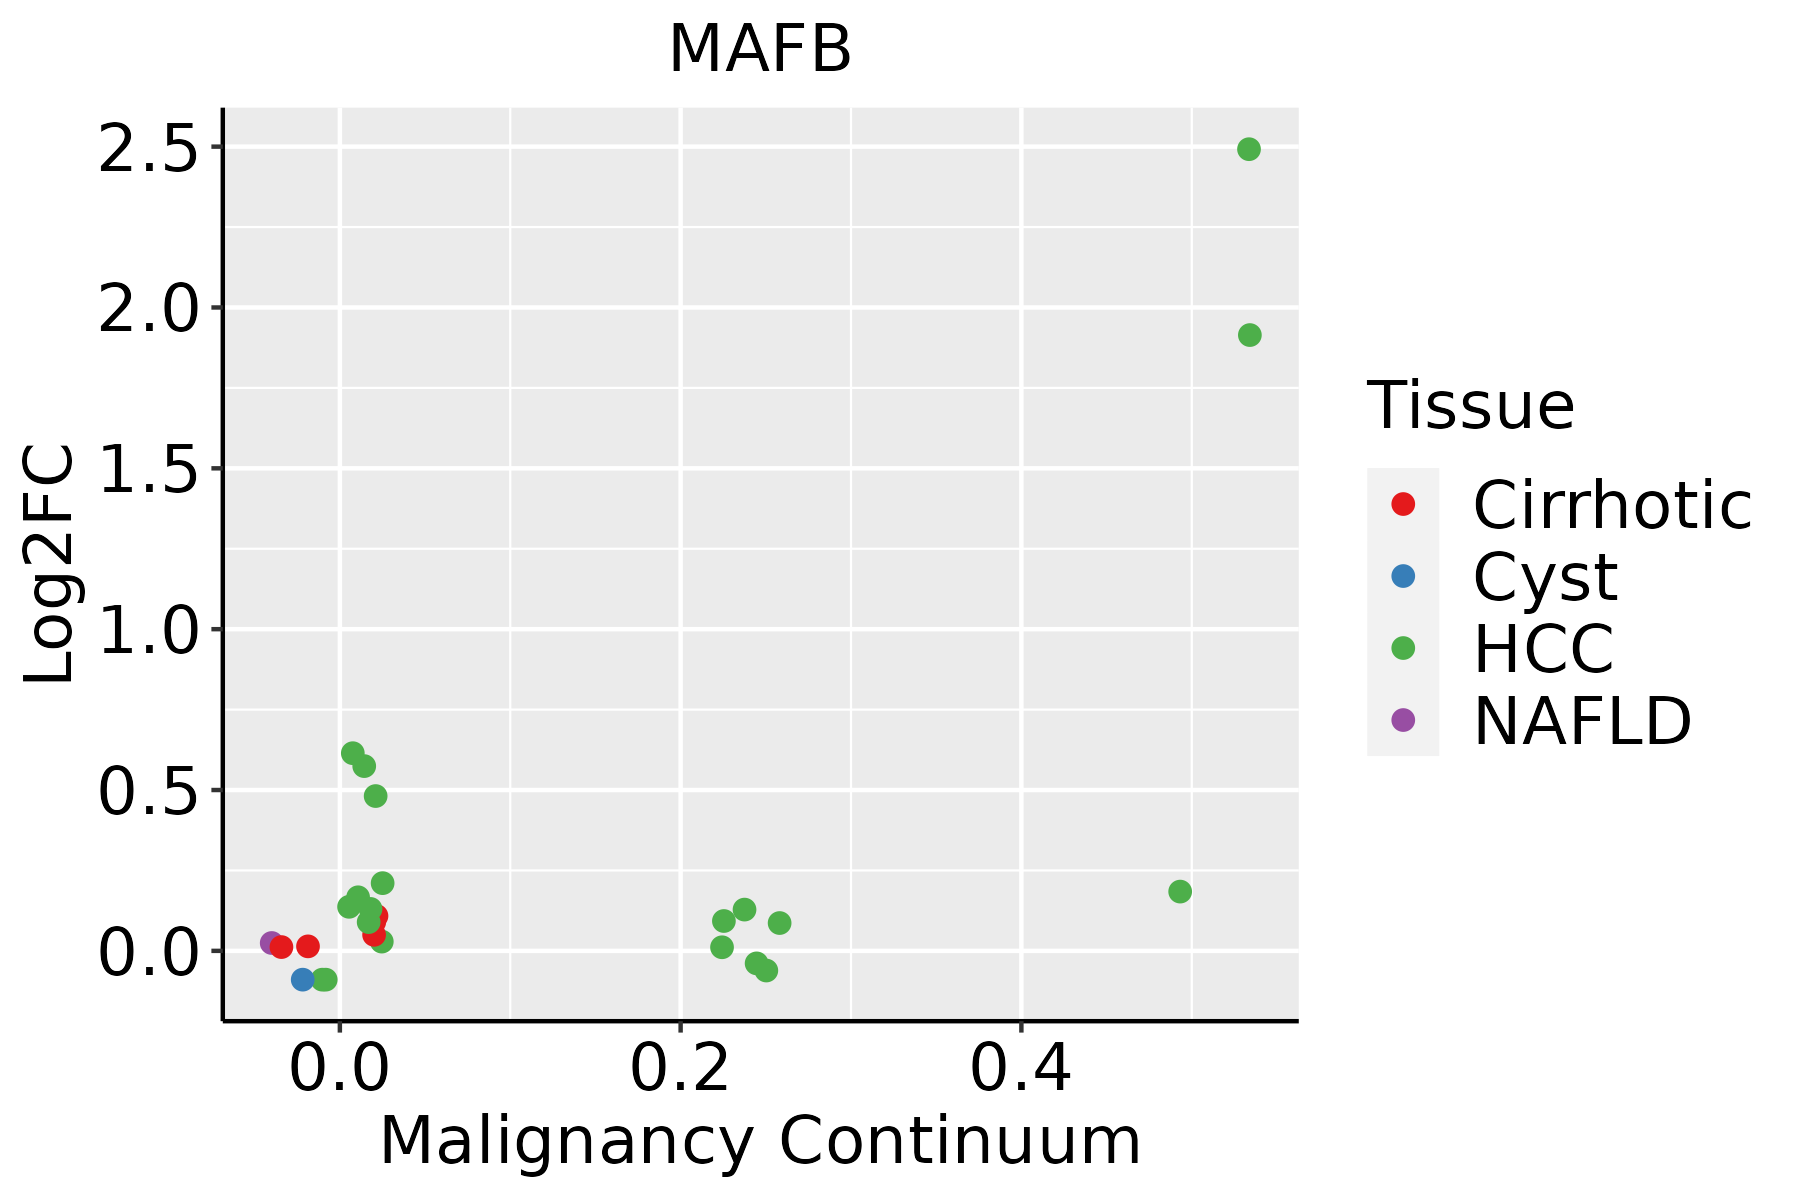
HCC: Hepatocellular carcinoma
NAFLD: Non-alcoholic fatty liver disease
LungThe image shows the transcriptomic changes along malignancy continuum.log2FC in expression of this searched gene in stem-like cells from each diseased tissue sample relative to stem-like cells in normal samples in each tissue plotted against the malignancy continuum. Samples are colored based on if they are from different disease stage.
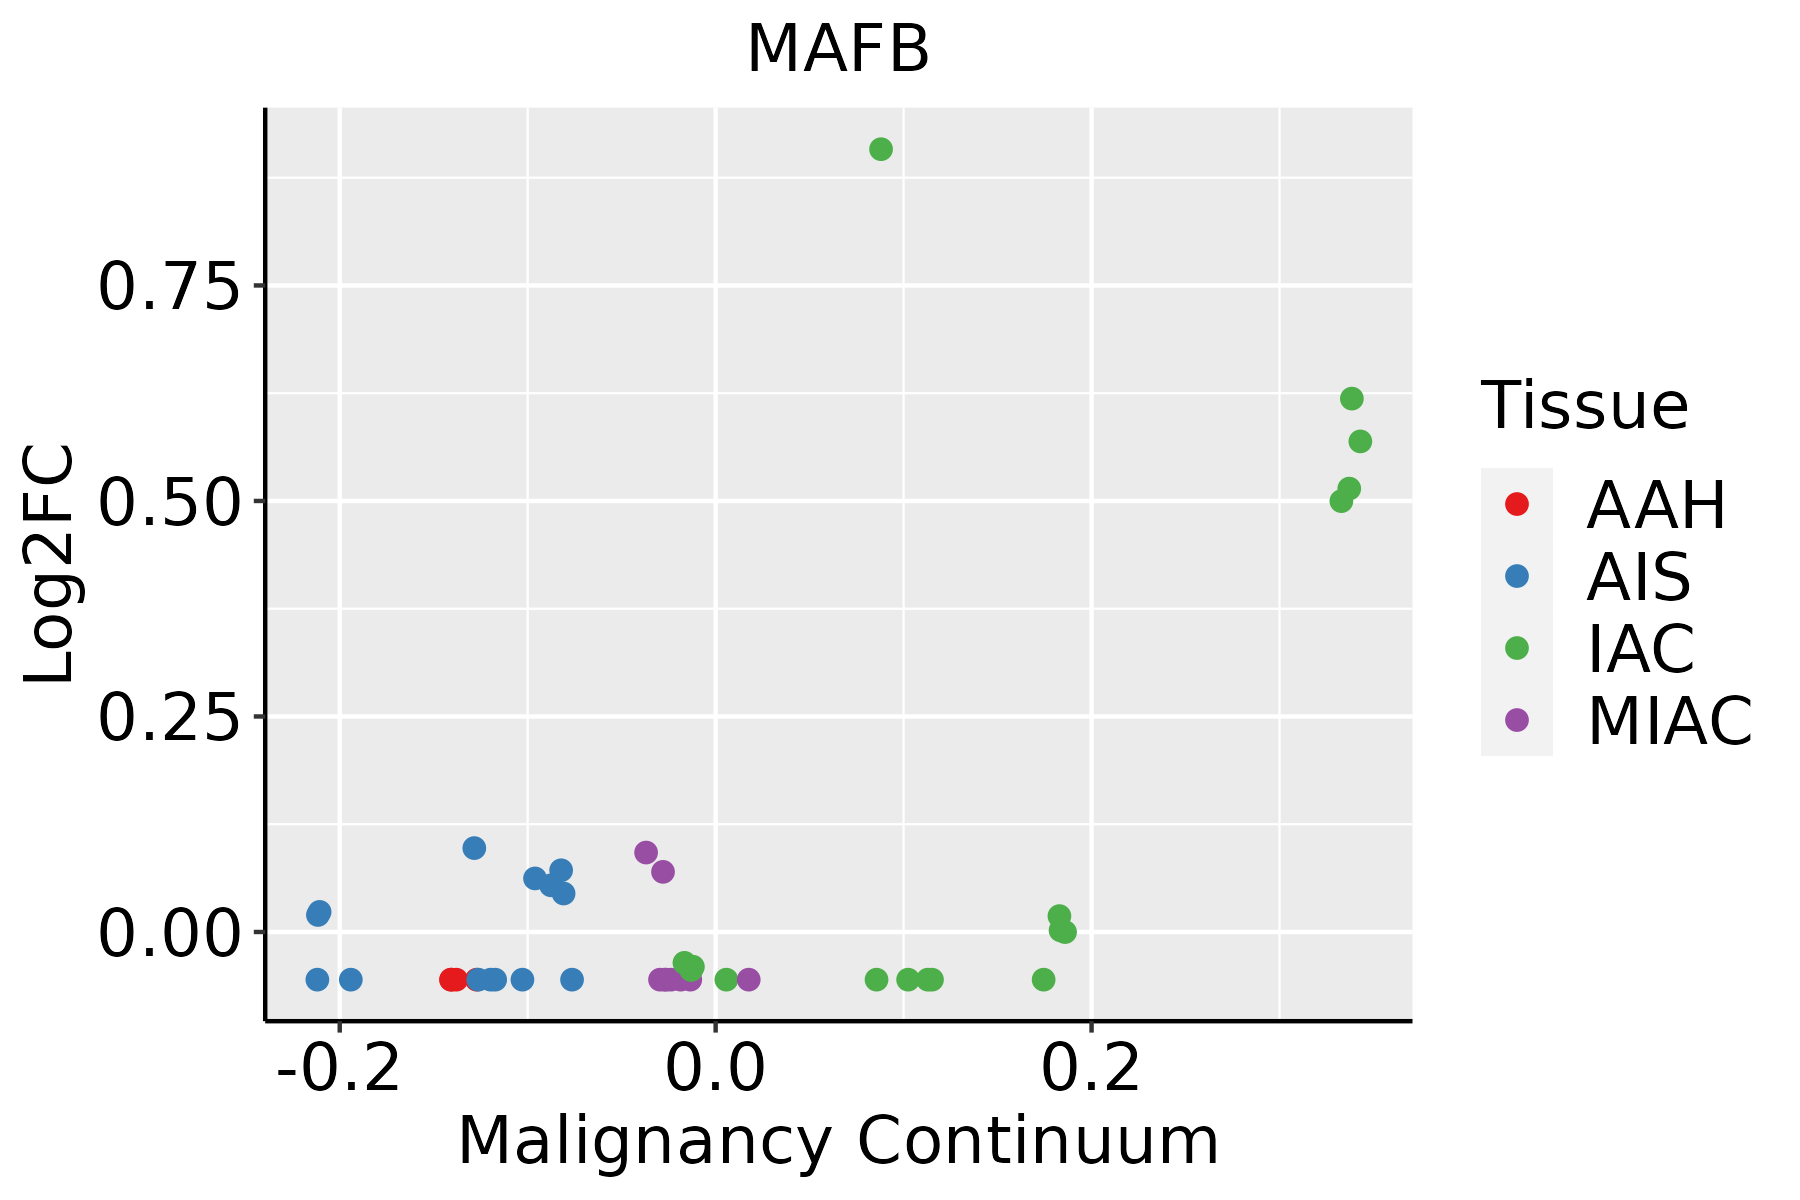
AAH: Atypical adenomatous hyperplasia
AIS: Adenocarcinoma in situ
IAC: Invasive lung adenocarcinoma
MIA: Minimally invasive adenocarcinoma
Oral CavityThe image shows the transcriptomic changes along malignancy continuum.log2FC in expression of this searched gene in stem-like cells from each diseased tissue sample relative to stem-like cells in normal samples in each tissue plotted against the malignancy continuum. Samples are colored based on if they are from different disease stage.
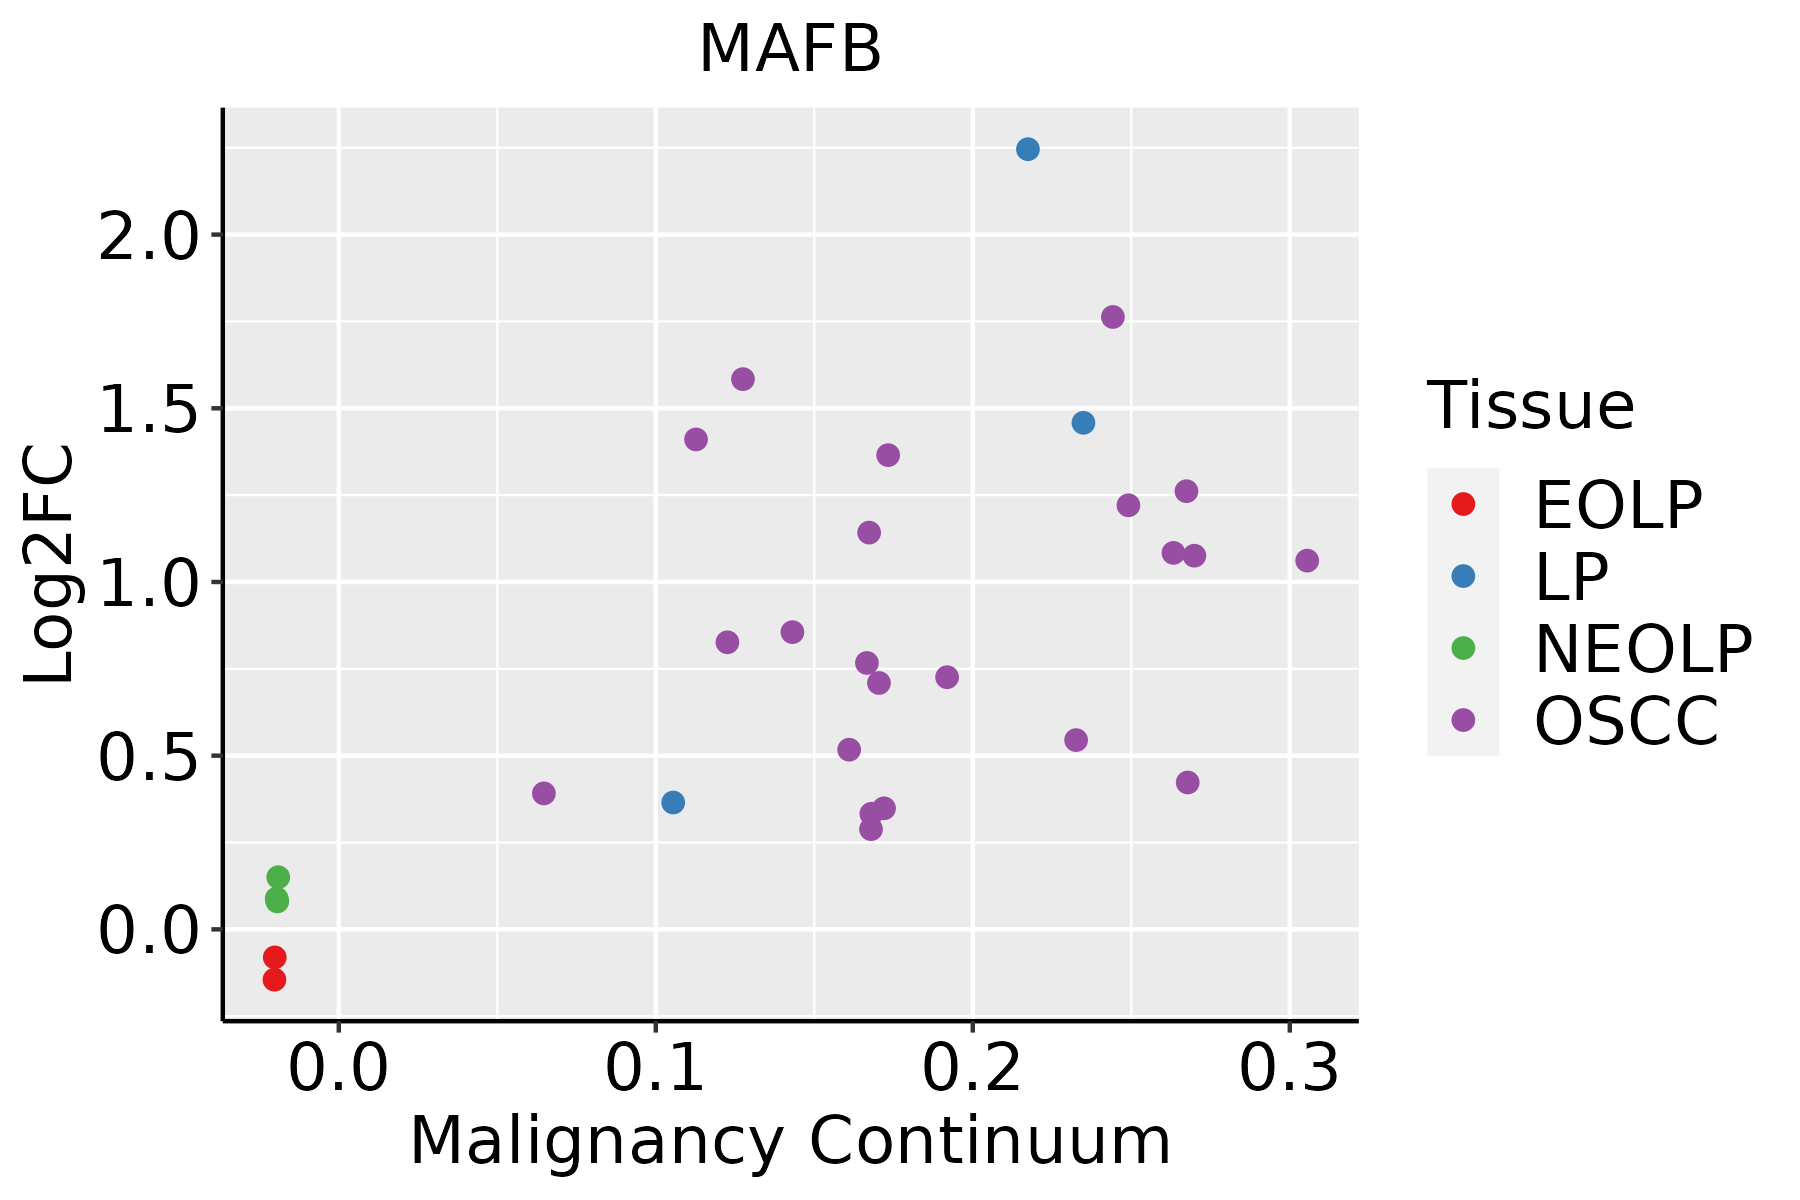
EOLP: Erosive Oral lichen planus
LP: leukoplakia
NEOLP: Non-erosive oral lichen planus
OSCC: Oral squamous cell carcinoma
ProstateThe image shows the transcriptomic changes along malignancy continuum.log2FC in expression of this searched gene in stem-like cells from each diseased tissue sample relative to stem-like cells in normal samples in each tissue plotted against the malignancy continuum. Samples are colored based on if they are from different disease stage.
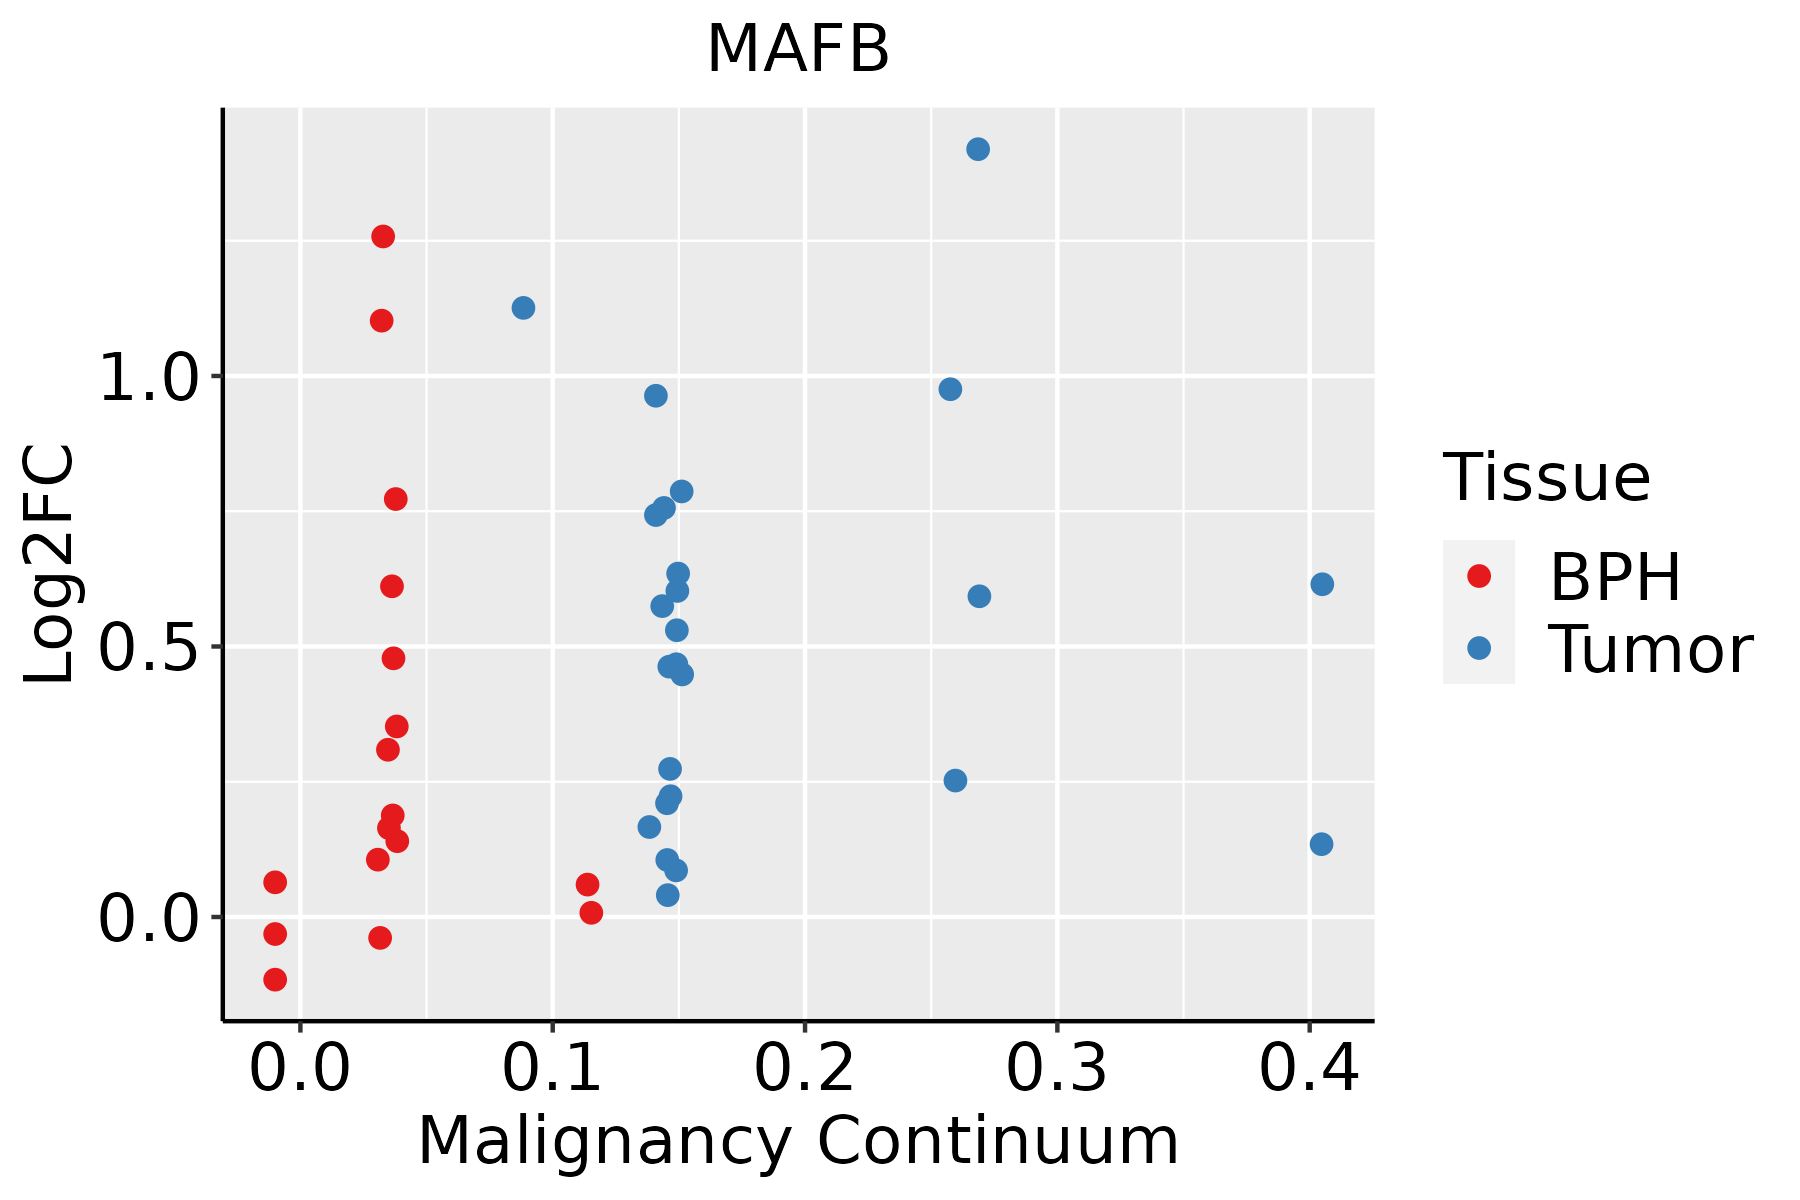
BPH: Benign Prostatic Hyperplasia
SkinThe image shows the transcriptomic changes along malignancy continuum.log2FC in expression of this searched gene in stem-like cells from each diseased tissue sample relative to stem-like cells in normal samples in each tissue plotted against the malignancy continuum. Samples are colored based on if they are from different disease stage.AK: Actinic keratosis
cSCC: Cutaneous squamous cell carcinoma
SCCIS:squamous cell carcinoma in situ
ThyroidThe image shows the transcriptomic changes along malignancy continuum.log2FC in expression of this searched gene in stem-like cells from each diseased tissue sample relative to stem-like cells in normal samples in each tissue plotted against the malignancy continuum. Samples are colored based on if they are from different disease stage.
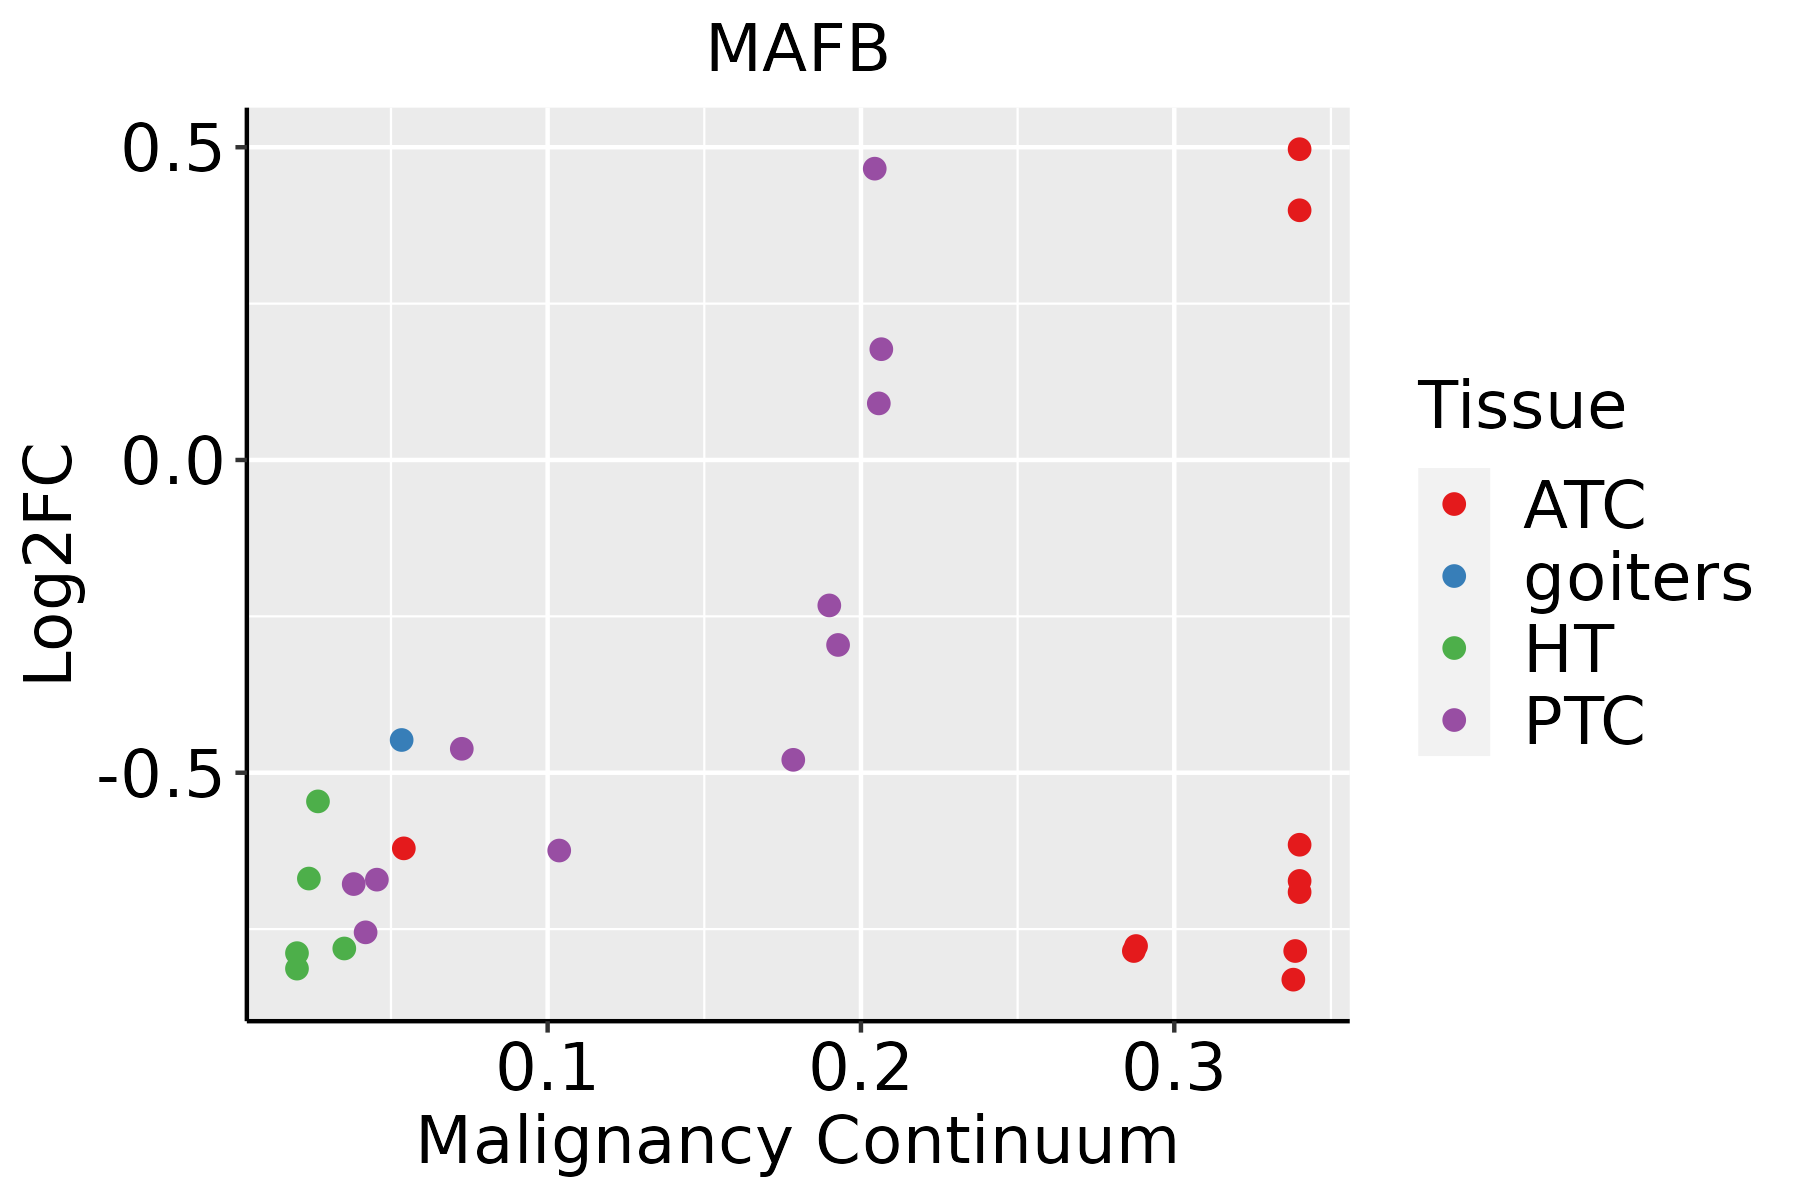
ATC: Anaplastic thyroid cancer
HT: Hashimoto's thyroiditis
PTC: Papillary thyroid cancer
∗log2FC in expression of this searched gene in stem-like cells from each diseased tissue sample relative to stem-like cells in normal samples in each tissue plotted against the malignancy continuum. Samples are colored based on if they are from different disease stage.

Top

Malignant transformation related pathway analysis

check buttonFind out the enriched GO biological processes and KEGG pathways involved in transition from healthy to precancer to cancer
check button Figure of enriched GO biological processes.
TissueDisease StageEnriched GO biological Processes
ColorectumADGO analysis - Figure of enriched GO biological processes: Top 15 enriched GO BP terms are showed in the bar plot of each disease state in each tissue. Each row represents a significant GO biological process which is colored according to the -log10(p.adjust).
ColorectumSERGO analysis - Figure of enriched GO biological processes: Top 15 enriched GO BP terms are showed in the bar plot of each disease state in each tissue. Each row represents a significant GO biological process which is colored according to the -log10(p.adjust).
ColorectumMSSGO analysis - Figure of enriched GO biological processes: Top 15 enriched GO BP terms are showed in the bar plot of each disease state in each tissue. Each row represents a significant GO biological process which is colored according to the -log10(p.adjust).
ColorectumMSI-HGO analysis - Figure of enriched GO biological processes: Top 15 enriched GO BP terms are showed in the bar plot of each disease state in each tissue. Each row represents a significant GO biological process which is colored according to the -log10(p.adjust).
ColorectumFAPGO analysis - Figure of enriched GO biological processes: Top 15 enriched GO BP terms are showed in the bar plot of each disease state in each tissue. Each row represents a significant GO biological process which is colored according to the -log10(p.adjust).
∗Top 15 enriched GO BP terms are showed in the bar plot of each disease state in each tissue. Each row represents a significant GO biological process which is colored according to the -log10(p.adjust).
Page: 1 2 3 4 5 6 7 8 9 

check button Enriched GO biological processes.
GO IDTissueDisease StageDescriptionGene RatioBg Ratiopvaluep.adjustCount
GO:190210524SkincSCCregulation of leukocyte differentiation92/4864279/187235.20e-032.63e-0292
GO:0045646110SkincSCCregulation of erythrocyte differentiation20/486447/187239.84e-034.34e-0220
GO:000276123SkincSCCregulation of myeloid leukocyte differentiation43/4864120/187231.06e-024.66e-0243
GO:004211020ThyroidHTT cell activation63/1272487/187235.95e-072.51e-0563
GO:003410130ThyroidHTerythrocyte homeostasis24/1272129/187235.57e-061.68e-0424
GO:19031319ThyroidHTmononuclear cell differentiation54/1272426/187236.88e-062.00e-0454
GO:000226230ThyroidHTmyeloid cell homeostasis27/1272157/187236.97e-062.01e-0427
GO:004887230ThyroidHThomeostasis of number of cells38/1272272/187231.82e-054.31e-0438
GO:190370627ThyroidHTregulation of hemopoiesis47/1272367/187232.05e-054.68e-0447
GO:004873228ThyroidHTgland development53/1272436/187232.71e-055.97e-0453
GO:00300986ThyroidHTlymphocyte differentiation47/1272374/187233.32e-057.02e-0447
GO:000268319ThyroidHTnegative regulation of immune system process52/1272434/187234.74e-059.49e-0452
GO:004564624ThyroidHTregulation of erythrocyte differentiation12/127247/187235.17e-051.02e-0312
GO:003021829ThyroidHTerythrocyte differentiation21/1272120/187235.43e-051.06e-0321
GO:003009930ThyroidHTmyeloid cell differentiation45/1272381/187232.07e-043.00e-0345
GO:190210517ThyroidHTregulation of leukocyte differentiation35/1272279/187233.32e-044.28e-0335
GO:004563728ThyroidHTregulation of myeloid cell differentiation28/1272210/187234.77e-045.78e-0328
GO:004544417ThyroidHTfat cell differentiation29/1272229/187238.88e-049.30e-0329
GO:00302178ThyroidHTT cell differentiation31/1272257/187231.35e-031.29e-0231
GO:000257320ThyroidHTmyeloid leukocyte differentiation24/1272208/187237.69e-034.54e-0224
Page: 1 2 3 4 5 6 7 8 9 10 11 12 13 14 

check button Enriched KEGG pathways.
Pathway IDTissueDisease StageDescriptionGene RatioBg Ratiopvaluep.adjustqvalueCount
hsa0492816EsophagusESCCParathyroid hormone synthesis, secretion and action66/4205106/84655.86e-031.47e-027.51e-0366
hsa0492817EsophagusESCCParathyroid hormone synthesis, secretion and action66/4205106/84655.86e-031.47e-027.51e-0366
hsa0492810LungIACParathyroid hormone synthesis, secretion and action26/1053106/84654.34e-044.03e-032.68e-0326
hsa0492811LungIACParathyroid hormone synthesis, secretion and action26/1053106/84654.34e-044.03e-032.68e-0326
hsa0492814ProstateBPHParathyroid hormone synthesis, secretion and action33/1718106/84655.30e-031.75e-021.08e-0233
hsa0492815ProstateBPHParathyroid hormone synthesis, secretion and action33/1718106/84655.30e-031.75e-021.08e-0233
Page: 1 

Top

Cell-cell communication analysis

check buttonIdentification of potential cell-cell interactions between two cell types and their ligand-receptor pairs for different disease states
LigandReceptorLRpairPathwayTissueDisease Stage
Page: 1 

Top

Single-cell gene regulatory network inference analysis

check buttonFind out the significant the regulons (TFs) and the target genes of each regulon across cell types for different disease states
TFCell TypeTissueDisease StageTarget GeneRSSRegulon Activity
MAFBM1MACBreastDCISFTL,TYROBP,FCER1G, etc.1.07e-01The dot plots of a searched regulon are shown for all cell subpopulations in each disease state of each tissue based on the regulon specific score inferred using pySCENIC and by calculating the average expression.
MAFBDCBreastHealthyFTL,TYROBP,FCER1G, etc.3.69e-01The dot plots of a searched regulon are shown for all cell subpopulations in each disease state of each tissue based on the regulon specific score inferred using pySCENIC and by calculating the average expression.
MAFBM1MACBreastHealthyFTL,TYROBP,FCER1G, etc.4.33e-02The dot plots of a searched regulon are shown for all cell subpopulations in each disease state of each tissue based on the regulon specific score inferred using pySCENIC and by calculating the average expression.
MAFBM1MACBreastIDCFTL,TYROBP,FCER1G, etc.2.64e-01The dot plots of a searched regulon are shown for all cell subpopulations in each disease state of each tissue based on the regulon specific score inferred using pySCENIC and by calculating the average expression.
MAFBDCBreastIDCFTL,TYROBP,FCER1G, etc.9.78e-02The dot plots of a searched regulon are shown for all cell subpopulations in each disease state of each tissue based on the regulon specific score inferred using pySCENIC and by calculating the average expression.
MAFBINMONBreastIDCFTL,TYROBP,FCER1G, etc.1.51e-01The dot plots of a searched regulon are shown for all cell subpopulations in each disease state of each tissue based on the regulon specific score inferred using pySCENIC and by calculating the average expression.
MAFBMONBreastIDCFTL,TYROBP,FCER1G, etc.4.07e-02The dot plots of a searched regulon are shown for all cell subpopulations in each disease state of each tissue based on the regulon specific score inferred using pySCENIC and by calculating the average expression.
MAFBINMONBreastPrecancerFTL,TYROBP,FCER1G, etc.3.13e-01The dot plots of a searched regulon are shown for all cell subpopulations in each disease state of each tissue based on the regulon specific score inferred using pySCENIC and by calculating the average expression.
MAFBICAFCervixCCHEXIM1,LINC00324,LSMEM1, etc.2.02e-01The dot plots of a searched regulon are shown for all cell subpopulations in each disease state of each tissue based on the regulon specific score inferred using pySCENIC and by calculating the average expression.
MAFBICAFCervixN_HPVHEXIM1,LINC00324,LSMEM1, etc.6.38e-02The dot plots of a searched regulon are shown for all cell subpopulations in each disease state of each tissue based on the regulon specific score inferred using pySCENIC and by calculating the average expression.
∗The dot plots of a searched regulon are shown for all cell subpopulations in each disease state of each tissue based on the regulon specific score inferred using pySCENIC and by calculating the average expression.
Page: 1 2 3 4 5 6 7 8 9 10 

Top

Somatic mutation of malignant transformation related genes

check buttonAnnotation of somatic variants for genes involved in malignant transformation
Hugo SymbolVariant ClassVariant ClassificationdbSNP RSHGVScHGVSpHGVSp ShortSWISSPROTBIOTYPESIFTPolyPhenTumor Sample BarcodeTissueHistologySexAgeStageTherapy TypesDrugsOutcome
MAFBSNVMissense_Mutationnovelc.28G>Ap.Glu10Lysp.E10KQ9Y5Q3protein_codingdeleterious(0.03)benign(0.006)TCGA-AC-A5XS-01Breastbreast invasive carcinomaFemale>=65I/IIHormone TherapyfemaraSD
MAFBSNVMissense_Mutationnovelc.107T>Cp.Leu36Prop.L36PQ9Y5Q3protein_codingdeleterious(0.02)benign(0.003)TCGA-AR-A1AJ-01Breastbreast invasive carcinomaFemale>=65I/IIUnknownUnknownSD
MAFBinsertionIn_Frame_Insnovelc.880_881insCTCACCCCATGGCCAATGGAATAGCAAp.Tyr294delinsSerHisProMetAlaAsnGlyIleAlaAsnp.Y294delinsSHPMANGIANQ9Y5Q3protein_codingTCGA-AO-A03T-01Breastbreast invasive carcinomaFemale<65I/IIChemotherapycyclophosphamideSD
MAFBdeletionFrame_Shift_Delnovelc.327delNp.Ala110ArgfsTer115p.A110Rfs*115Q9Y5Q3protein_codingTCGA-D8-A27V-01Breastbreast invasive carcinomaFemale<65I/IIHormone TherapytamoxiphenSD
MAFBSNVMissense_Mutationc.801G>Cp.Glu267Aspp.E267DQ9Y5Q3protein_codingdeleterious(0)probably_damaging(0.999)TCGA-C5-A1BQ-01Cervixcervical & endocervical cancerFemale>=65III/IVChemotherapycisplatinCR
MAFBSNVMissense_Mutationc.206N>Gp.Ser69Trpp.S69WQ9Y5Q3protein_codingdeleterious(0.01)possibly_damaging(0.761)TCGA-MY-A5BF-01Cervixcervical & endocervical cancerFemale>=65I/IIChemotherapycisplatinCR
MAFBSNVMissense_Mutationc.229N>Ap.Glu77Lysp.E77KQ9Y5Q3protein_codingdeleterious(0.03)benign(0.108)TCGA-VS-A958-01Cervixcervical & endocervical cancerFemale<65I/IIChemotherapycisplatinCR
MAFBSNVMissense_Mutationc.296N>Tp.Ala99Valp.A99VQ9Y5Q3protein_codingtolerated(0.12)benign(0.267)TCGA-AA-3994-01Colorectumcolon adenocarcinomaMale>=65III/IVChemotherapycapecitabineCR
MAFBSNVMissense_Mutationnovelc.373G>Ap.Asp125Asnp.D125NQ9Y5Q3protein_codingdeleterious(0.04)benign(0.188)TCGA-AA-A010-01Colorectumcolon adenocarcinomaFemale<65I/IIChemotherapyfolinicCR
MAFBinsertionFrame_Shift_Insnovelc.882dupCp.Lys295GlnfsTer51p.K295Qfs*51Q9Y5Q3protein_codingTCGA-AG-4022-01Colorectumrectum adenocarcinomaFemale<65I/IIChemotherapy5-fluorouracilCR
Page: 1 2 3 

Top

Related drugs of malignant transformation related genes

check buttonIdentification of chemicals and drugs interact with genes involved in malignant transfromation
(DGIdb 4.0)
Entrez IDSymbolCategoryInteraction TypesDrug Claim NameDrug NamePMIDs
9935MAFBCLINICALLY ACTIONABLE, TRANSCRIPTION FACTORTumor necrosis factor alpha (TNF-alpha) inhibitors
Page: 1