
|
|||||
|
 | |
| |
| |
| |
| |
| |
|
Gene: MAD2L1BP |
Gene summary for MAD2L1BP |
| Gene information | Species | Human | Gene symbol | MAD2L1BP | Gene ID | 9587 |
| Gene name | MAD2L1 binding protein | |
| Gene Alias | CMT2 | |
| Cytomap | 6p21.1 | |
| Gene Type | protein-coding | GO ID | GO:0000070 | UniProtAcc | Q15013 |
Top |
Malignant transformation analysis |
| Identification of the aberrant gene expression in precancerous and cancerous lesions by comparing the gene expression of stem-like cells in diseased tissues with normal stem cells |
| Entrez ID | Symbol | Replicates | Species | Organ | Tissue | Adj P-value | Log2FC | Malignancy |
| 9587 | MAD2L1BP | HTA11_2487_2000001011 | Human | Colorectum | SER | 2.23e-06 | 3.38e-01 | -0.1808 |
| 9587 | MAD2L1BP | HTA11_78_2000001011 | Human | Colorectum | AD | 9.51e-03 | 2.24e-01 | -0.1088 |
| 9587 | MAD2L1BP | HTA11_347_2000001011 | Human | Colorectum | AD | 3.84e-05 | 1.91e-01 | -0.1954 |
| 9587 | MAD2L1BP | HTA11_3361_2000001011 | Human | Colorectum | AD | 3.24e-02 | 2.28e-01 | -0.1207 |
| 9587 | MAD2L1BP | HTA11_83_2000001011 | Human | Colorectum | SER | 4.03e-02 | 2.27e-01 | -0.1526 |
| 9587 | MAD2L1BP | HTA11_696_2000001011 | Human | Colorectum | AD | 3.32e-08 | 2.54e-01 | -0.1464 |
| 9587 | MAD2L1BP | HTA11_866_2000001011 | Human | Colorectum | AD | 1.90e-02 | 1.34e-01 | -0.1001 |
| 9587 | MAD2L1BP | HTA11_1391_2000001011 | Human | Colorectum | AD | 1.21e-10 | 3.81e-01 | -0.059 |
| 9587 | MAD2L1BP | HTA11_2992_2000001011 | Human | Colorectum | SER | 1.44e-04 | 4.67e-01 | -0.1706 |
| 9587 | MAD2L1BP | HTA11_7862_2000001011 | Human | Colorectum | AD | 3.17e-02 | 2.69e-01 | -0.0179 |
| 9587 | MAD2L1BP | HTA11_866_3004761011 | Human | Colorectum | AD | 5.72e-09 | 3.06e-01 | 0.096 |
| 9587 | MAD2L1BP | HTA11_7663_2000001011 | Human | Colorectum | SER | 3.12e-03 | 3.41e-01 | 0.0131 |
| 9587 | MAD2L1BP | HTA11_7696_3000711011 | Human | Colorectum | AD | 2.29e-07 | 2.02e-01 | 0.0674 |
| 9587 | MAD2L1BP | HTA11_6818_2000001021 | Human | Colorectum | AD | 1.03e-02 | 2.12e-01 | 0.0588 |
| 9587 | MAD2L1BP | HTA11_99999970781_79442 | Human | Colorectum | MSS | 5.97e-14 | 3.99e-01 | 0.294 |
| 9587 | MAD2L1BP | HTA11_99999965104_69814 | Human | Colorectum | MSS | 6.18e-08 | 3.22e-01 | 0.281 |
| 9587 | MAD2L1BP | HTA11_99999971662_82457 | Human | Colorectum | MSS | 2.29e-07 | 2.22e-01 | 0.3859 |
| 9587 | MAD2L1BP | HTA11_99999973899_84307 | Human | Colorectum | MSS | 2.26e-02 | 2.23e-01 | 0.2585 |
| 9587 | MAD2L1BP | HTA11_99999974143_84620 | Human | Colorectum | MSS | 9.04e-03 | 1.15e-01 | 0.3005 |
| 9587 | MAD2L1BP | LZE2T | Human | Esophagus | ESCC | 1.12e-02 | 8.58e-01 | 0.082 |
| Page: 1 2 3 4 5 6 |
| Tissue | Expression Dynamics | Abbreviation |
| Colorectum (GSE201348) |  | FAP: Familial adenomatous polyposis |
| CRC: Colorectal cancer | ||
| Colorectum (HTA11) |  | AD: Adenomas |
| SER: Sessile serrated lesions | ||
| MSI-H: Microsatellite-high colorectal cancer | ||
| MSS: Microsatellite stable colorectal cancer | ||
| Esophagus |  | ESCC: Esophageal squamous cell carcinoma |
| HGIN: High-grade intraepithelial neoplasias | ||
| LGIN: Low-grade intraepithelial neoplasias | ||
| Liver |  | HCC: Hepatocellular carcinoma |
| NAFLD: Non-alcoholic fatty liver disease | ||
| Oral Cavity | 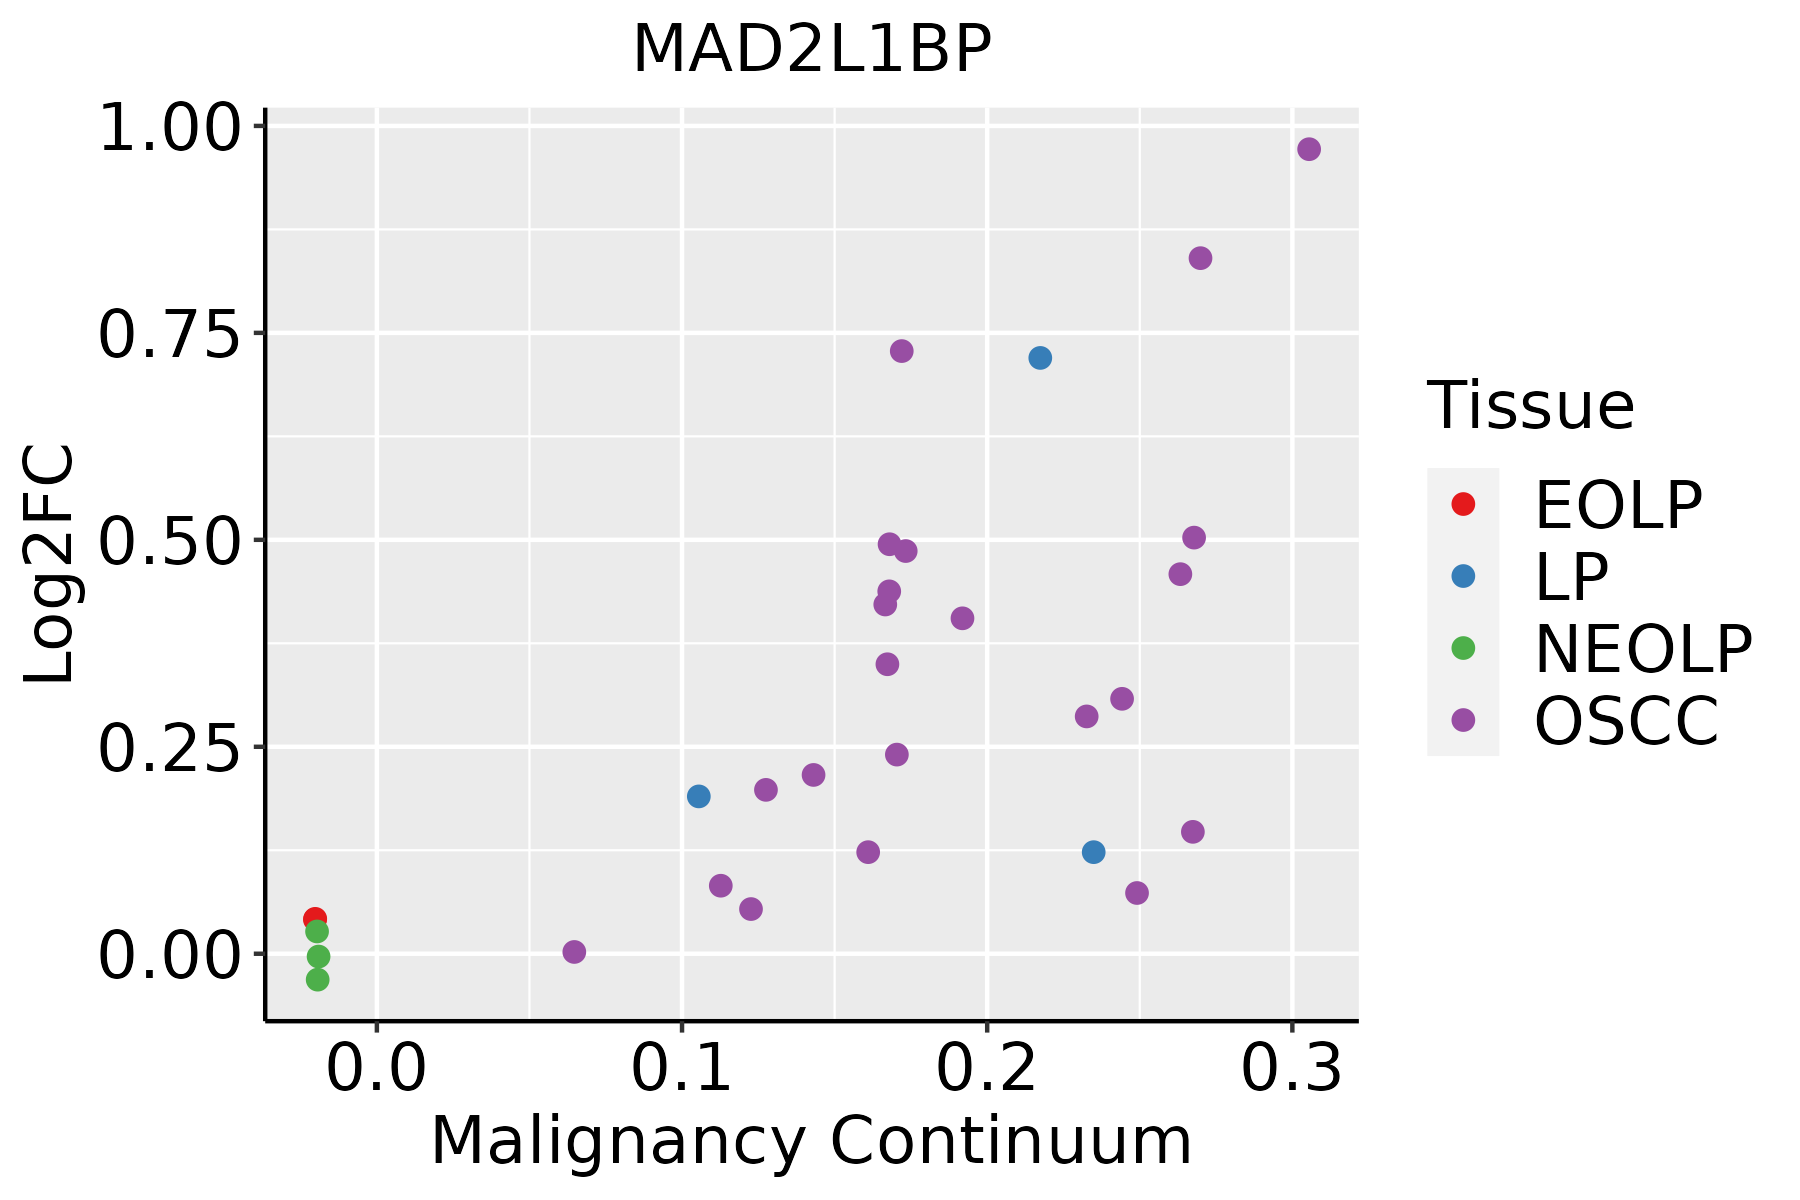 | EOLP: Erosive Oral lichen planus |
| LP: leukoplakia | ||
| NEOLP: Non-erosive oral lichen planus | ||
| OSCC: Oral squamous cell carcinoma | ||
| Skin | 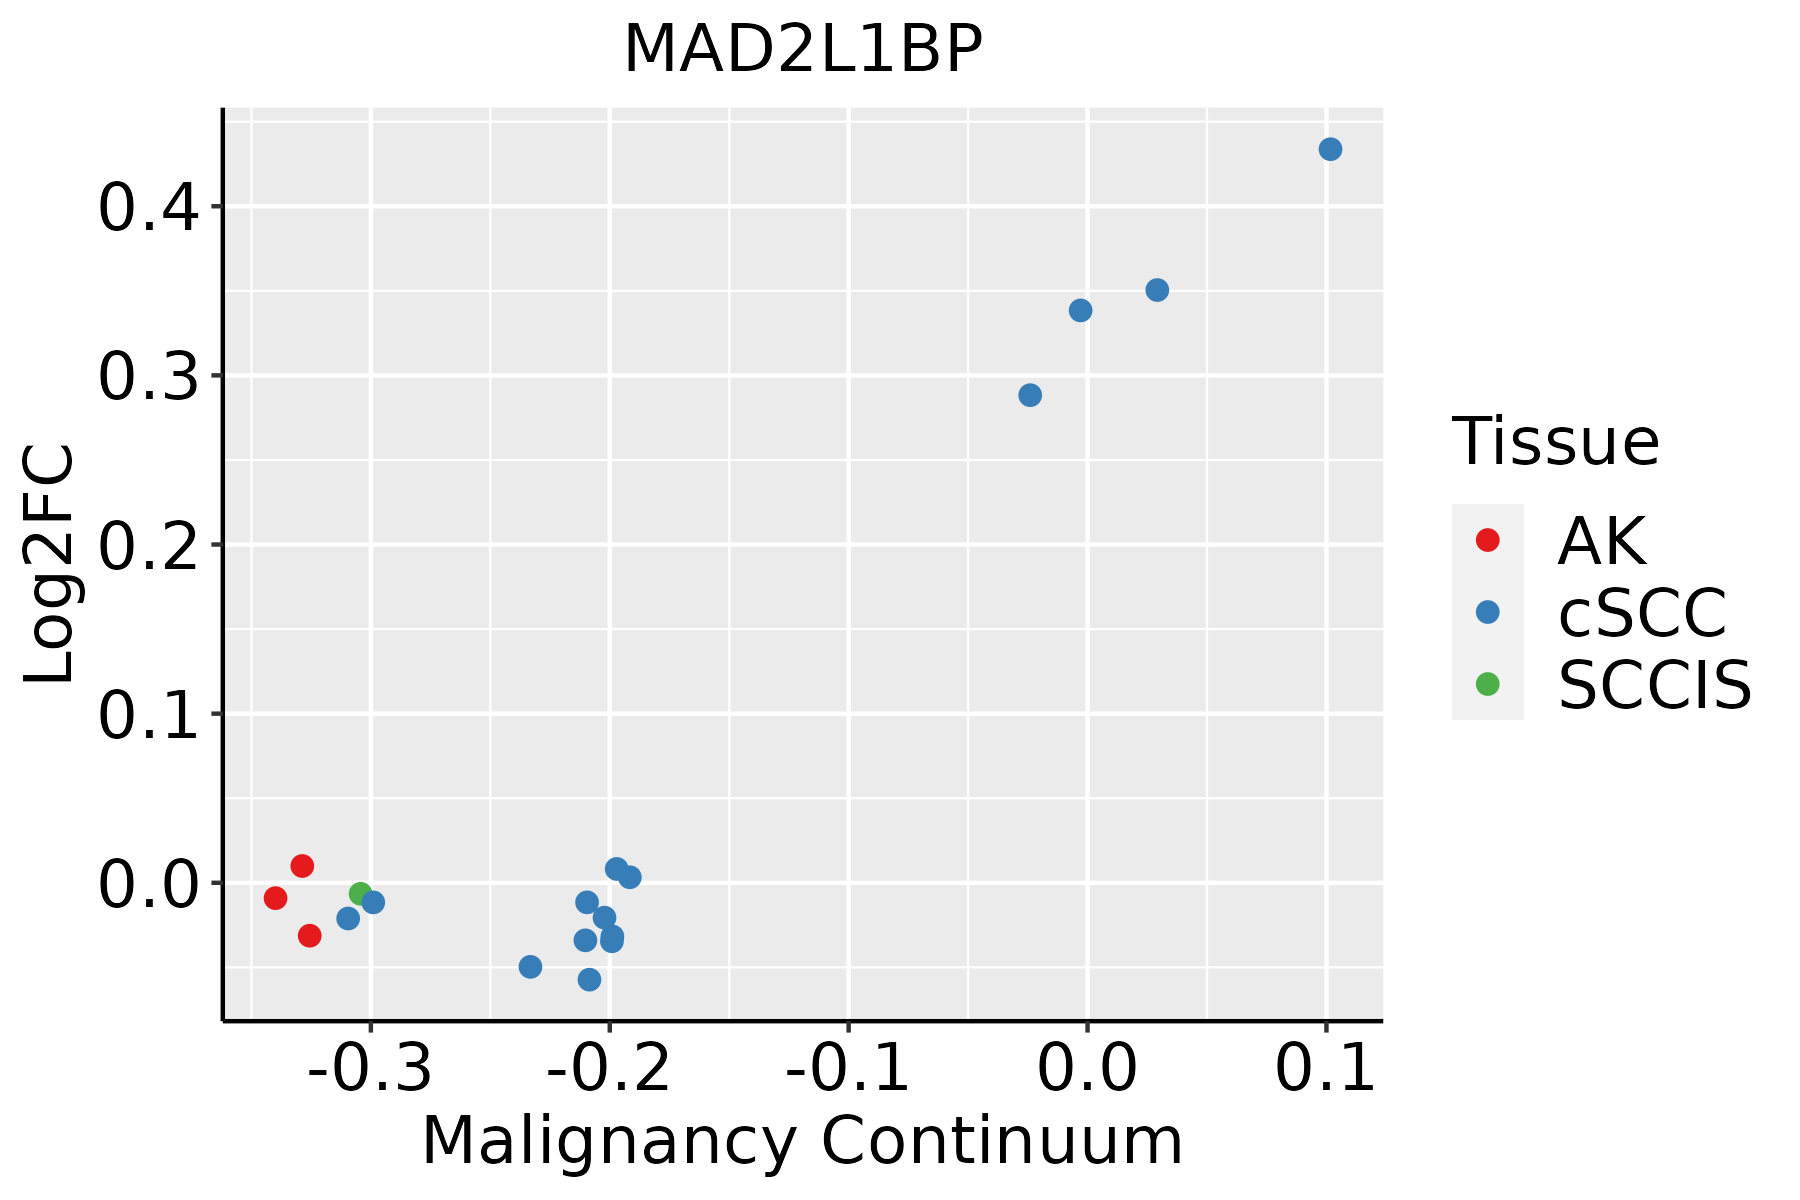 | AK: Actinic keratosis |
| cSCC: Cutaneous squamous cell carcinoma | ||
| SCCIS:squamous cell carcinoma in situ |
| ∗log2FC in expression of this searched gene in stem-like cells from each diseased tissue sample relative to stem-like cells in normal samples in each tissue plotted against the malignancy continuum. Samples are colored based on if they are from different disease stage. |
Top |
Malignant transformation related pathway analysis |
| Find out the enriched GO biological processes and KEGG pathways involved in transition from healthy to precancer to cancer |
| Tissue | Disease Stage | Enriched GO biological Processes |
| Colorectum | AD |  |
| Colorectum | SER |  |
| Colorectum | MSS |  |
| Colorectum | MSI-H |  |
| Colorectum | FAP |  |
| ∗Top 15 enriched GO BP terms are showed in the bar plot of each disease state in each tissue. Each row represents a significant GO biological process which is colored according to the -log10(p.adjust). |
| Page: 1 2 3 4 5 6 7 8 9 |
| GO ID | Tissue | Disease Stage | Description | Gene Ratio | Bg Ratio | pvalue | p.adjust | Count |
| GO:200125217 | Oral cavity | LP | positive regulation of chromosome organization | 36/4623 | 82/18723 | 1.09e-04 | 1.31e-03 | 36 |
| GO:004578612 | Oral cavity | LP | negative regulation of cell cycle | 127/4623 | 385/18723 | 1.33e-04 | 1.53e-03 | 127 |
| GO:004593012 | Oral cavity | LP | negative regulation of mitotic cell cycle | 83/4623 | 235/18723 | 1.62e-04 | 1.82e-03 | 83 |
| GO:190198712 | Oral cavity | LP | regulation of cell cycle phase transition | 126/4623 | 390/18723 | 3.69e-04 | 3.64e-03 | 126 |
| GO:004593115 | Oral cavity | LP | positive regulation of mitotic cell cycle | 46/4623 | 121/18723 | 7.65e-04 | 6.80e-03 | 46 |
| GO:000081911 | Oral cavity | LP | sister chromatid segregation | 70/4623 | 202/18723 | 9.20e-04 | 7.82e-03 | 70 |
| GO:000709311 | Oral cavity | LP | mitotic cell cycle checkpoint | 48/4623 | 129/18723 | 1.03e-03 | 8.67e-03 | 48 |
| GO:00458391 | Oral cavity | LP | negative regulation of mitotic nuclear division | 22/4623 | 48/18723 | 1.14e-03 | 9.32e-03 | 22 |
| GO:190199112 | Oral cavity | LP | negative regulation of mitotic cell cycle phase transition | 62/4623 | 179/18723 | 1.76e-03 | 1.34e-02 | 62 |
| GO:001094811 | Oral cavity | LP | negative regulation of cell cycle process | 95/4623 | 294/18723 | 1.80e-03 | 1.37e-02 | 95 |
| GO:00517841 | Oral cavity | LP | negative regulation of nuclear division | 24/4623 | 56/18723 | 2.17e-03 | 1.58e-02 | 24 |
| GO:190198912 | Oral cavity | LP | positive regulation of cell cycle phase transition | 42/4623 | 115/18723 | 3.06e-03 | 2.09e-02 | 42 |
| GO:190198811 | Oral cavity | LP | negative regulation of cell cycle phase transition | 80/4623 | 249/18723 | 4.63e-03 | 2.94e-02 | 80 |
| GO:000007511 | Oral cavity | LP | cell cycle checkpoint | 57/4623 | 169/18723 | 5.05e-03 | 3.14e-02 | 57 |
| GO:004828511 | Oral cavity | LP | organelle fission | 145/4623 | 488/18723 | 6.02e-03 | 3.57e-02 | 145 |
| GO:00988131 | Oral cavity | LP | nuclear chromosome segregation | 88/4623 | 281/18723 | 6.72e-03 | 3.91e-02 | 88 |
| GO:190199211 | Oral cavity | LP | positive regulation of mitotic cell cycle phase transition | 34/4623 | 93/18723 | 7.08e-03 | 3.98e-02 | 34 |
| GO:00070881 | Oral cavity | LP | regulation of mitotic nuclear division | 39/4623 | 110/18723 | 7.45e-03 | 4.14e-02 | 39 |
| GO:004578715 | Oral cavity | LP | positive regulation of cell cycle | 96/4623 | 313/18723 | 9.08e-03 | 4.85e-02 | 96 |
| GO:014001415 | Skin | cSCC | mitotic nuclear division | 149/4864 | 287/18723 | 3.59e-21 | 6.43e-19 | 149 |
| Page: 1 2 3 4 5 6 7 8 9 10 11 12 13 14 15 16 |
| Pathway ID | Tissue | Disease Stage | Description | Gene Ratio | Bg Ratio | pvalue | p.adjust | qvalue | Count |
| hsa0411023 | Esophagus | ESCC | Cell cycle | 126/4205 | 157/8465 | 1.34e-15 | 5.60e-14 | 2.87e-14 | 126 |
| hsa0411033 | Esophagus | ESCC | Cell cycle | 126/4205 | 157/8465 | 1.34e-15 | 5.60e-14 | 2.87e-14 | 126 |
| hsa041104 | Liver | Cirrhotic | Cell cycle | 61/2530 | 157/8465 | 9.53e-03 | 3.21e-02 | 1.98e-02 | 61 |
| hsa0411011 | Liver | Cirrhotic | Cell cycle | 61/2530 | 157/8465 | 9.53e-03 | 3.21e-02 | 1.98e-02 | 61 |
| hsa041102 | Liver | HCC | Cell cycle | 106/4020 | 157/8465 | 2.54e-07 | 3.04e-06 | 1.69e-06 | 106 |
| hsa041103 | Liver | HCC | Cell cycle | 106/4020 | 157/8465 | 2.54e-07 | 3.04e-06 | 1.69e-06 | 106 |
| hsa041108 | Oral cavity | OSCC | Cell cycle | 118/3704 | 157/8465 | 7.15e-16 | 2.66e-14 | 1.35e-14 | 118 |
| hsa0411015 | Oral cavity | OSCC | Cell cycle | 118/3704 | 157/8465 | 7.15e-16 | 2.66e-14 | 1.35e-14 | 118 |
| hsa0411022 | Oral cavity | LP | Cell cycle | 70/2418 | 157/8465 | 1.17e-05 | 8.27e-05 | 5.33e-05 | 70 |
| hsa0411032 | Oral cavity | LP | Cell cycle | 70/2418 | 157/8465 | 1.17e-05 | 8.27e-05 | 5.33e-05 | 70 |
| Page: 1 |
Top |
Cell-cell communication analysis |
| Identification of potential cell-cell interactions between two cell types and their ligand-receptor pairs for different disease states |
| Ligand | Receptor | LRpair | Pathway | Tissue | Disease Stage |
| Page: 1 |
Top |
Single-cell gene regulatory network inference analysis |
| Find out the significant the regulons (TFs) and the target genes of each regulon across cell types for different disease states |
| TF | Cell Type | Tissue | Disease Stage | Target Gene | RSS | Regulon Activity |
| ∗The dot plots of a searched regulon are shown for all cell subpopulations in each disease state of each tissue based on the regulon specific score inferred using pySCENIC and by calculating the average expression. |
| Page: 1 |
Top |
Somatic mutation of malignant transformation related genes |
| Annotation of somatic variants for genes involved in malignant transformation |
| Hugo Symbol | Variant Class | Variant Classification | dbSNP RS | HGVSc | HGVSp | HGVSp Short | SWISSPROT | BIOTYPE | SIFT | PolyPhen | Tumor Sample Barcode | Tissue | Histology | Sex | Age | Stage | Therapy Types | Drugs | Outcome |
| MAD2L1BP | SNV | Missense_Mutation | c.633G>C | p.Gln211His | p.Q211H | Q15013 | protein_coding | deleterious(0.04) | possibly_damaging(0.766) | TCGA-AR-A24H-01 | Breast | breast invasive carcinoma | Female | >=65 | I/II | Hormone Therapy | tamoxiphen | SD | |
| MAD2L1BP | SNV | Missense_Mutation | c.199N>C | p.Glu67Gln | p.E67Q | Q15013 | protein_coding | deleterious_low_confidence(0.05) | benign(0.346) | TCGA-EW-A1IX-01 | Breast | breast invasive carcinoma | Female | <65 | I/II | Hormone Therapy | femara | SD | |
| MAD2L1BP | insertion | In_Frame_Ins | novel | c.569_570insGTCAGCACTTGGTATTCAGCT | p.Ala190_Leu191insSerAlaLeuGlyIleGlnLeu | p.A190_L191insSALGIQL | Q15013 | protein_coding | TCGA-AO-A0JF-01 | Breast | breast invasive carcinoma | Female | >=65 | I/II | Chemotherapy | doxorubicin | SD | ||
| MAD2L1BP | insertion | Frame_Shift_Ins | novel | c.885_886insGTTCTAAATGTGGGAGAATTATGGTTTTGTA | p.Gln296ValfsTer17 | p.Q296Vfs*17 | Q15013 | protein_coding | TCGA-B6-A0I5-01 | Breast | breast invasive carcinoma | Female | <65 | I/II | Unknown | Unknown | SD | ||
| MAD2L1BP | SNV | Missense_Mutation | novel | c.607C>G | p.Leu203Val | p.L203V | Q15013 | protein_coding | tolerated(0.38) | benign(0.072) | TCGA-AA-3941-01 | Colorectum | colon adenocarcinoma | Female | >=65 | I/II | Unknown | Unknown | SD |
| MAD2L1BP | SNV | Missense_Mutation | c.725N>A | p.Gly242Asp | p.G242D | Q15013 | protein_coding | tolerated(0.08) | benign(0.376) | TCGA-EI-6882-01 | Colorectum | rectum adenocarcinoma | Male | <65 | I/II | Unknown | Unknown | SD | |
| MAD2L1BP | deletion | In_Frame_Del | c.400_402delTCT | p.Ser134del | p.S134del | Q15013 | protein_coding | TCGA-AZ-4615-01 | Colorectum | colon adenocarcinoma | Male | >=65 | III/IV | Chemotherapy | xeloda | PD | |||
| MAD2L1BP | SNV | Missense_Mutation | novel | c.415N>A | p.Glu139Lys | p.E139K | Q15013 | protein_coding | deleterious(0.04) | benign(0.136) | TCGA-A5-A0G2-01 | Endometrium | uterine corpus endometrioid carcinoma | Female | <65 | III/IV | Unknown | Unknown | SD |
| MAD2L1BP | SNV | Missense_Mutation | novel | c.557N>G | p.Leu186Arg | p.L186R | Q15013 | protein_coding | deleterious(0) | probably_damaging(0.997) | TCGA-A5-A0G2-01 | Endometrium | uterine corpus endometrioid carcinoma | Female | <65 | III/IV | Unknown | Unknown | SD |
| MAD2L1BP | SNV | Missense_Mutation | rs756338268 | c.661N>T | p.Arg221Cys | p.R221C | Q15013 | protein_coding | deleterious(0.01) | benign(0.013) | TCGA-A5-A0G2-01 | Endometrium | uterine corpus endometrioid carcinoma | Female | <65 | III/IV | Unknown | Unknown | SD |
| Page: 1 2 |
Top |
Related drugs of malignant transformation related genes |
| Identification of chemicals and drugs interact with genes involved in malignant transfromation |
| (DGIdb 4.0) |
| Entrez ID | Symbol | Category | Interaction Types | Drug Claim Name | Drug Name | PMIDs |
| Page: 1 |

Copyright 2023-Present -The University of Texas Health Science Center at Houston |