
|
|||||
|
 | |
| |
| |
| |
| |
| |
|
Gene: INO80 |
Gene summary for INO80 |
| Gene information | Species | Human | Gene symbol | INO80 | Gene ID | 54617 |
| Gene name | INO80 complex ATPase subunit | |
| Gene Alias | INO80A | |
| Cytomap | 15q15.1 | |
| Gene Type | protein-coding | GO ID | GO:0000070 | UniProtAcc | A0A024R9R7 |
Top |
Malignant transformation analysis |
| Identification of the aberrant gene expression in precancerous and cancerous lesions by comparing the gene expression of stem-like cells in diseased tissues with normal stem cells |
| Entrez ID | Symbol | Replicates | Species | Organ | Tissue | Adj P-value | Log2FC | Malignancy |
| 54617 | INO80 | CCI_1 | Human | Cervix | CC | 1.02e-02 | 7.24e-01 | 0.528 |
| 54617 | INO80 | CCI_2 | Human | Cervix | CC | 5.63e-07 | 7.06e-01 | 0.5249 |
| 54617 | INO80 | CCI_3 | Human | Cervix | CC | 6.66e-03 | 4.40e-01 | 0.516 |
| 54617 | INO80 | LZE7T | Human | Esophagus | ESCC | 7.37e-06 | 2.47e-01 | 0.0667 |
| 54617 | INO80 | LZE20T | Human | Esophagus | ESCC | 2.15e-05 | 8.29e-02 | 0.0662 |
| 54617 | INO80 | LZE24T | Human | Esophagus | ESCC | 3.11e-08 | 1.42e-01 | 0.0596 |
| 54617 | INO80 | P1T-E | Human | Esophagus | ESCC | 1.13e-10 | 5.15e-01 | 0.0875 |
| 54617 | INO80 | P2T-E | Human | Esophagus | ESCC | 1.67e-15 | 3.17e-01 | 0.1177 |
| 54617 | INO80 | P4T-E | Human | Esophagus | ESCC | 4.02e-19 | 4.16e-01 | 0.1323 |
| 54617 | INO80 | P5T-E | Human | Esophagus | ESCC | 1.65e-18 | 3.22e-01 | 0.1327 |
| 54617 | INO80 | P8T-E | Human | Esophagus | ESCC | 7.30e-17 | 2.49e-01 | 0.0889 |
| 54617 | INO80 | P9T-E | Human | Esophagus | ESCC | 7.42e-15 | 2.44e-01 | 0.1131 |
| 54617 | INO80 | P10T-E | Human | Esophagus | ESCC | 9.70e-21 | 3.37e-01 | 0.116 |
| 54617 | INO80 | P11T-E | Human | Esophagus | ESCC | 1.40e-07 | 2.10e-01 | 0.1426 |
| 54617 | INO80 | P12T-E | Human | Esophagus | ESCC | 4.56e-20 | 3.39e-01 | 0.1122 |
| 54617 | INO80 | P15T-E | Human | Esophagus | ESCC | 1.33e-23 | 3.50e-01 | 0.1149 |
| 54617 | INO80 | P16T-E | Human | Esophagus | ESCC | 2.75e-09 | 1.65e-01 | 0.1153 |
| 54617 | INO80 | P17T-E | Human | Esophagus | ESCC | 3.56e-04 | 1.36e-01 | 0.1278 |
| 54617 | INO80 | P20T-E | Human | Esophagus | ESCC | 6.71e-12 | 2.15e-01 | 0.1124 |
| 54617 | INO80 | P21T-E | Human | Esophagus | ESCC | 2.25e-22 | 2.92e-01 | 0.1617 |
| Page: 1 2 3 4 5 6 |
| Tissue | Expression Dynamics | Abbreviation |
| Cervix | 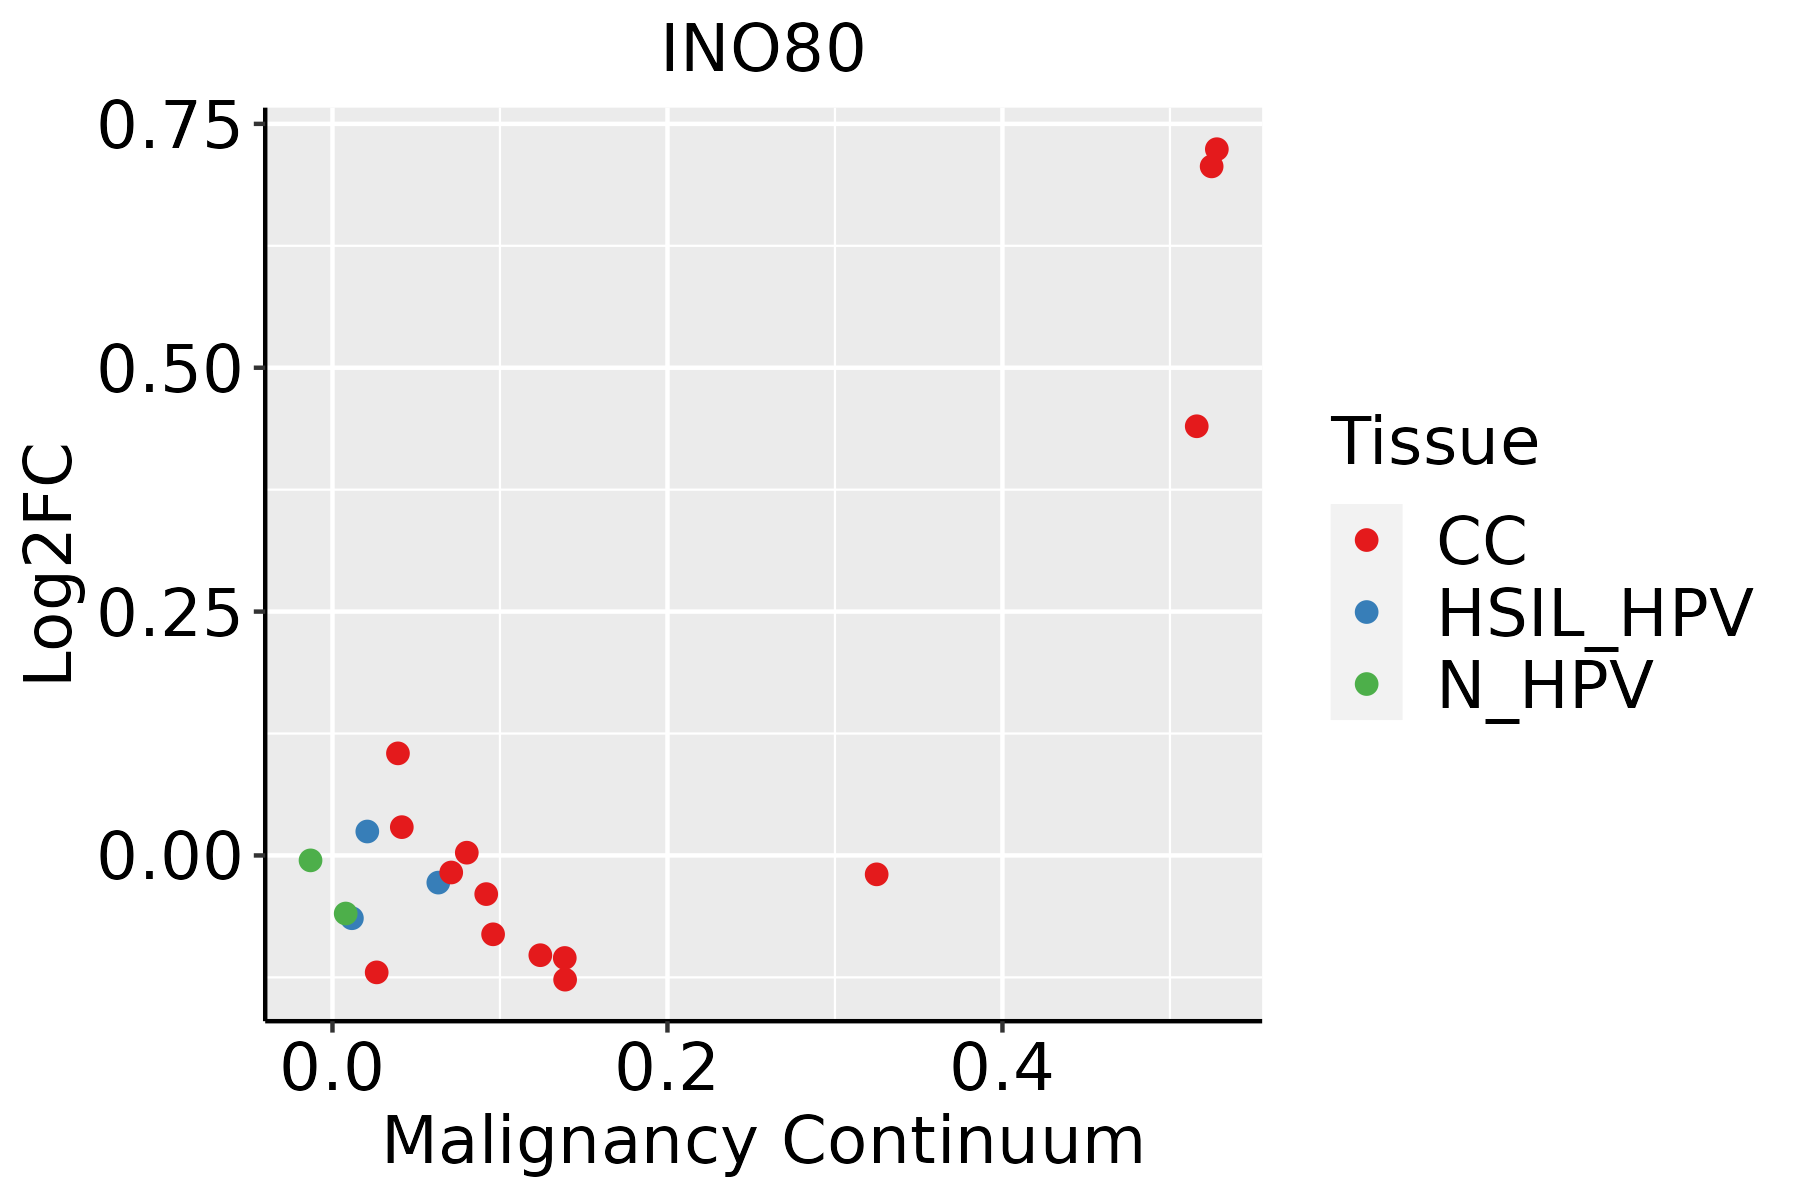 | CC: Cervix cancer |
| HSIL_HPV: HPV-infected high-grade squamous intraepithelial lesions | ||
| N_HPV: HPV-infected normal cervix | ||
| Esophagus |  | ESCC: Esophageal squamous cell carcinoma |
| HGIN: High-grade intraepithelial neoplasias | ||
| LGIN: Low-grade intraepithelial neoplasias | ||
| Liver | 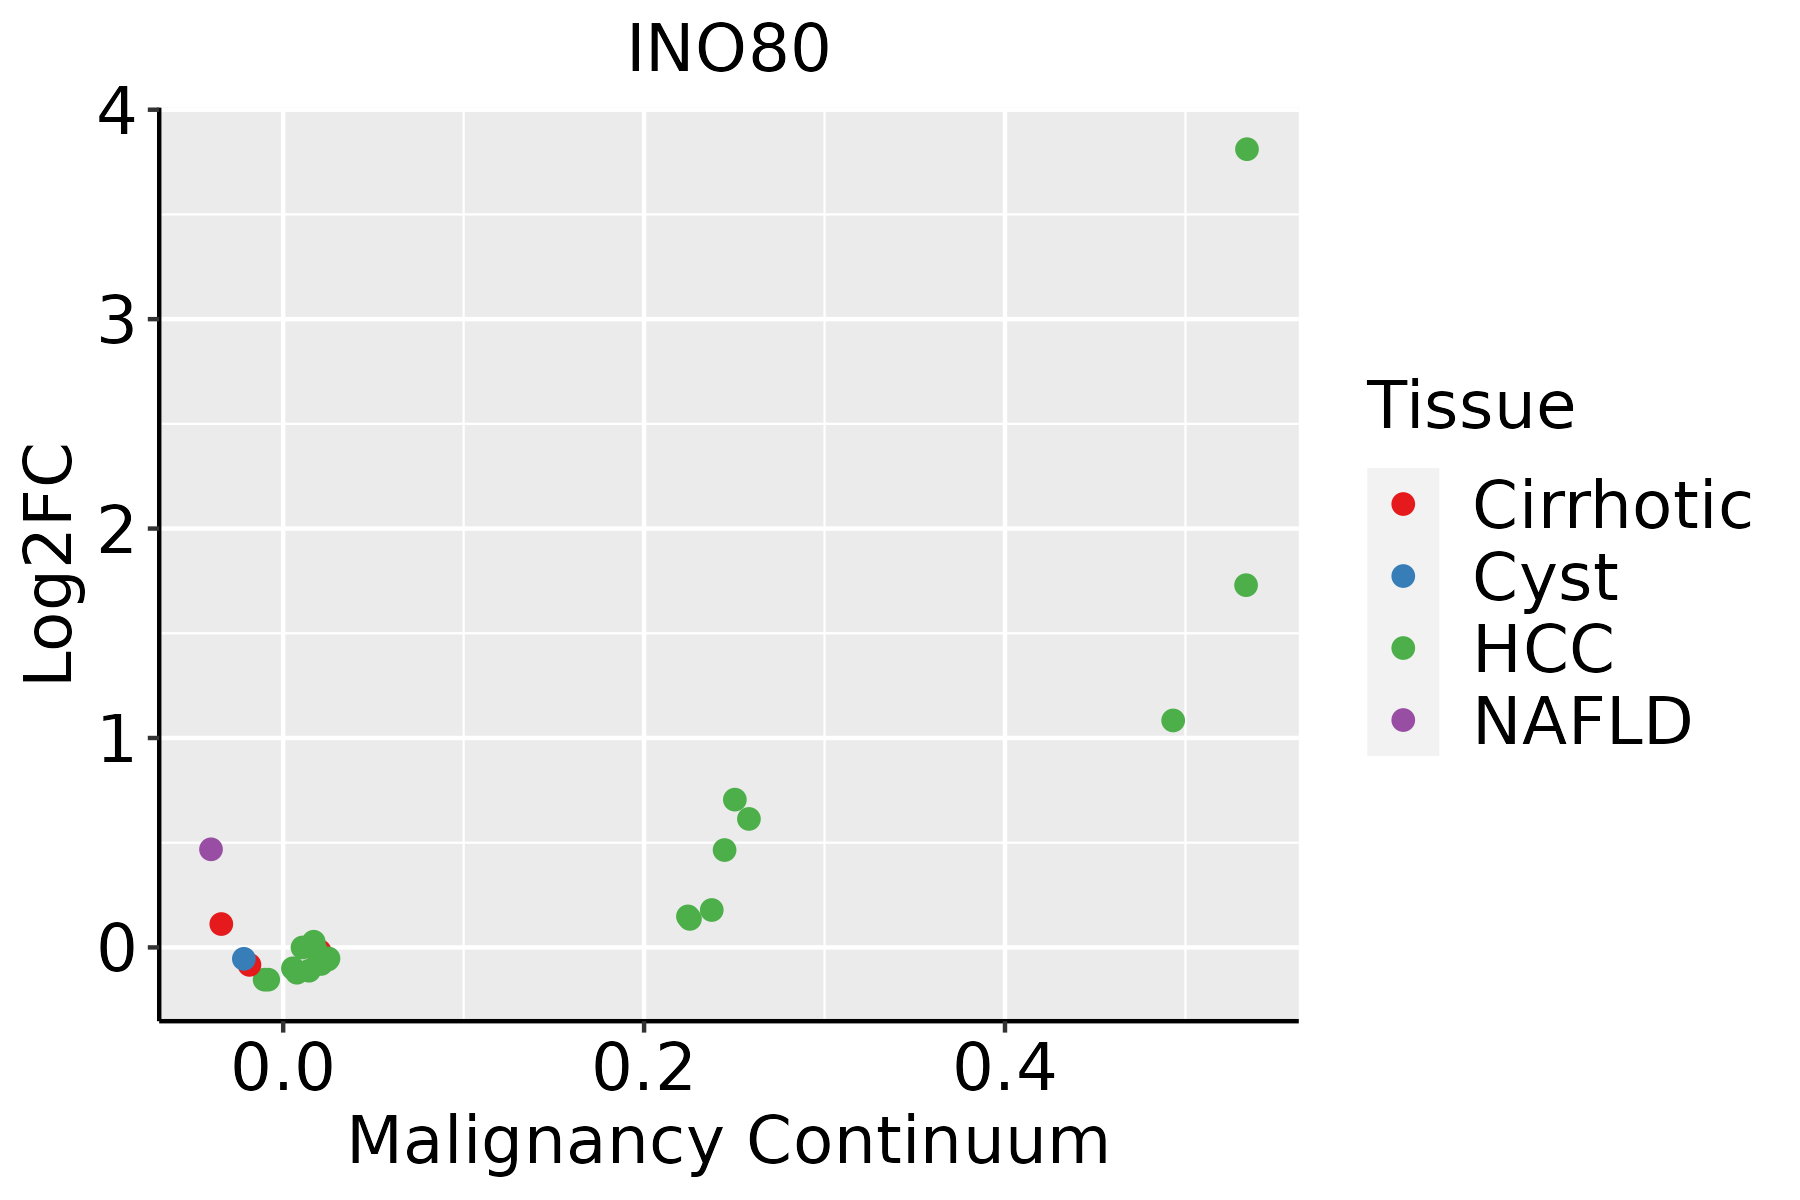 | HCC: Hepatocellular carcinoma |
| NAFLD: Non-alcoholic fatty liver disease | ||
| Lung | 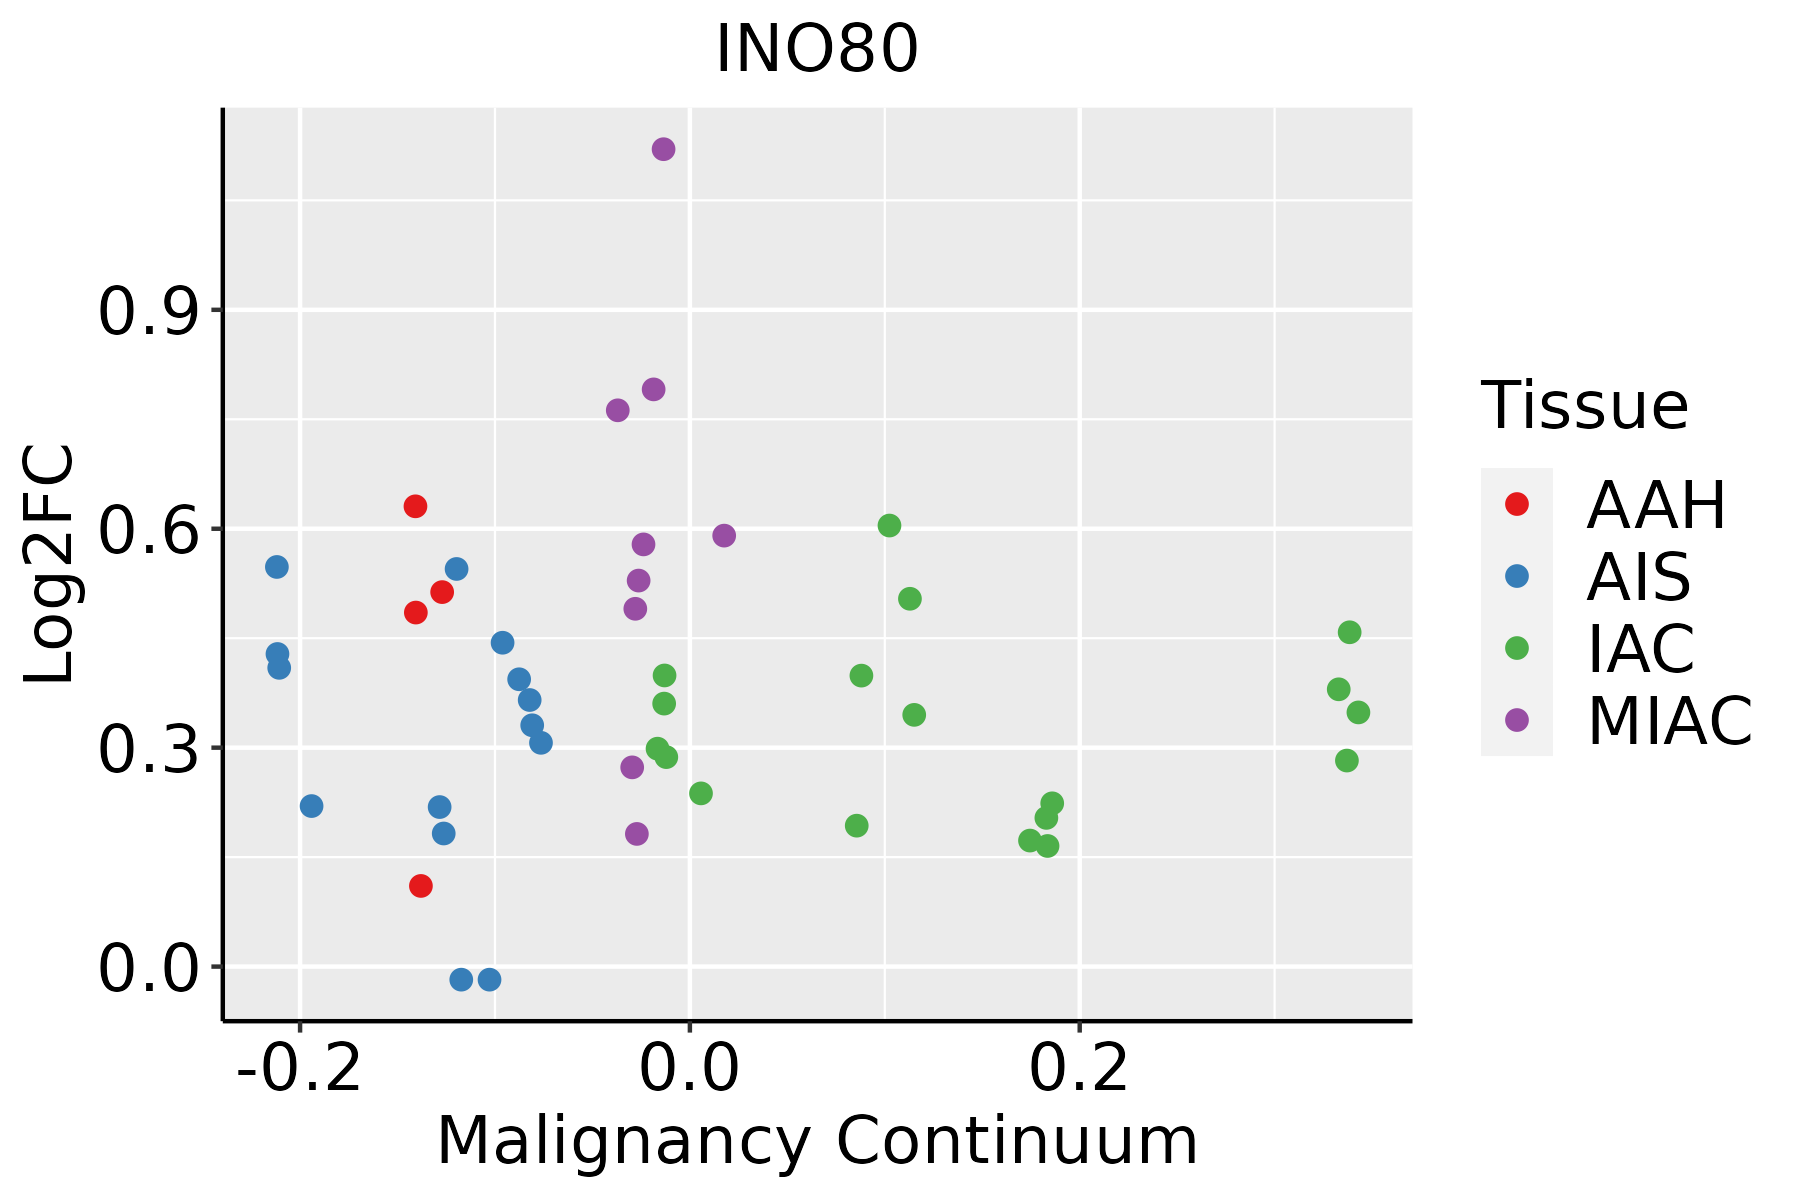 | AAH: Atypical adenomatous hyperplasia |
| AIS: Adenocarcinoma in situ | ||
| IAC: Invasive lung adenocarcinoma | ||
| MIA: Minimally invasive adenocarcinoma | ||
| Thyroid | 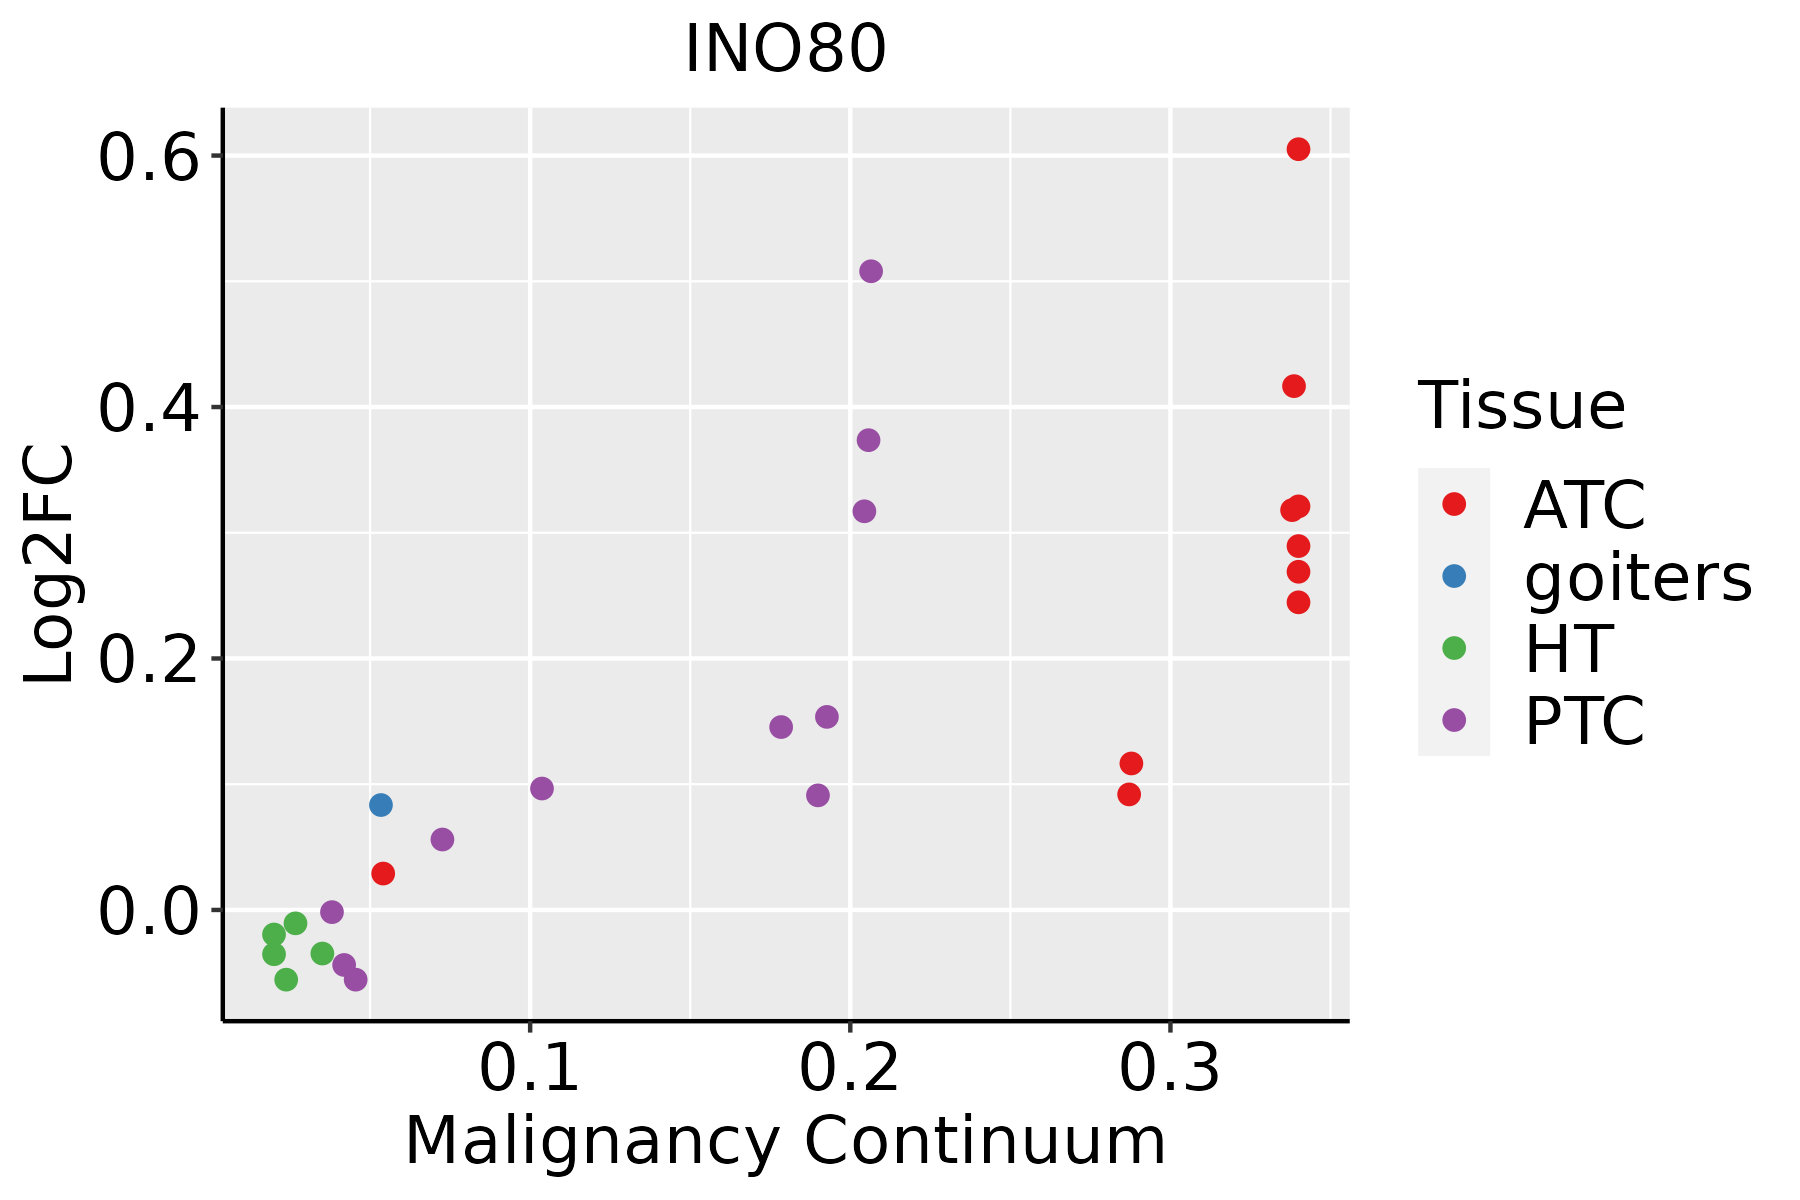 | ATC: Anaplastic thyroid cancer |
| HT: Hashimoto's thyroiditis | ||
| PTC: Papillary thyroid cancer |
| ∗log2FC in expression of this searched gene in stem-like cells from each diseased tissue sample relative to stem-like cells in normal samples in each tissue plotted against the malignancy continuum. Samples are colored based on if they are from different disease stage. |
Top |
Malignant transformation related pathway analysis |
| Find out the enriched GO biological processes and KEGG pathways involved in transition from healthy to precancer to cancer |
| Tissue | Disease Stage | Enriched GO biological Processes |
| Colorectum | AD |  |
| Colorectum | SER |  |
| Colorectum | MSS |  |
| Colorectum | MSI-H |  |
| Colorectum | FAP |  |
| ∗Top 15 enriched GO BP terms are showed in the bar plot of each disease state in each tissue. Each row represents a significant GO biological process which is colored according to the -log10(p.adjust). |
| Page: 1 2 3 4 5 6 7 8 9 |
| GO ID | Tissue | Disease Stage | Description | Gene Ratio | Bg Ratio | pvalue | p.adjust | Count |
| GO:19028067 | Thyroid | PTC | regulation of cell cycle G1/S phase transition | 76/5968 | 168/18723 | 1.87e-04 | 1.41e-03 | 76 |
| GO:005122514 | Thyroid | PTC | spindle assembly | 56/5968 | 117/18723 | 2.17e-04 | 1.60e-03 | 56 |
| GO:00063385 | Thyroid | PTC | chromatin remodeling | 106/5968 | 255/18723 | 6.56e-04 | 4.13e-03 | 106 |
| GO:00482855 | Thyroid | PTC | organelle fission | 188/5968 | 488/18723 | 9.64e-04 | 5.77e-03 | 188 |
| GO:00988135 | Thyroid | PTC | nuclear chromosome segregation | 114/5968 | 281/18723 | 1.21e-03 | 6.94e-03 | 114 |
| GO:00063026 | Thyroid | PTC | double-strand break repair | 103/5968 | 251/18723 | 1.30e-03 | 7.40e-03 | 103 |
| GO:00094167 | Thyroid | PTC | response to light stimulus | 127/5968 | 320/18723 | 1.76e-03 | 9.58e-03 | 127 |
| GO:003030718 | Thyroid | PTC | positive regulation of cell growth | 71/5968 | 166/18723 | 1.98e-03 | 1.06e-02 | 71 |
| GO:00002804 | Thyroid | PTC | nuclear division | 167/5968 | 439/18723 | 3.27e-03 | 1.60e-02 | 167 |
| GO:00714823 | Thyroid | PTC | cellular response to light stimulus | 53/5968 | 123/18723 | 5.73e-03 | 2.59e-02 | 53 |
| GO:014001416 | Thyroid | ATC | mitotic nuclear division | 171/6293 | 287/18723 | 1.13e-19 | 1.66e-17 | 171 |
| GO:004477219 | Thyroid | ATC | mitotic cell cycle phase transition | 223/6293 | 424/18723 | 3.46e-16 | 2.88e-14 | 223 |
| GO:000007013 | Thyroid | ATC | mitotic sister chromatid segregation | 108/6293 | 168/18723 | 3.53e-16 | 2.90e-14 | 108 |
| GO:000734622 | Thyroid | ATC | regulation of mitotic cell cycle | 236/6293 | 457/18723 | 7.58e-16 | 5.92e-14 | 236 |
| GO:000081913 | Thyroid | ATC | sister chromatid segregation | 122/6293 | 202/18723 | 4.71e-15 | 3.17e-13 | 122 |
| GO:001604927 | Thyroid | ATC | cell growth | 241/6293 | 482/18723 | 4.27e-14 | 2.35e-12 | 241 |
| GO:000705913 | Thyroid | ATC | chromosome segregation | 183/6293 | 346/18723 | 8.03e-14 | 4.23e-12 | 183 |
| GO:000705122 | Thyroid | ATC | spindle organization | 109/6293 | 184/18723 | 7.99e-13 | 3.46e-11 | 109 |
| GO:190199015 | Thyroid | ATC | regulation of mitotic cell cycle phase transition | 156/6293 | 299/18723 | 2.19e-11 | 7.80e-10 | 156 |
| GO:007121427 | Thyroid | ATC | cellular response to abiotic stimulus | 169/6293 | 331/18723 | 3.24e-11 | 1.08e-09 | 169 |
| Page: 1 2 3 4 5 6 7 8 9 10 11 12 13 14 |
| Pathway ID | Tissue | Disease Stage | Description | Gene Ratio | Bg Ratio | pvalue | p.adjust | qvalue | Count |
| Page: 1 |
Top |
Cell-cell communication analysis |
| Identification of potential cell-cell interactions between two cell types and their ligand-receptor pairs for different disease states |
| Ligand | Receptor | LRpair | Pathway | Tissue | Disease Stage |
| Page: 1 |
Top |
Single-cell gene regulatory network inference analysis |
| Find out the significant the regulons (TFs) and the target genes of each regulon across cell types for different disease states |
| TF | Cell Type | Tissue | Disease Stage | Target Gene | RSS | Regulon Activity |
| ∗The dot plots of a searched regulon are shown for all cell subpopulations in each disease state of each tissue based on the regulon specific score inferred using pySCENIC and by calculating the average expression. |
| Page: 1 |
Top |
Somatic mutation of malignant transformation related genes |
| Annotation of somatic variants for genes involved in malignant transformation |
| Hugo Symbol | Variant Class | Variant Classification | dbSNP RS | HGVSc | HGVSp | HGVSp Short | SWISSPROT | BIOTYPE | SIFT | PolyPhen | Tumor Sample Barcode | Tissue | Histology | Sex | Age | Stage | Therapy Types | Drugs | Outcome |
| INO80 | SNV | Missense_Mutation | rs747579178 | c.781C>A | p.Pro261Thr | p.P261T | Q9ULG1 | protein_coding | tolerated(0.24) | probably_damaging(0.994) | TCGA-A7-A0DB-01 | Breast | breast invasive carcinoma | Female | <65 | I/II | Hormone Therapy | arimidex | SD |
| INO80 | SNV | Missense_Mutation | novel | c.1400G>T | p.Arg467Met | p.R467M | Q9ULG1 | protein_coding | deleterious(0) | probably_damaging(0.984) | TCGA-A8-A09Z-01 | Breast | breast invasive carcinoma | Female | >=65 | I/II | Unknown | Unknown | SD |
| INO80 | SNV | Missense_Mutation | c.4322C>A | p.Ala1441Asp | p.A1441D | Q9ULG1 | protein_coding | tolerated(0.22) | benign(0.025) | TCGA-AC-A23H-01 | Breast | breast invasive carcinoma | Female | >=65 | I/II | Unknown | Unknown | PD | |
| INO80 | SNV | Missense_Mutation | c.4322N>T | p.Ala1441Val | p.A1441V | Q9ULG1 | protein_coding | tolerated(0.24) | benign(0) | TCGA-AN-A0XS-01 | Breast | breast invasive carcinoma | Female | <65 | III/IV | Unknown | Unknown | SD | |
| INO80 | SNV | Missense_Mutation | novel | c.3023N>G | p.Ser1008Cys | p.S1008C | Q9ULG1 | protein_coding | tolerated(0.07) | benign(0.174) | TCGA-BH-A0B6-01 | Breast | breast invasive carcinoma | Female | <65 | I/II | Unknown | Unknown | SD |
| INO80 | SNV | Missense_Mutation | c.241N>T | p.Leu81Phe | p.L81F | Q9ULG1 | protein_coding | tolerated(0.16) | possibly_damaging(0.676) | TCGA-BH-A1FL-01 | Breast | breast invasive carcinoma | Female | >=65 | I/II | Unknown | Unknown | PD | |
| INO80 | SNV | Missense_Mutation | rs780868252 | c.934C>T | p.His312Tyr | p.H312Y | Q9ULG1 | protein_coding | tolerated(0.85) | benign(0.303) | TCGA-D8-A1XB-01 | Breast | breast invasive carcinoma | Female | <65 | I/II | Unknown | Unknown | SD |
| INO80 | SNV | Missense_Mutation | c.532A>G | p.Lys178Glu | p.K178E | Q9ULG1 | protein_coding | tolerated(0.52) | benign(0.074) | TCGA-D8-A1XQ-01 | Breast | breast invasive carcinoma | Female | >=65 | I/II | Unknown | Unknown | SD | |
| INO80 | SNV | Missense_Mutation | novel | c.287N>T | p.Tyr96Phe | p.Y96F | Q9ULG1 | protein_coding | tolerated(0.61) | benign(0.031) | TCGA-LL-A73Z-01 | Breast | breast invasive carcinoma | Female | <65 | III/IV | Chemotherapy | adriamycin | PD |
| INO80 | insertion | Frame_Shift_Ins | novel | c.2093_2094insGATTTTGAAGCCATTTATGCTGAGGAGAA | p.Ile698MetfsTer50 | p.I698Mfs*50 | Q9ULG1 | protein_coding | TCGA-B6-A0I8-01 | Breast | breast invasive carcinoma | Female | <65 | I/II | Unknown | Unknown | PD |
| Page: 1 2 3 4 5 6 7 8 9 10 11 12 13 |
Top |
Related drugs of malignant transformation related genes |
| Identification of chemicals and drugs interact with genes involved in malignant transfromation |
| (DGIdb 4.0) |
| Entrez ID | Symbol | Category | Interaction Types | Drug Claim Name | Drug Name | PMIDs |
| Page: 1 |

Copyright 2023-Present -The University of Texas Health Science Center at Houston |