
|
|||||
|
 | |
| |
| |
| |
| |
| |
|
Gene: IFT20 |
Gene summary for IFT20 |
| Gene information | Species | Human | Gene symbol | IFT20 | Gene ID | 90410 |
| Gene name | intraflagellar transport 20 | |
| Gene Alias | IFT20 | |
| Cytomap | 17q11.2 | |
| Gene Type | protein-coding | GO ID | GO:0000003 | UniProtAcc | Q8IY31 |
Top |
Malignant transformation analysis |
| Identification of the aberrant gene expression in precancerous and cancerous lesions by comparing the gene expression of stem-like cells in diseased tissues with normal stem cells |
| Entrez ID | Symbol | Replicates | Species | Organ | Tissue | Adj P-value | Log2FC | Malignancy |
| 90410 | IFT20 | GSM4909292 | Human | Breast | IDC | 1.58e-04 | 5.53e-01 | 0.1236 |
| 90410 | IFT20 | GSM4909293 | Human | Breast | IDC | 2.98e-05 | 2.69e-01 | 0.1581 |
| 90410 | IFT20 | GSM4909294 | Human | Breast | IDC | 6.27e-25 | 5.65e-01 | 0.2022 |
| 90410 | IFT20 | GSM4909296 | Human | Breast | IDC | 6.30e-07 | -1.57e-01 | 0.1524 |
| 90410 | IFT20 | GSM4909297 | Human | Breast | IDC | 2.14e-05 | -9.81e-02 | 0.1517 |
| 90410 | IFT20 | GSM4909311 | Human | Breast | IDC | 6.55e-19 | -1.77e-01 | 0.1534 |
| 90410 | IFT20 | GSM4909312 | Human | Breast | IDC | 1.35e-05 | -3.40e-02 | 0.1552 |
| 90410 | IFT20 | GSM4909313 | Human | Breast | IDC | 2.26e-02 | -6.24e-02 | 0.0391 |
| 90410 | IFT20 | GSM4909316 | Human | Breast | IDC | 5.34e-07 | 2.15e-01 | 0.21 |
| 90410 | IFT20 | GSM4909319 | Human | Breast | IDC | 2.82e-23 | -1.31e-01 | 0.1563 |
| 90410 | IFT20 | GSM4909320 | Human | Breast | IDC | 1.06e-02 | -2.28e-01 | 0.1575 |
| 90410 | IFT20 | GSM4909321 | Human | Breast | IDC | 5.08e-08 | -1.04e-01 | 0.1559 |
| 90410 | IFT20 | NCCBC14 | Human | Breast | DCIS | 5.64e-06 | 6.76e-02 | 0.2021 |
| 90410 | IFT20 | NCCBC5 | Human | Breast | DCIS | 9.16e-15 | 2.05e-01 | 0.2046 |
| 90410 | IFT20 | P1 | Human | Breast | IDC | 2.96e-10 | -1.01e-01 | 0.1527 |
| 90410 | IFT20 | DCIS2 | Human | Breast | DCIS | 3.17e-36 | 1.18e-01 | 0.0085 |
| 90410 | IFT20 | LZE2T | Human | Esophagus | ESCC | 2.79e-02 | 5.09e-01 | 0.082 |
| 90410 | IFT20 | LZE4T | Human | Esophagus | ESCC | 2.67e-08 | 1.92e-01 | 0.0811 |
| 90410 | IFT20 | LZE5T | Human | Esophagus | ESCC | 1.83e-02 | 3.22e-01 | 0.0514 |
| 90410 | IFT20 | LZE7T | Human | Esophagus | ESCC | 5.88e-04 | 1.91e-01 | 0.0667 |
| Page: 1 2 3 4 5 6 7 8 |
| Tissue | Expression Dynamics | Abbreviation |
| Breast | 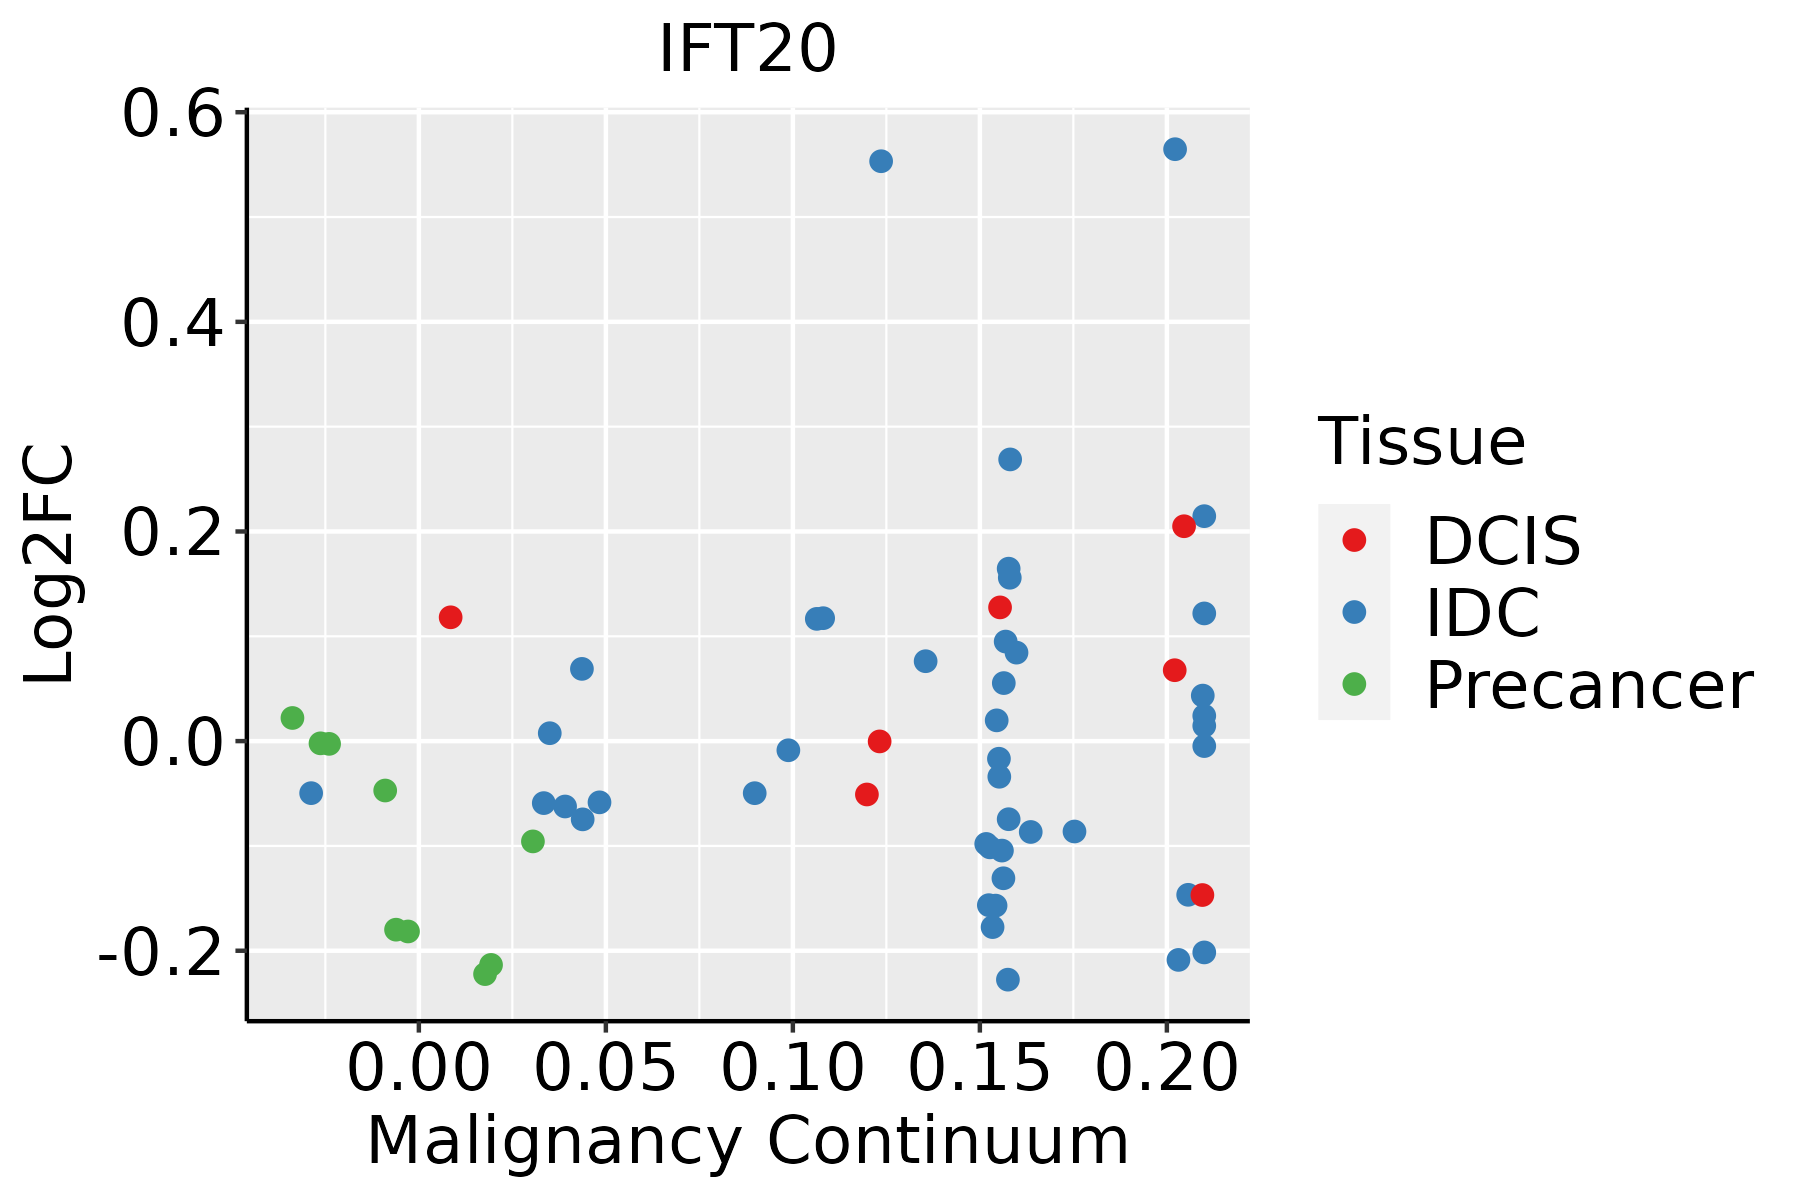 | IDC: Invasive ductal carcinoma |
| DCIS: Ductal carcinoma in situ | ||
| Precancer(BRCA1-mut): Precancerous lesion from BRCA1 mutation carriers | ||
| Esophagus | 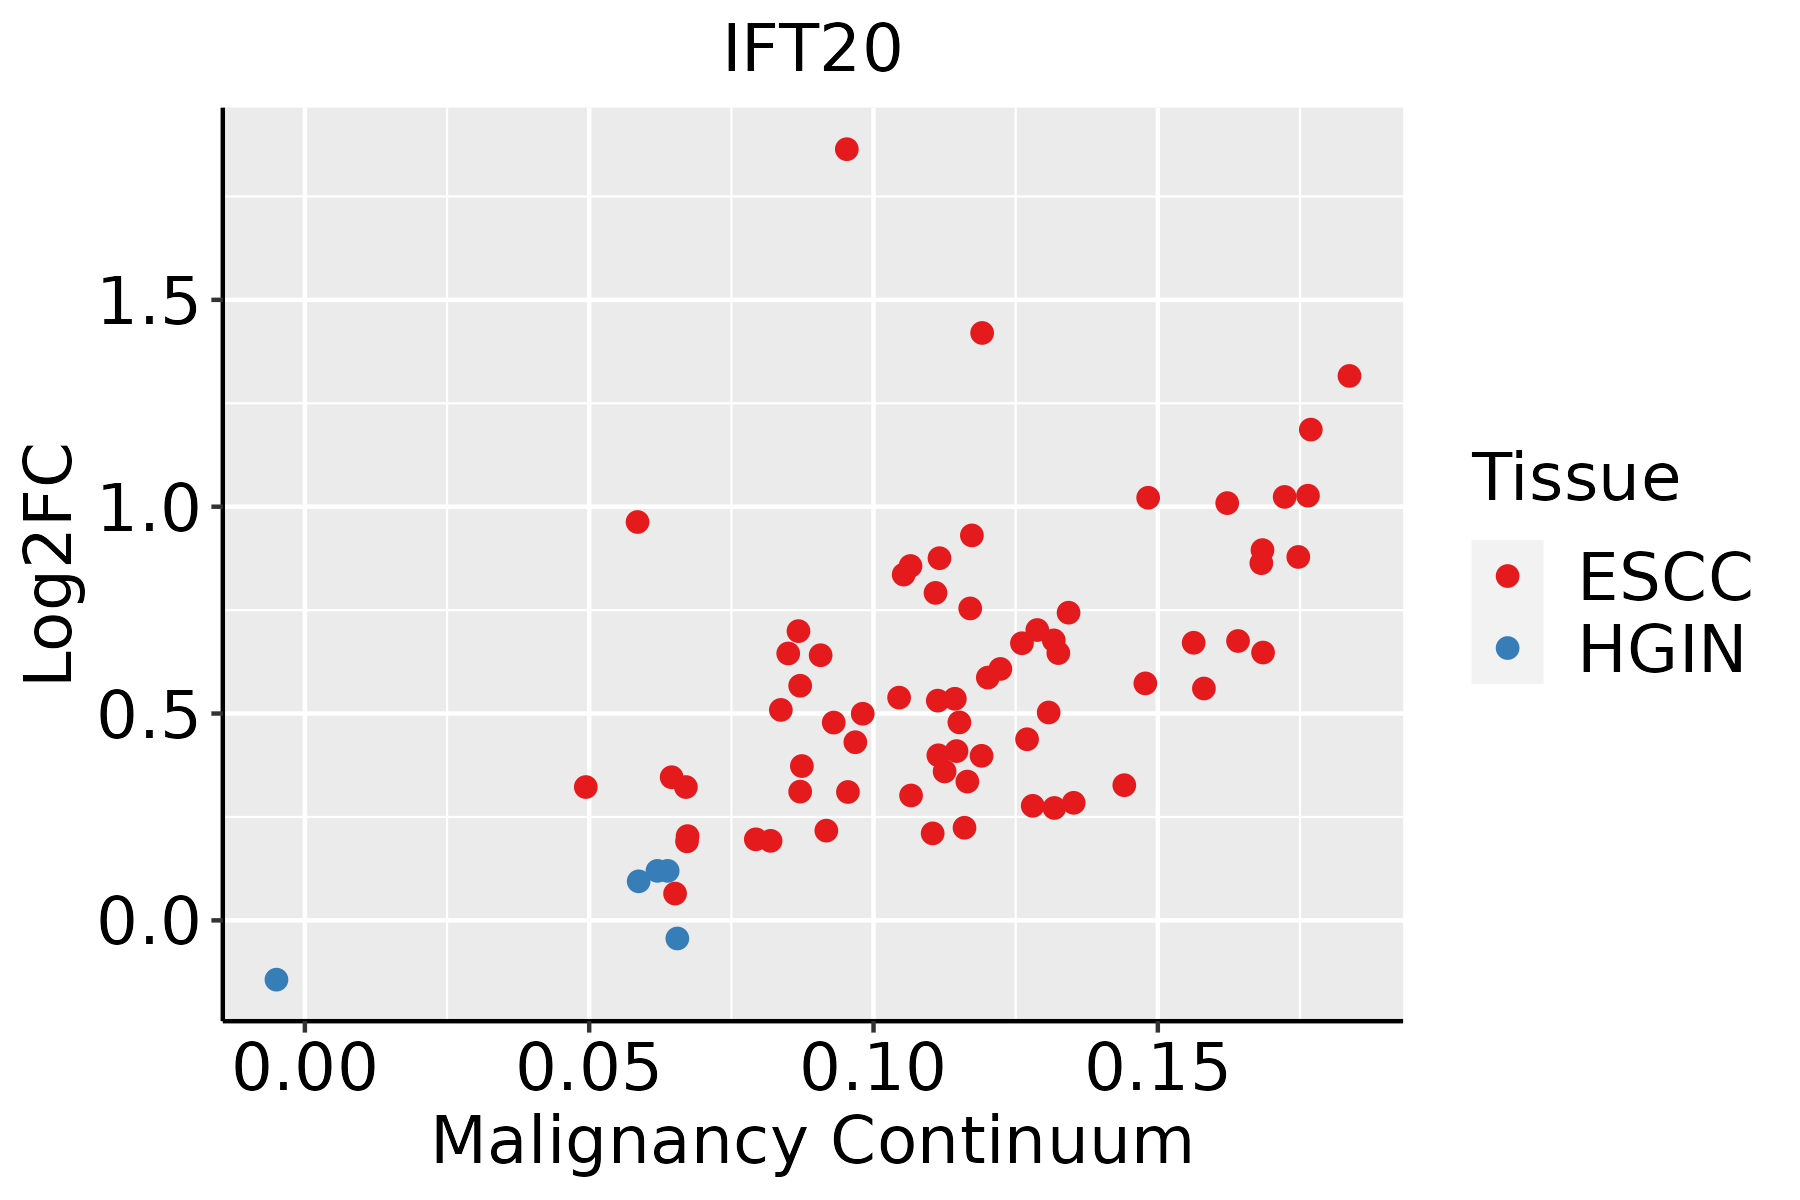 | ESCC: Esophageal squamous cell carcinoma |
| HGIN: High-grade intraepithelial neoplasias | ||
| LGIN: Low-grade intraepithelial neoplasias | ||
| Liver | 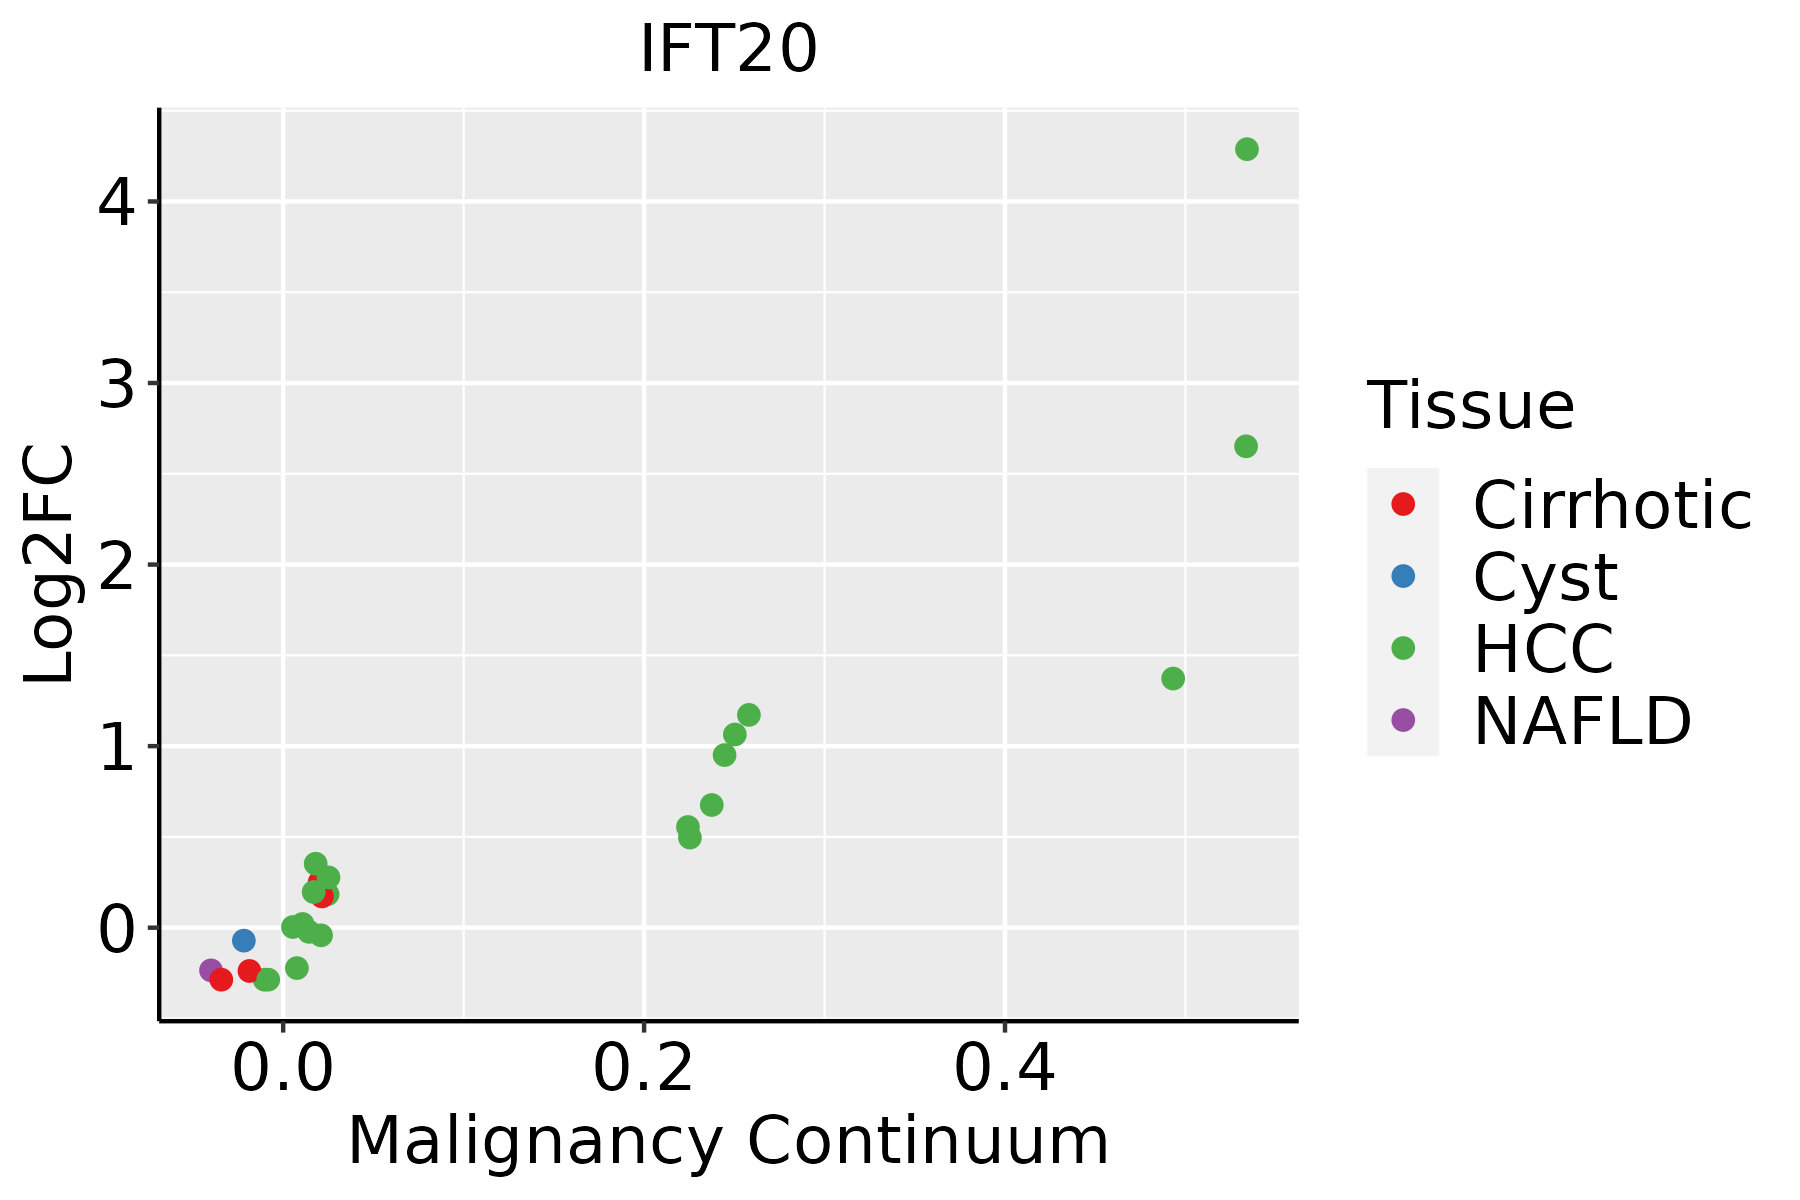 | HCC: Hepatocellular carcinoma |
| NAFLD: Non-alcoholic fatty liver disease | ||
| Oral Cavity | 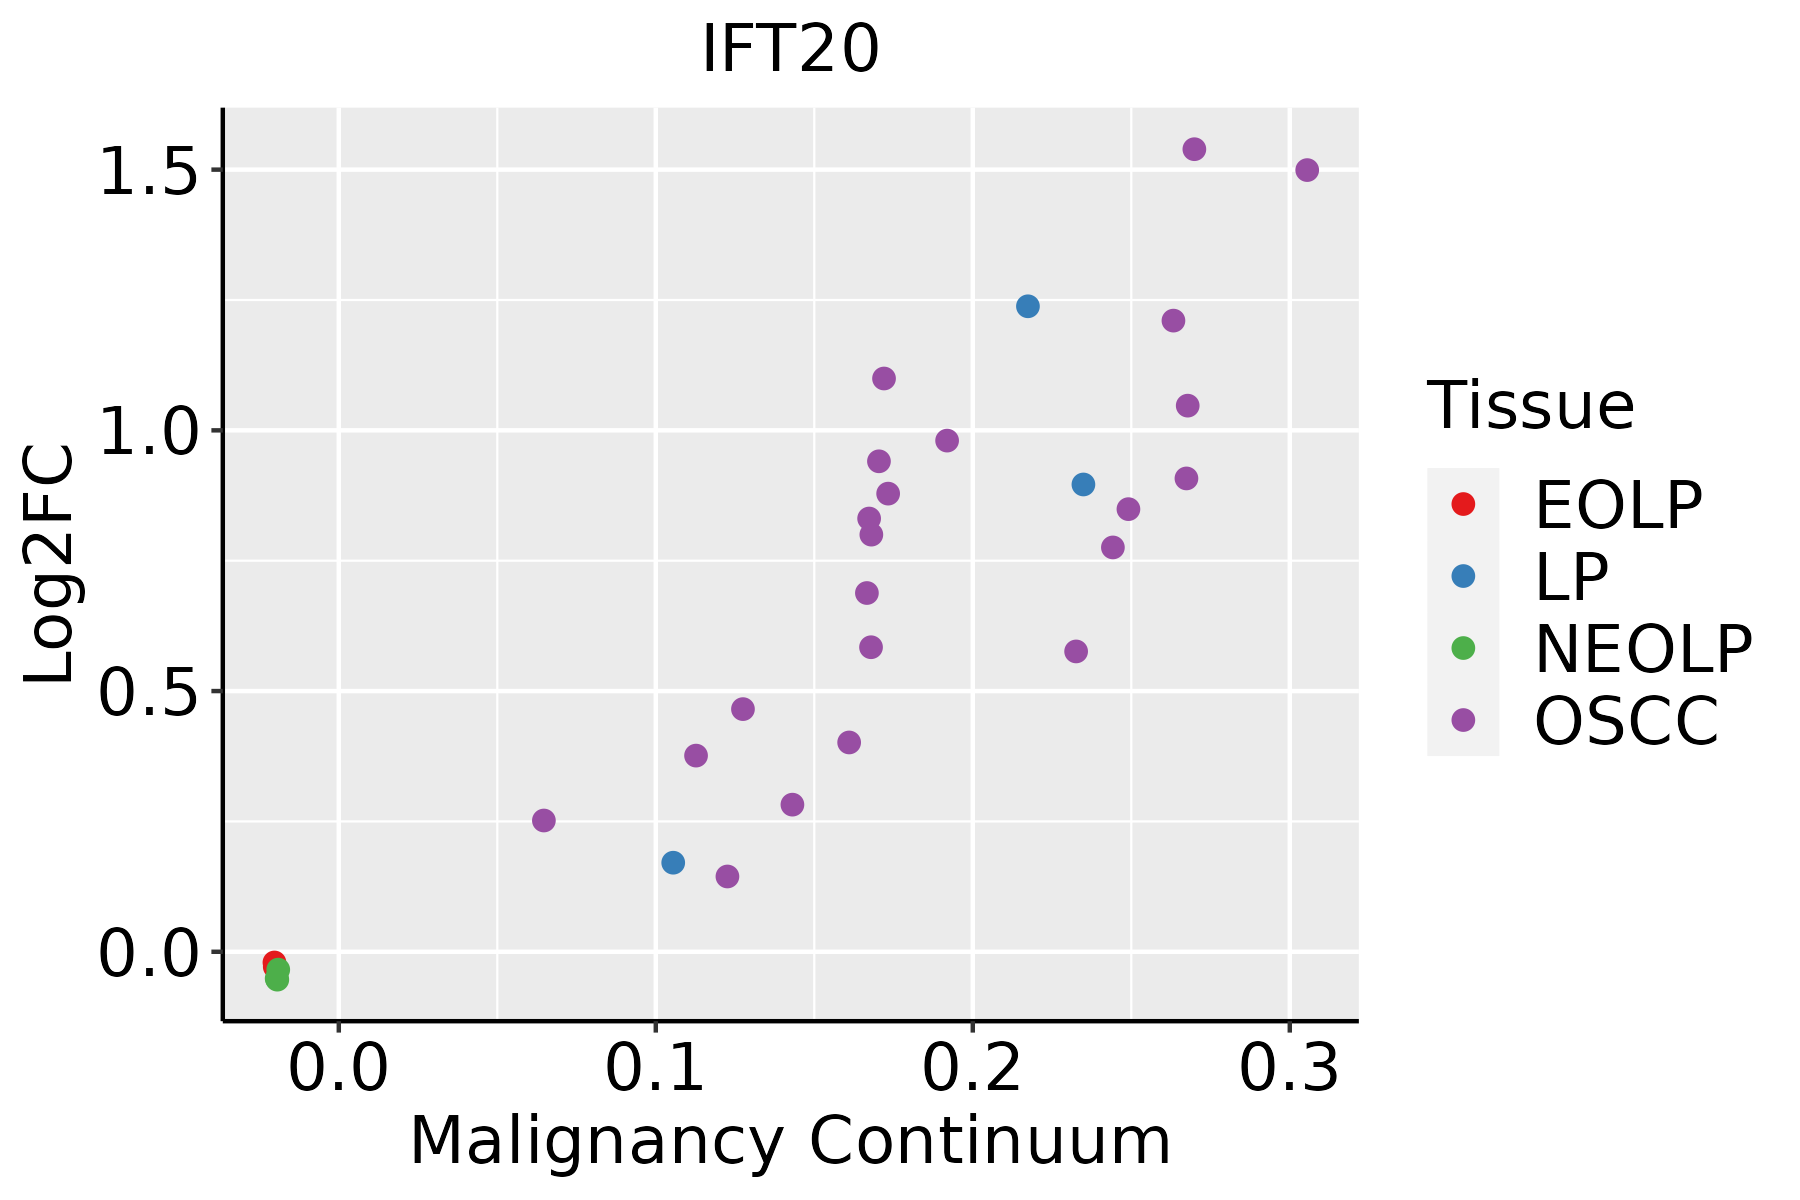 | EOLP: Erosive Oral lichen planus |
| LP: leukoplakia | ||
| NEOLP: Non-erosive oral lichen planus | ||
| OSCC: Oral squamous cell carcinoma | ||
| Prostate | 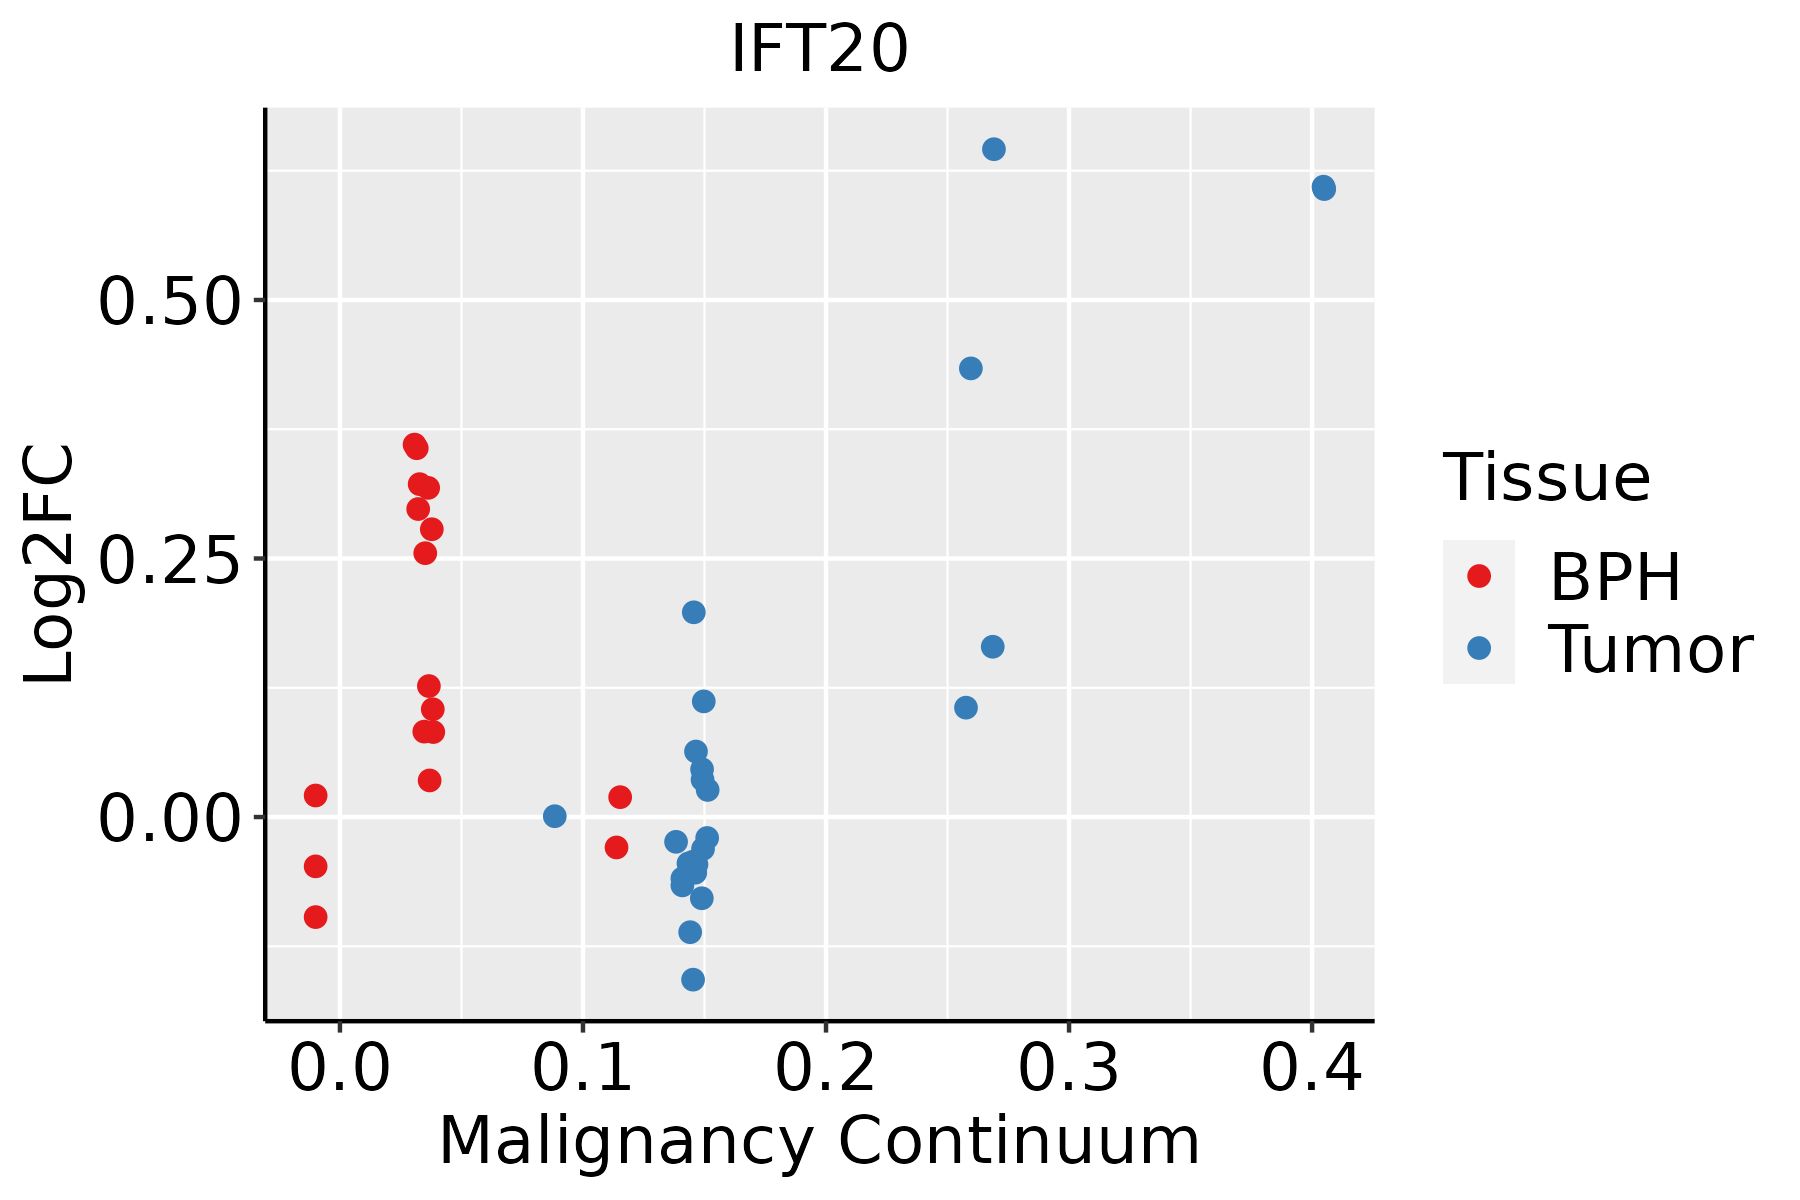 | BPH: Benign Prostatic Hyperplasia |
| Skin | 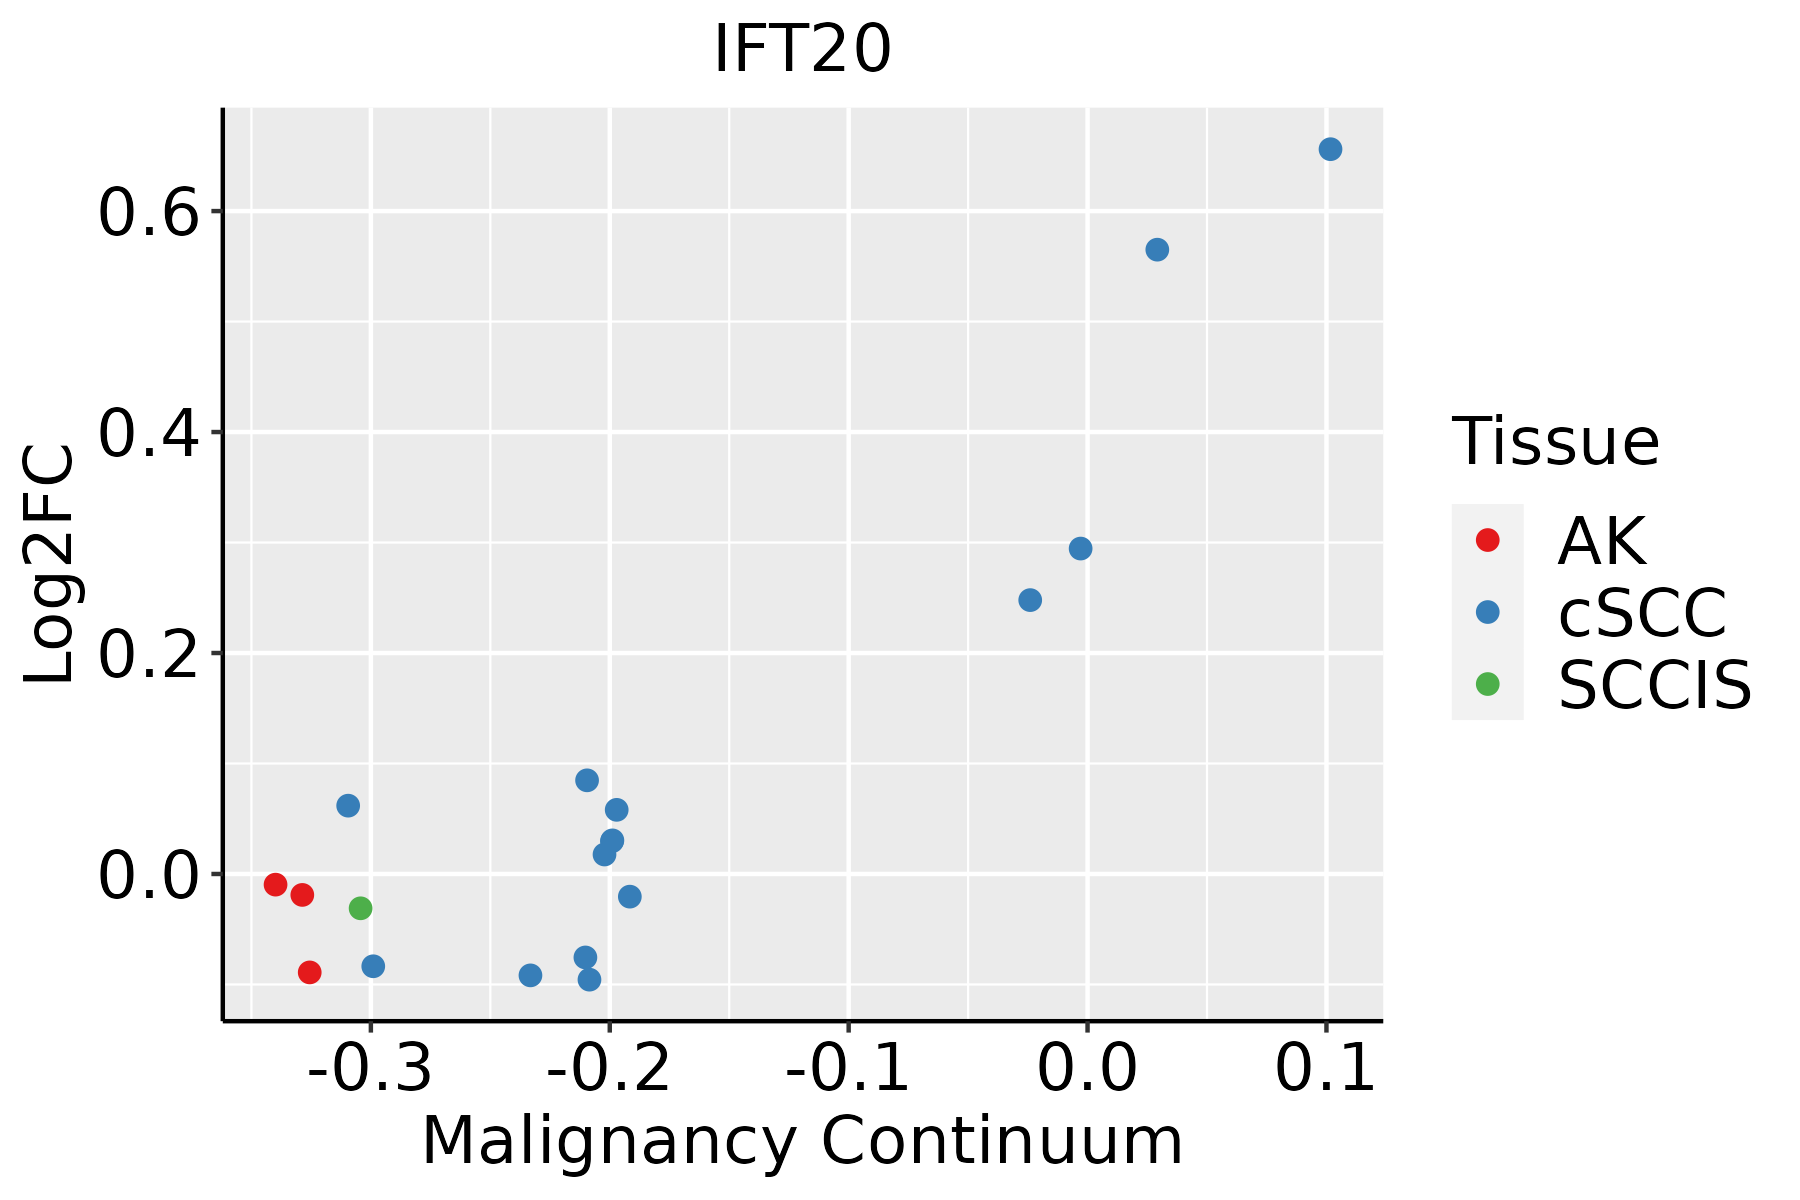 | AK: Actinic keratosis |
| cSCC: Cutaneous squamous cell carcinoma | ||
| SCCIS:squamous cell carcinoma in situ | ||
| Thyroid |  | ATC: Anaplastic thyroid cancer |
| HT: Hashimoto's thyroiditis | ||
| PTC: Papillary thyroid cancer |
| ∗log2FC in expression of this searched gene in stem-like cells from each diseased tissue sample relative to stem-like cells in normal samples in each tissue plotted against the malignancy continuum. Samples are colored based on if they are from different disease stage. |
Top |
Malignant transformation related pathway analysis |
| Find out the enriched GO biological processes and KEGG pathways involved in transition from healthy to precancer to cancer |
| Tissue | Disease Stage | Enriched GO biological Processes |
| Colorectum | AD |  |
| Colorectum | SER |  |
| Colorectum | MSS |  |
| Colorectum | MSI-H |  |
| Colorectum | FAP |  |
| ∗Top 15 enriched GO BP terms are showed in the bar plot of each disease state in each tissue. Each row represents a significant GO biological process which is colored according to the -log10(p.adjust). |
| Page: 1 2 3 4 5 6 7 8 9 |
| GO ID | Tissue | Disease Stage | Description | Gene Ratio | Bg Ratio | pvalue | p.adjust | Count |
| GO:00070334 | Prostate | BPH | vacuole organization | 45/3107 | 180/18723 | 2.49e-03 | 1.34e-02 | 45 |
| GO:0035051 | Prostate | BPH | cardiocyte differentiation | 40/3107 | 156/18723 | 2.58e-03 | 1.38e-02 | 40 |
| GO:00611624 | Prostate | BPH | establishment of monopolar cell polarity | 10/3107 | 24/18723 | 3.21e-03 | 1.67e-02 | 10 |
| GO:00451977 | Prostate | BPH | establishment or maintenance of epithelial cell apical/basal polarity | 15/3107 | 44/18723 | 3.59e-03 | 1.83e-02 | 15 |
| GO:0007611 | Prostate | BPH | learning or memory | 59/3107 | 255/18723 | 4.12e-03 | 2.04e-02 | 59 |
| GO:00613393 | Prostate | BPH | establishment or maintenance of monopolar cell polarity | 10/3107 | 25/18723 | 4.57e-03 | 2.19e-02 | 10 |
| GO:00350892 | Prostate | BPH | establishment of apical/basal cell polarity | 9/3107 | 22/18723 | 5.92e-03 | 2.73e-02 | 9 |
| GO:00017386 | Prostate | BPH | morphogenesis of a polarized epithelium | 25/3107 | 94/18723 | 9.36e-03 | 3.98e-02 | 25 |
| GO:00000453 | Prostate | BPH | autophagosome assembly | 26/3107 | 99/18723 | 9.68e-03 | 4.09e-02 | 26 |
| GO:00511466 | Prostate | BPH | striated muscle cell differentiation | 62/3107 | 283/18723 | 1.15e-02 | 4.68e-02 | 62 |
| GO:001605514 | Prostate | Tumor | Wnt signaling pathway | 131/3246 | 444/18723 | 1.16e-10 | 7.11e-09 | 131 |
| GO:019873814 | Prostate | Tumor | cell-cell signaling by wnt | 131/3246 | 446/18723 | 1.61e-10 | 9.69e-09 | 131 |
| GO:000716317 | Prostate | Tumor | establishment or maintenance of cell polarity | 74/3246 | 218/18723 | 2.00e-09 | 8.86e-08 | 74 |
| GO:007265917 | Prostate | Tumor | protein localization to plasma membrane | 90/3246 | 284/18723 | 2.07e-09 | 8.99e-08 | 90 |
| GO:003011114 | Prostate | Tumor | regulation of Wnt signaling pathway | 99/3246 | 328/18723 | 5.92e-09 | 2.34e-07 | 99 |
| GO:003070515 | Prostate | Tumor | cytoskeleton-dependent intracellular transport | 67/3246 | 195/18723 | 6.56e-09 | 2.53e-07 | 67 |
| GO:006082814 | Prostate | Tumor | regulation of canonical Wnt signaling pathway | 79/3246 | 253/18723 | 4.01e-08 | 1.25e-06 | 79 |
| GO:199077815 | Prostate | Tumor | protein localization to cell periphery | 97/3246 | 333/18723 | 5.88e-08 | 1.75e-06 | 97 |
| GO:001623614 | Prostate | Tumor | macroautophagy | 87/3246 | 291/18723 | 7.82e-08 | 2.16e-06 | 87 |
| GO:006007014 | Prostate | Tumor | canonical Wnt signaling pathway | 87/3246 | 303/18723 | 5.49e-07 | 1.17e-05 | 87 |
| Page: 1 2 3 4 5 6 7 8 9 10 11 12 13 14 15 16 17 18 19 20 |
| Pathway ID | Tissue | Disease Stage | Description | Gene Ratio | Bg Ratio | pvalue | p.adjust | qvalue | Count |
| Page: 1 |
Top |
Cell-cell communication analysis |
| Identification of potential cell-cell interactions between two cell types and their ligand-receptor pairs for different disease states |
| Ligand | Receptor | LRpair | Pathway | Tissue | Disease Stage |
| Page: 1 |
Top |
Single-cell gene regulatory network inference analysis |
| Find out the significant the regulons (TFs) and the target genes of each regulon across cell types for different disease states |
| TF | Cell Type | Tissue | Disease Stage | Target Gene | RSS | Regulon Activity |
| ∗The dot plots of a searched regulon are shown for all cell subpopulations in each disease state of each tissue based on the regulon specific score inferred using pySCENIC and by calculating the average expression. |
| Page: 1 |
Top |
Somatic mutation of malignant transformation related genes |
| Annotation of somatic variants for genes involved in malignant transformation |
| Hugo Symbol | Variant Class | Variant Classification | dbSNP RS | HGVSc | HGVSp | HGVSp Short | SWISSPROT | BIOTYPE | SIFT | PolyPhen | Tumor Sample Barcode | Tissue | Histology | Sex | Age | Stage | Therapy Types | Drugs | Outcome |
| IFT20 | SNV | Missense_Mutation | c.152N>T | p.Glu51Val | p.E51V | Q8IY31 | protein_coding | deleterious(0.01) | probably_damaging(0.914) | TCGA-E9-A22E-01 | Breast | breast invasive carcinoma | Female | <65 | III/IV | Chemotherapy | cyclophosphane | SD | |
| IFT20 | insertion | In_Frame_Ins | novel | c.190_191insTGAAAGGGTCCACGAAGTTGGCTGGCTCTCTGAAAG | p.Lys64delinsMetLysGlySerThrLysLeuAlaGlySerLeuLysGlu | p.K64delinsMKGSTKLAGSLKE | Q8IY31 | protein_coding | TCGA-B6-A0IK-01 | Breast | breast invasive carcinoma | Female | <65 | III/IV | Unknown | Unknown | PD | ||
| IFT20 | SNV | Missense_Mutation | novel | c.247N>T | p.Leu83Phe | p.L83F | Q8IY31 | protein_coding | deleterious(0.01) | possibly_damaging(0.51) | TCGA-A5-A0G2-01 | Endometrium | uterine corpus endometrioid carcinoma | Female | <65 | III/IV | Unknown | Unknown | SD |
| IFT20 | SNV | Missense_Mutation | c.341N>A | p.Ala114Asp | p.A114D | Q8IY31 | protein_coding | tolerated(0.05) | possibly_damaging(0.857) | TCGA-AP-A051-01 | Endometrium | uterine corpus endometrioid carcinoma | Female | >=65 | I/II | Unknown | Unknown | SD | |
| IFT20 | SNV | Missense_Mutation | rs372746932 | c.401N>A | p.Arg134Gln | p.R134Q | Q8IY31 | protein_coding | tolerated(0.11) | benign(0.169) | TCGA-AX-A1CE-01 | Endometrium | uterine corpus endometrioid carcinoma | Female | <65 | I/II | Unspecific | Paclitaxel | SD |
| IFT20 | SNV | Missense_Mutation | novel | c.80N>C | p.Met27Thr | p.M27T | Q8IY31 | protein_coding | deleterious(0) | benign(0.023) | TCGA-BG-A222-01 | Endometrium | uterine corpus endometrioid carcinoma | Female | <65 | I/II | Unknown | Unknown | SD |
| IFT20 | SNV | Missense_Mutation | novel | c.81N>A | p.Met27Ile | p.M27I | Q8IY31 | protein_coding | deleterious(0.03) | benign(0.013) | TCGA-86-7954-01 | Lung | lung adenocarcinoma | Female | >=65 | I/II | Chemotherapy | carboplatin | CR |
| IFT20 | SNV | Missense_Mutation | novel | c.281A>G | p.Glu94Gly | p.E94G | Q8IY31 | protein_coding | deleterious(0) | probably_damaging(0.967) | TCGA-MN-A4N4-01 | Lung | lung adenocarcinoma | Male | <65 | I/II | Unknown | Unknown | SD |
| Page: 1 |
Top |
Related drugs of malignant transformation related genes |
| Identification of chemicals and drugs interact with genes involved in malignant transfromation |
| (DGIdb 4.0) |
| Entrez ID | Symbol | Category | Interaction Types | Drug Claim Name | Drug Name | PMIDs |
| Page: 1 |

Copyright 2023-Present -The University of Texas Health Science Center at Houston |