Schematic overview of the cellular and molecular mechanisms involved in the cancer progression, including the proposed cellular and molecular mechanisms in cancer cells trajectory. AT1: alveolar type 1 cells; AT2: alveolar type 2 cells; AAH: atypical adenomatous hyperplasia; AIS: adenocarcinoma in situ; MIA: minimally invasive adenocarcinoma; IA: invasive adenocarcinoma; EMT: epithelial-mesenchymal transition

Home

Download

Statistics

Help

Contact

Center for Computational Systems Medicine
leaf

Gene summary

leaf

Malignant transformation analysis

leaf

Malignant transformation related pathway analysis

leaf

Cell-cell communication analysis

leaf

Single-cell gene regulatory network inference analysis

leaf

Somatic mutation of malignant transformation related genes

leaf

Related drugs of malignant transformation related genes

Gene: ICK

Gene summary for ICK

check button Gene summary.

Gene informationSpeciesHuman
Gene symbol

ICK

Gene ID

22858

Gene nameciliogenesis associated kinase 1
Gene AliasECO
Cytomap6p12.1
Gene Typeprotein-coding
GO ID

GO:0006464

UniProtAcc

A0A024RD59


Top

Malignant transformation analysis

check button Identification of the aberrant gene expression in precancerous and cancerous lesions by comparing the gene expression of stem-like cells in diseased tissues with normal stem cells
check button Malignant transformation involving gene list.
Entrez IDSymbolReplicatesSpeciesOrganTissueAdj P-valueLog2FCMalignancy
22858ICKLZE2DHumanEsophagusHGIN8.16e-034.22e-010.0642
22858ICKLZE2THumanEsophagusESCC4.21e-051.13e+000.082
22858ICKLZE4THumanEsophagusESCC3.24e-081.78e-010.0811
22858ICKLZE5THumanEsophagusESCC1.81e-034.51e-010.0514
22858ICKLZE7THumanEsophagusESCC4.11e-116.09e-010.0667
22858ICKLZE8THumanEsophagusESCC5.97e-046.92e-020.067
22858ICKLZE20THumanEsophagusESCC5.26e-052.78e-010.0662
22858ICKLZE24THumanEsophagusESCC2.22e-164.97e-010.0596
22858ICKLZE21THumanEsophagusESCC3.36e-073.86e-010.0655
22858ICKP1T-EHumanEsophagusESCC2.28e-074.15e-010.0875
22858ICKP2T-EHumanEsophagusESCC1.43e-153.08e-010.1177
22858ICKP4T-EHumanEsophagusESCC6.71e-317.56e-010.1323
22858ICKP5T-EHumanEsophagusESCC2.98e-037.61e-020.1327
22858ICKP8T-EHumanEsophagusESCC9.58e-142.75e-010.0889
22858ICKP9T-EHumanEsophagusESCC9.95e-204.63e-010.1131
22858ICKP10T-EHumanEsophagusESCC7.51e-163.66e-010.116
22858ICKP11T-EHumanEsophagusESCC2.23e-041.88e-010.1426
22858ICKP12T-EHumanEsophagusESCC8.75e-318.12e-010.1122
22858ICKP15T-EHumanEsophagusESCC1.10e-142.92e-010.1149
22858ICKP16T-EHumanEsophagusESCC8.31e-194.04e-010.1153
Page: 1 2 3 4 5 

check button Transcriptomic changes along malignancy continuum.
TissueExpression DynamicsAbbreviation
EsophagusThe image shows the transcriptomic changes along malignancy continuum.log2FC in expression of this searched gene in stem-like cells from each diseased tissue sample relative to stem-like cells in normal samples in each tissue plotted against the malignancy continuum. Samples are colored based on if they are from different disease stage.
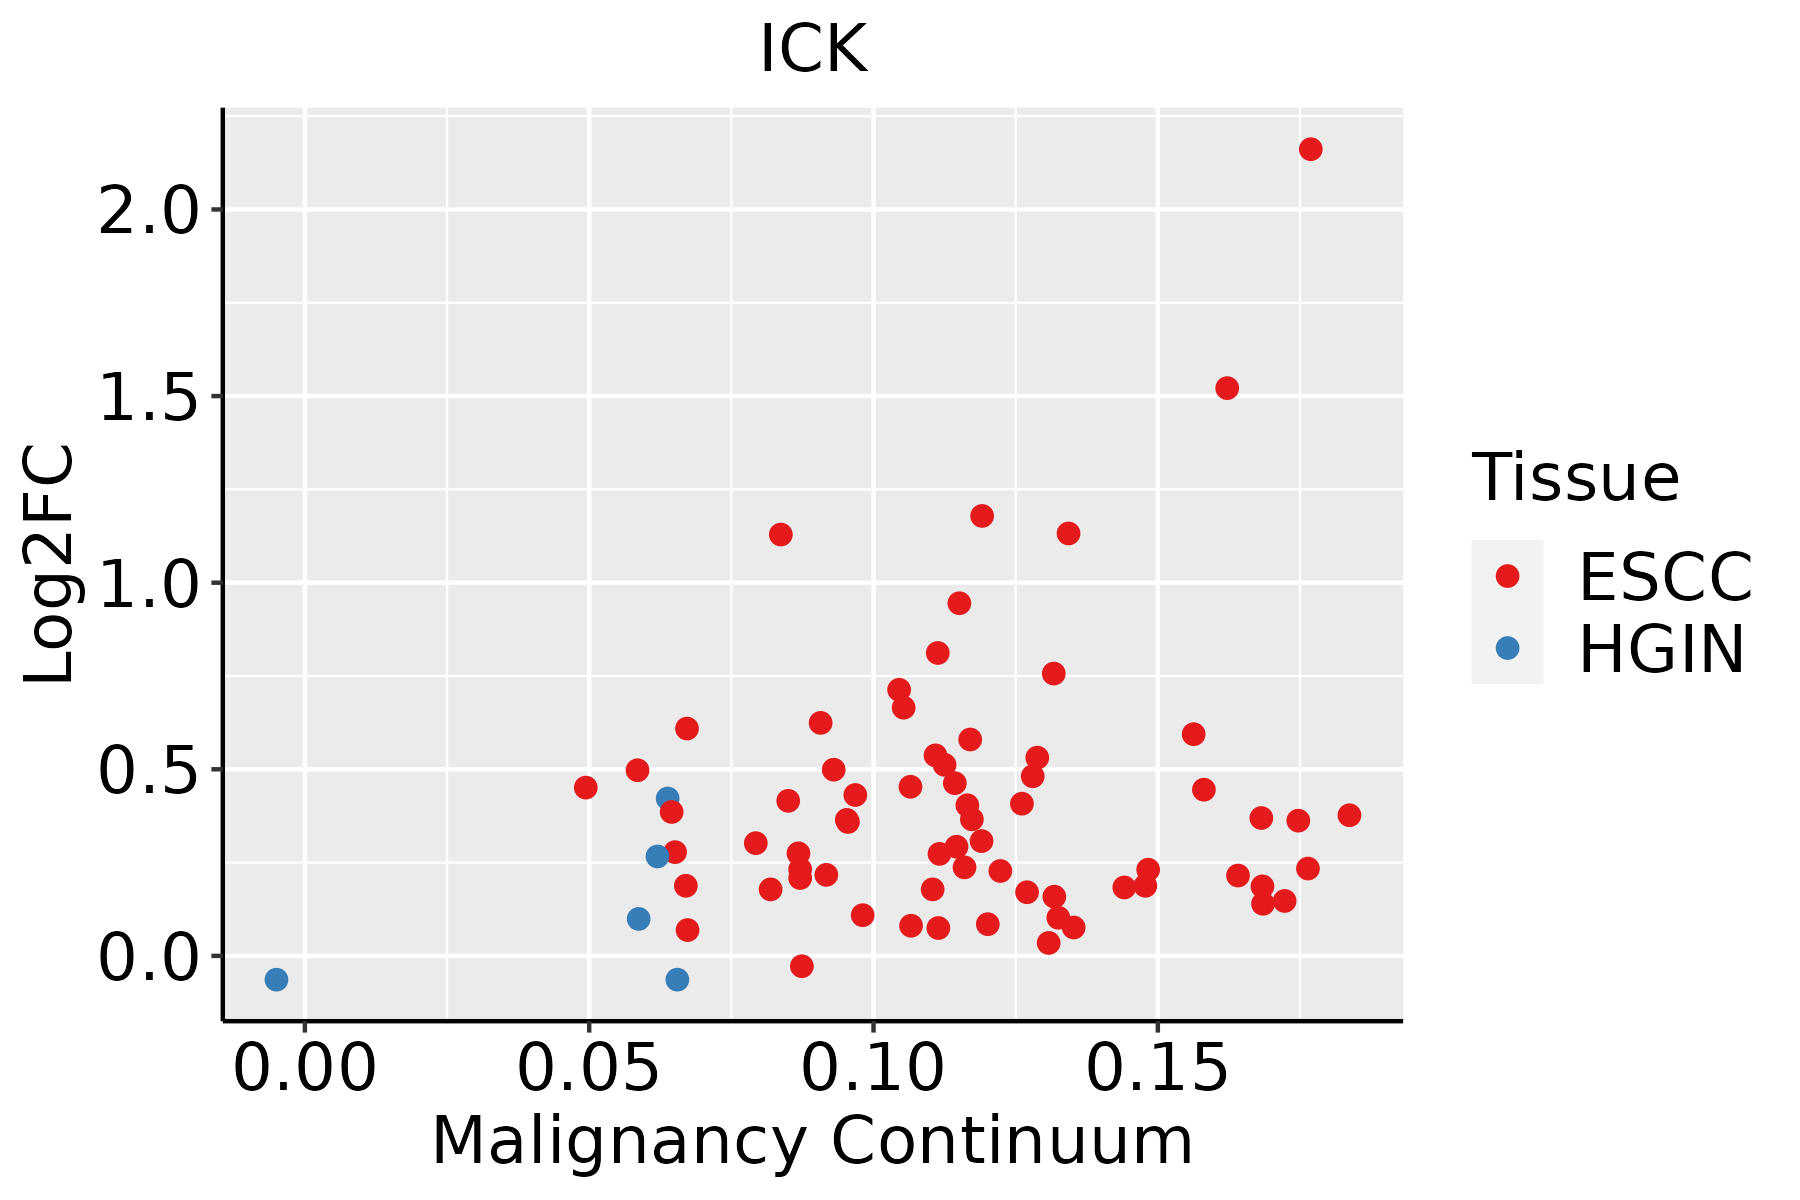
ESCC: Esophageal squamous cell carcinoma
HGIN: High-grade intraepithelial neoplasias
LGIN: Low-grade intraepithelial neoplasias
LiverThe image shows the transcriptomic changes along malignancy continuum.log2FC in expression of this searched gene in stem-like cells from each diseased tissue sample relative to stem-like cells in normal samples in each tissue plotted against the malignancy continuum. Samples are colored based on if they are from different disease stage.
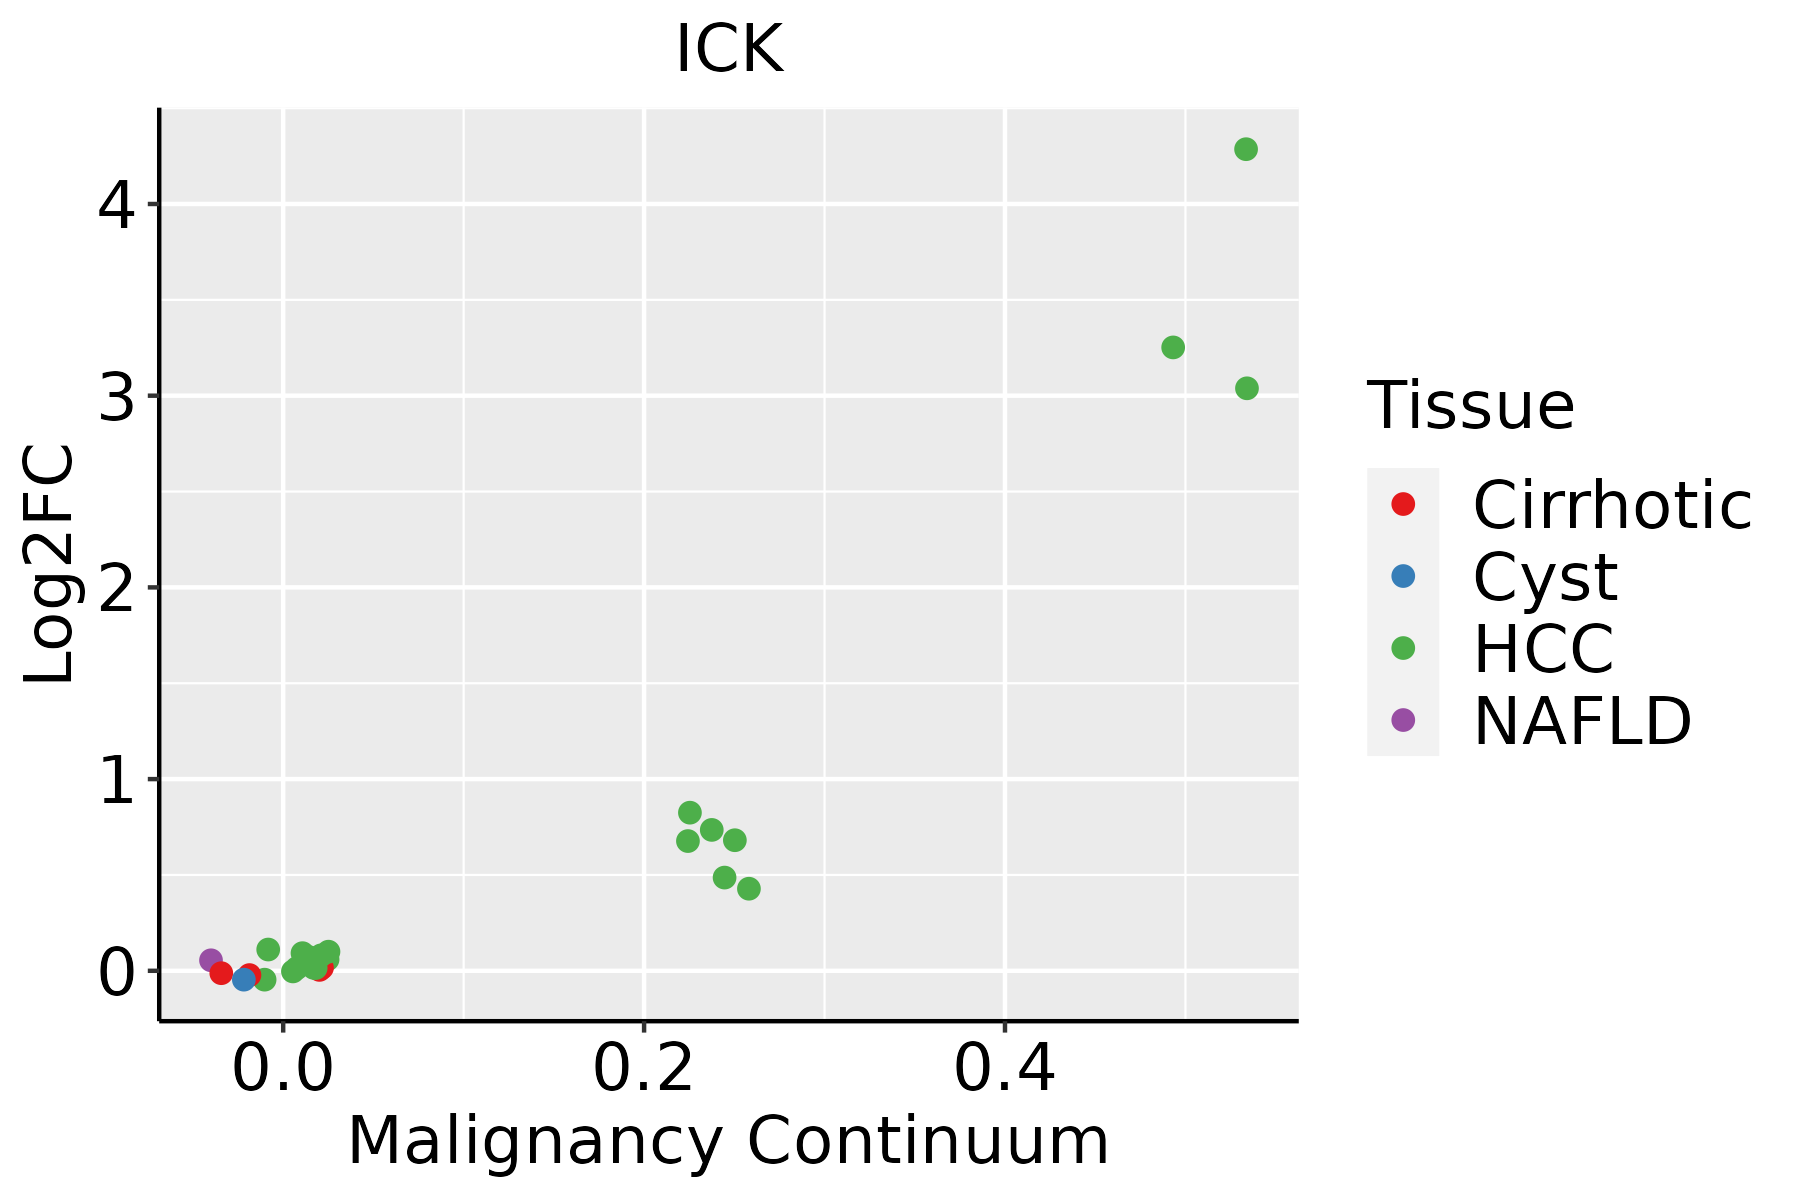
HCC: Hepatocellular carcinoma
NAFLD: Non-alcoholic fatty liver disease
Oral CavityThe image shows the transcriptomic changes along malignancy continuum.log2FC in expression of this searched gene in stem-like cells from each diseased tissue sample relative to stem-like cells in normal samples in each tissue plotted against the malignancy continuum. Samples are colored based on if they are from different disease stage.EOLP: Erosive Oral lichen planus
LP: leukoplakia
NEOLP: Non-erosive oral lichen planus
OSCC: Oral squamous cell carcinoma
ProstateThe image shows the transcriptomic changes along malignancy continuum.log2FC in expression of this searched gene in stem-like cells from each diseased tissue sample relative to stem-like cells in normal samples in each tissue plotted against the malignancy continuum. Samples are colored based on if they are from different disease stage.
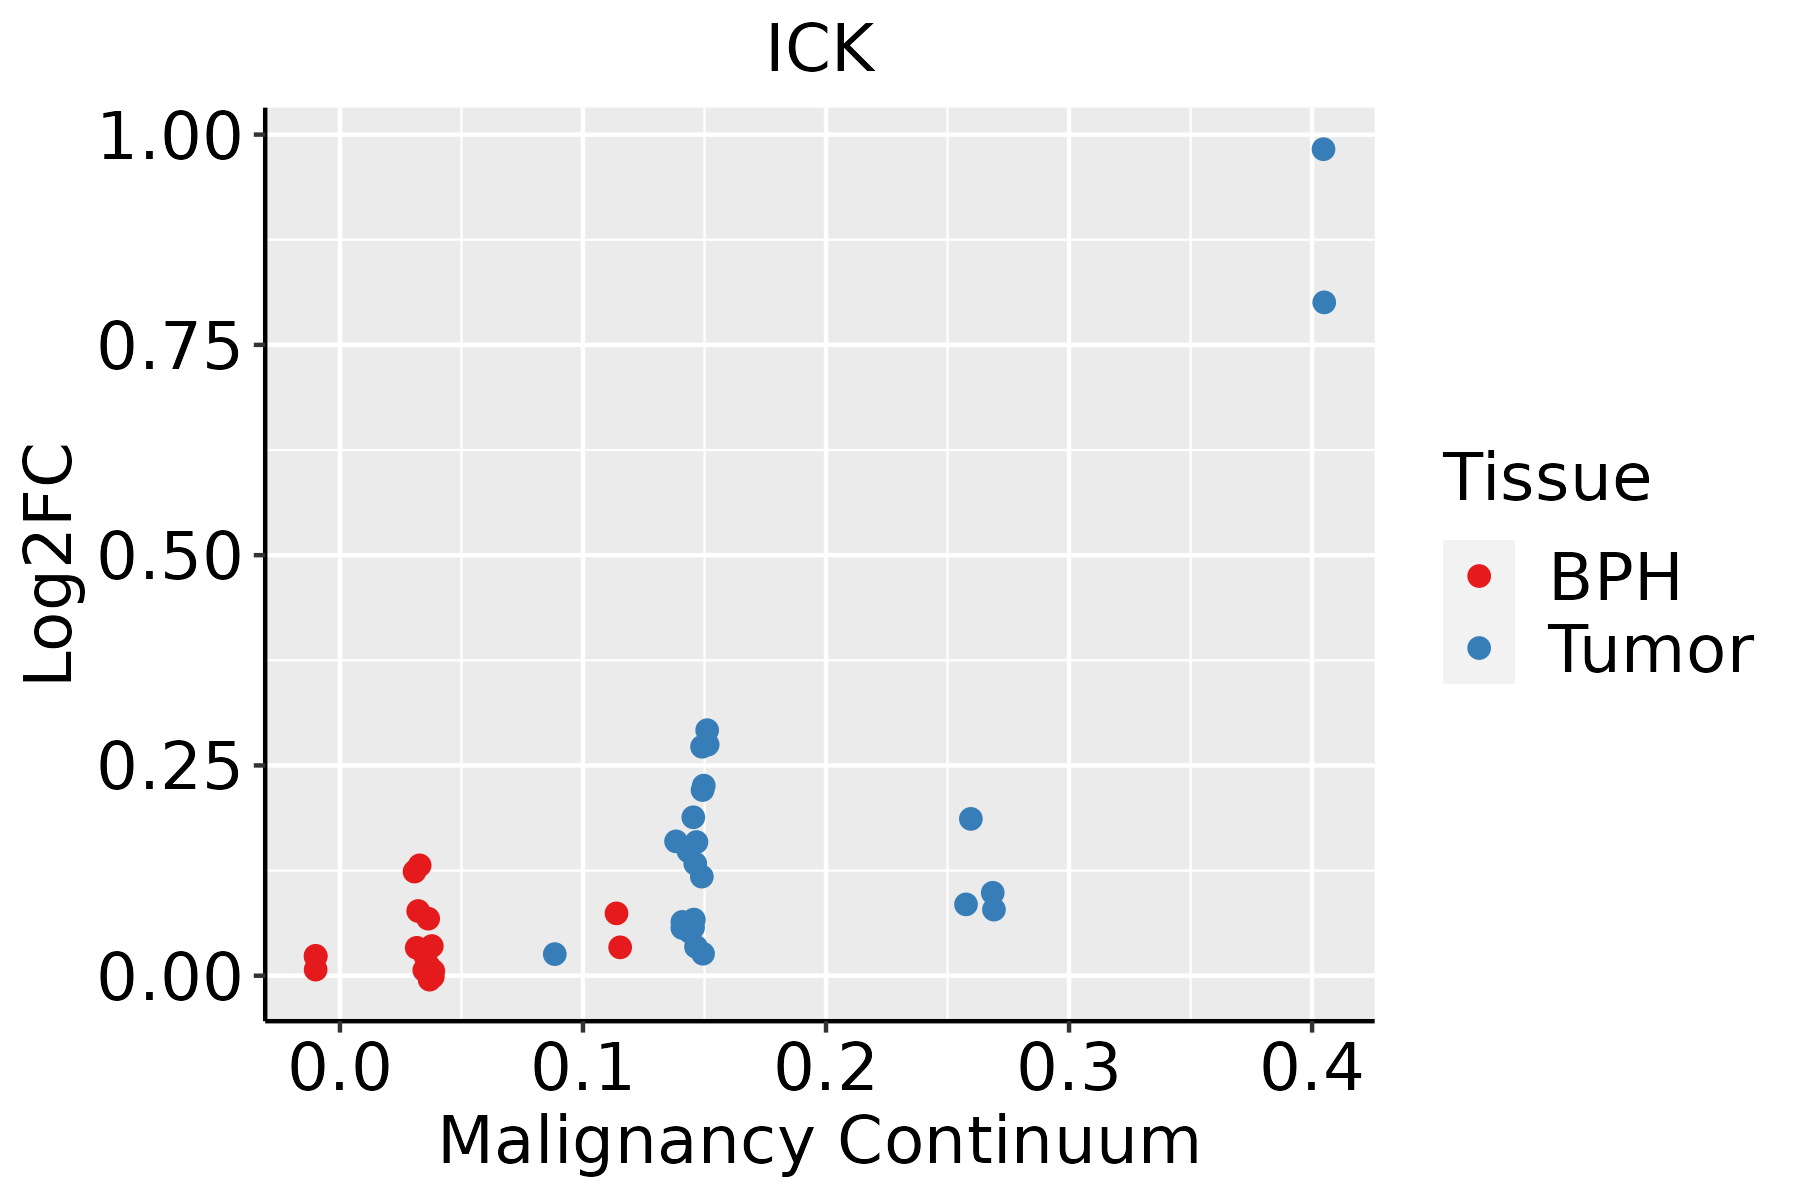
BPH: Benign Prostatic Hyperplasia
ThyroidThe image shows the transcriptomic changes along malignancy continuum.log2FC in expression of this searched gene in stem-like cells from each diseased tissue sample relative to stem-like cells in normal samples in each tissue plotted against the malignancy continuum. Samples are colored based on if they are from different disease stage.
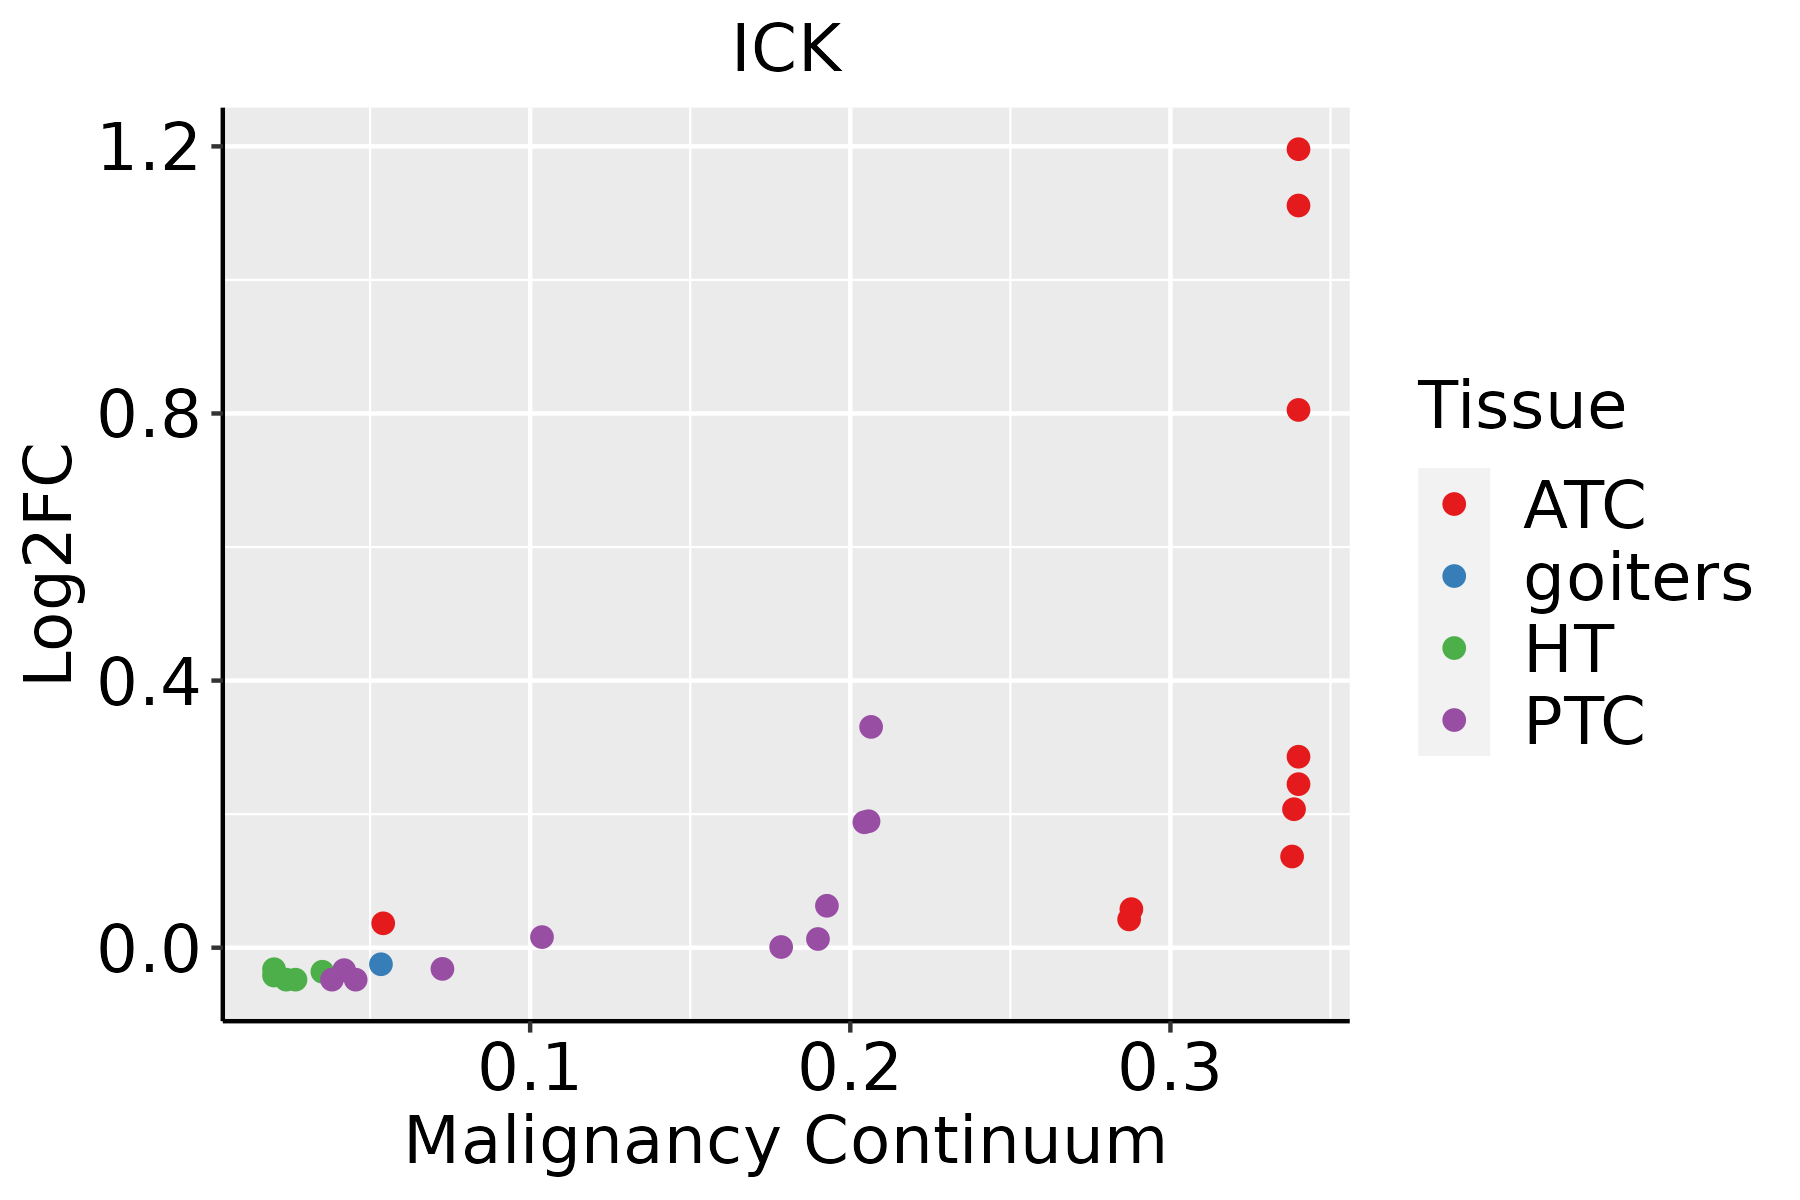
ATC: Anaplastic thyroid cancer
HT: Hashimoto's thyroiditis
PTC: Papillary thyroid cancer
∗log2FC in expression of this searched gene in stem-like cells from each diseased tissue sample relative to stem-like cells in normal samples in each tissue plotted against the malignancy continuum. Samples are colored based on if they are from different disease stage.

Top

Malignant transformation related pathway analysis

check buttonFind out the enriched GO biological processes and KEGG pathways involved in transition from healthy to precancer to cancer
check button Figure of enriched GO biological processes.
TissueDisease StageEnriched GO biological Processes
ColorectumADGO analysis - Figure of enriched GO biological processes: Top 15 enriched GO BP terms are showed in the bar plot of each disease state in each tissue. Each row represents a significant GO biological process which is colored according to the -log10(p.adjust).
ColorectumSERGO analysis - Figure of enriched GO biological processes: Top 15 enriched GO BP terms are showed in the bar plot of each disease state in each tissue. Each row represents a significant GO biological process which is colored according to the -log10(p.adjust).
ColorectumMSSGO analysis - Figure of enriched GO biological processes: Top 15 enriched GO BP terms are showed in the bar plot of each disease state in each tissue. Each row represents a significant GO biological process which is colored according to the -log10(p.adjust).
ColorectumMSI-HGO analysis - Figure of enriched GO biological processes: Top 15 enriched GO BP terms are showed in the bar plot of each disease state in each tissue. Each row represents a significant GO biological process which is colored according to the -log10(p.adjust).
ColorectumFAPGO analysis - Figure of enriched GO biological processes: Top 15 enriched GO BP terms are showed in the bar plot of each disease state in each tissue. Each row represents a significant GO biological process which is colored according to the -log10(p.adjust).
∗Top 15 enriched GO BP terms are showed in the bar plot of each disease state in each tissue. Each row represents a significant GO biological process which is colored according to the -log10(p.adjust).
Page: 1 2 3 4 5 6 7 8 9 

check button Enriched GO biological processes.
GO IDTissueDisease StageDescriptionGene RatioBg Ratiopvaluep.adjustCount
GO:0031331210ThyroidATCpositive regulation of cellular catabolic process258/6293427/187232.09e-301.65e-27258
GO:004217635ThyroidATCregulation of protein catabolic process239/6293391/187232.63e-291.85e-26239
GO:007259429ThyroidATCestablishment of protein localization to organelle247/6293422/187232.88e-261.40e-23247
GO:190336235ThyroidATCregulation of cellular protein catabolic process168/6293255/187233.50e-261.58e-23168
GO:190305035ThyroidATCregulation of proteolysis involved in cellular protein catabolic process146/6293221/187234.18e-231.20e-20146
GO:006113633ThyroidATCregulation of proteasomal protein catabolic process128/6293187/187231.63e-224.30e-20128
GO:2000058210ThyroidATCregulation of ubiquitin-dependent protein catabolic process116/6293164/187232.15e-225.43e-20116
GO:0032434210ThyroidATCregulation of proteasomal ubiquitin-dependent protein catabolic process100/6293134/187232.41e-225.86e-20100
GO:0045732210ThyroidATCpositive regulation of protein catabolic process148/6293231/187231.93e-214.36e-19148
GO:003450423ThyroidATCprotein localization to nucleus175/6293290/187236.23e-211.23e-18175
GO:000691326ThyroidATCnucleocytoplasmic transport180/6293301/187236.97e-211.30e-18180
GO:005116926ThyroidATCnuclear transport180/6293301/187236.97e-211.30e-18180
GO:190336434ThyroidATCpositive regulation of cellular protein catabolic process109/6293155/187238.26e-211.49e-18109
GO:190332034ThyroidATCregulation of protein modification by small protein conjugation or removal152/6293242/187239.76e-211.71e-18152
GO:190180027ThyroidATCpositive regulation of proteasomal protein catabolic process85/6293114/187233.70e-195.20e-1785
GO:003139634ThyroidATCregulation of protein ubiquitination132/6293210/187233.13e-183.98e-16132
GO:003243627ThyroidATCpositive regulation of proteasomal ubiquitin-dependent protein catabolic process70/629390/187239.72e-181.10e-1570
GO:190305227ThyroidATCpositive regulation of proteolysis involved in cellular protein catabolic process93/6293133/187231.06e-171.18e-1593
GO:001605525ThyroidATCWnt signaling pathway234/6293444/187234.64e-174.31e-15234
GO:019873825ThyroidATCcell-cell signaling by wnt234/6293446/187239.26e-178.25e-15234
Page: 1 2 3 4 5 6 7 8 9 10 11 12 13 14 

check button Enriched KEGG pathways.
Pathway IDTissueDisease StageDescriptionGene RatioBg Ratiopvaluep.adjustqvalueCount
Page: 1 

Top

Cell-cell communication analysis

check buttonIdentification of potential cell-cell interactions between two cell types and their ligand-receptor pairs for different disease states
LigandReceptorLRpairPathwayTissueDisease Stage
Page: 1 

Top

Single-cell gene regulatory network inference analysis

check buttonFind out the significant the regulons (TFs) and the target genes of each regulon across cell types for different disease states
TFCell TypeTissueDisease StageTarget GeneRSSRegulon Activity
∗The dot plots of a searched regulon are shown for all cell subpopulations in each disease state of each tissue based on the regulon specific score inferred using pySCENIC and by calculating the average expression.
Page: 1 

Top

Somatic mutation of malignant transformation related genes

check buttonAnnotation of somatic variants for genes involved in malignant transformation
Hugo SymbolVariant ClassVariant ClassificationdbSNP RSHGVScHGVSpHGVSp ShortSWISSPROTBIOTYPESIFTPolyPhenTumor Sample BarcodeTissueHistologySexAgeStageTherapy TypesDrugsOutcome
ICKSNVMissense_Mutationnovelc.1348G>Cp.Glu450Glnp.E450QQ9UPZ9protein_codingtolerated(0.15)benign(0.015)TCGA-3C-AALI-01Breastbreast invasive carcinomaFemale<65I/IIUnspecificPoly EComplete Response
ICKSNVMissense_Mutationnovelc.1126N>Cp.Ser376Prop.S376PQ9UPZ9protein_codingtolerated(0.14)benign(0.009)TCGA-A2-A1G4-01Breastbreast invasive carcinomaFemale>=65III/IVChemotherapyadriamycinSD
ICKSNVMissense_Mutationnovelc.1126T>Cp.Ser376Prop.S376PQ9UPZ9protein_codingtolerated(0.14)benign(0.009)TCGA-A8-A06R-01Breastbreast invasive carcinomaFemale>=65I/IIChemotherapy5-fluorouracilCR
ICKSNVMissense_Mutationc.613G>Ap.Glu205Lysp.E205KQ9UPZ9protein_codingdeleterious(0)probably_damaging(0.969)TCGA-AC-A23H-01Breastbreast invasive carcinomaFemale>=65I/IIUnknownUnknownPD
ICKSNVMissense_Mutationrs561765544c.995G>Ap.Arg332Glnp.R332QQ9UPZ9protein_codingtolerated(0.52)benign(0.007)TCGA-AN-A046-01Breastbreast invasive carcinomaFemale>=65I/IIUnknownUnknownSD
ICKSNVMissense_Mutationc.932N>Tp.Ala311Valp.A311VQ9UPZ9protein_codingtolerated(0.31)benign(0.001)TCGA-AR-A0U0-01Breastbreast invasive carcinomaFemale>=65I/IIUnknownUnknownSD
ICKSNVMissense_Mutationnovelc.1126N>Cp.Ser376Prop.S376PQ9UPZ9protein_codingtolerated(0.14)benign(0.009)TCGA-BH-A1FH-01Breastbreast invasive carcinomaFemale<65III/IVUnknownUnknownPD
ICKSNVMissense_Mutationnovelc.1126T>Cp.Ser376Prop.S376PQ9UPZ9protein_codingtolerated(0.14)benign(0.009)TCGA-C8-A273-01Breastbreast invasive carcinomaFemale<65I/IIHormone TherapytamoxiphenSD
ICKSNVMissense_Mutationnovelc.1126N>Cp.Ser376Prop.S376PQ9UPZ9protein_codingtolerated(0.14)benign(0.009)TCGA-D8-A1JT-01Breastbreast invasive carcinomaFemale>=65I/IIHormone TherapyarimidexSD
ICKSNVMissense_Mutationnovelc.1126N>Cp.Ser376Prop.S376PQ9UPZ9protein_codingtolerated(0.14)benign(0.009)TCGA-D8-A1XG-01Breastbreast invasive carcinomaFemale>=65III/IVUnknownUnknownSD
Page: 1 2 3 4 5 6 7 

Top

Related drugs of malignant transformation related genes

check buttonIdentification of chemicals and drugs interact with genes involved in malignant transfromation
(DGIdb 4.0)
Entrez IDSymbolCategoryInteraction TypesDrug Claim NameDrug NamePMIDs
Page: 1