
|
|||||
|
 | |
| |
| |
| |
| |
| |
|
Gene: HYAL2 |
Gene summary for HYAL2 |
| Gene information | Species | Human | Gene symbol | HYAL2 | Gene ID | 8692 |
| Gene name | hyaluronidase 2 | |
| Gene Alias | LUCA2 | |
| Cytomap | 3p21.31 | |
| Gene Type | protein-coding | GO ID | GO:0000165 | UniProtAcc | Q12891 |
Top |
Malignant transformation analysis |
| Identification of the aberrant gene expression in precancerous and cancerous lesions by comparing the gene expression of stem-like cells in diseased tissues with normal stem cells |
| Entrez ID | Symbol | Replicates | Species | Organ | Tissue | Adj P-value | Log2FC | Malignancy |
| 8692 | HYAL2 | LZE7T | Human | Esophagus | ESCC | 9.76e-03 | 1.32e-01 | 0.0667 |
| 8692 | HYAL2 | LZE24T | Human | Esophagus | ESCC | 1.33e-12 | 3.40e-01 | 0.0596 |
| 8692 | HYAL2 | LZE21T | Human | Esophagus | ESCC | 3.39e-02 | 2.32e-01 | 0.0655 |
| 8692 | HYAL2 | P1T-E | Human | Esophagus | ESCC | 4.21e-05 | 3.87e-01 | 0.0875 |
| 8692 | HYAL2 | P2T-E | Human | Esophagus | ESCC | 1.58e-21 | 4.31e-01 | 0.1177 |
| 8692 | HYAL2 | P4T-E | Human | Esophagus | ESCC | 5.73e-33 | 7.54e-01 | 0.1323 |
| 8692 | HYAL2 | P5T-E | Human | Esophagus | ESCC | 6.13e-03 | 1.68e-01 | 0.1327 |
| 8692 | HYAL2 | P8T-E | Human | Esophagus | ESCC | 2.28e-09 | 2.98e-01 | 0.0889 |
| 8692 | HYAL2 | P9T-E | Human | Esophagus | ESCC | 1.06e-10 | 4.56e-01 | 0.1131 |
| 8692 | HYAL2 | P10T-E | Human | Esophagus | ESCC | 1.38e-11 | 3.10e-01 | 0.116 |
| 8692 | HYAL2 | P11T-E | Human | Esophagus | ESCC | 4.98e-16 | 6.29e-01 | 0.1426 |
| 8692 | HYAL2 | P12T-E | Human | Esophagus | ESCC | 4.52e-24 | 4.75e-01 | 0.1122 |
| 8692 | HYAL2 | P15T-E | Human | Esophagus | ESCC | 2.51e-12 | 3.61e-01 | 0.1149 |
| 8692 | HYAL2 | P16T-E | Human | Esophagus | ESCC | 5.89e-22 | 5.12e-01 | 0.1153 |
| 8692 | HYAL2 | P17T-E | Human | Esophagus | ESCC | 2.17e-08 | 5.89e-01 | 0.1278 |
| 8692 | HYAL2 | P19T-E | Human | Esophagus | ESCC | 6.30e-07 | 1.01e+00 | 0.1662 |
| 8692 | HYAL2 | P20T-E | Human | Esophagus | ESCC | 1.30e-04 | 2.86e-01 | 0.1124 |
| 8692 | HYAL2 | P21T-E | Human | Esophagus | ESCC | 1.25e-41 | 8.44e-01 | 0.1617 |
| 8692 | HYAL2 | P22T-E | Human | Esophagus | ESCC | 1.82e-16 | 3.52e-01 | 0.1236 |
| 8692 | HYAL2 | P23T-E | Human | Esophagus | ESCC | 7.28e-29 | 8.39e-01 | 0.108 |
| Page: 1 2 3 4 5 6 |
| Tissue | Expression Dynamics | Abbreviation |
| Esophagus | 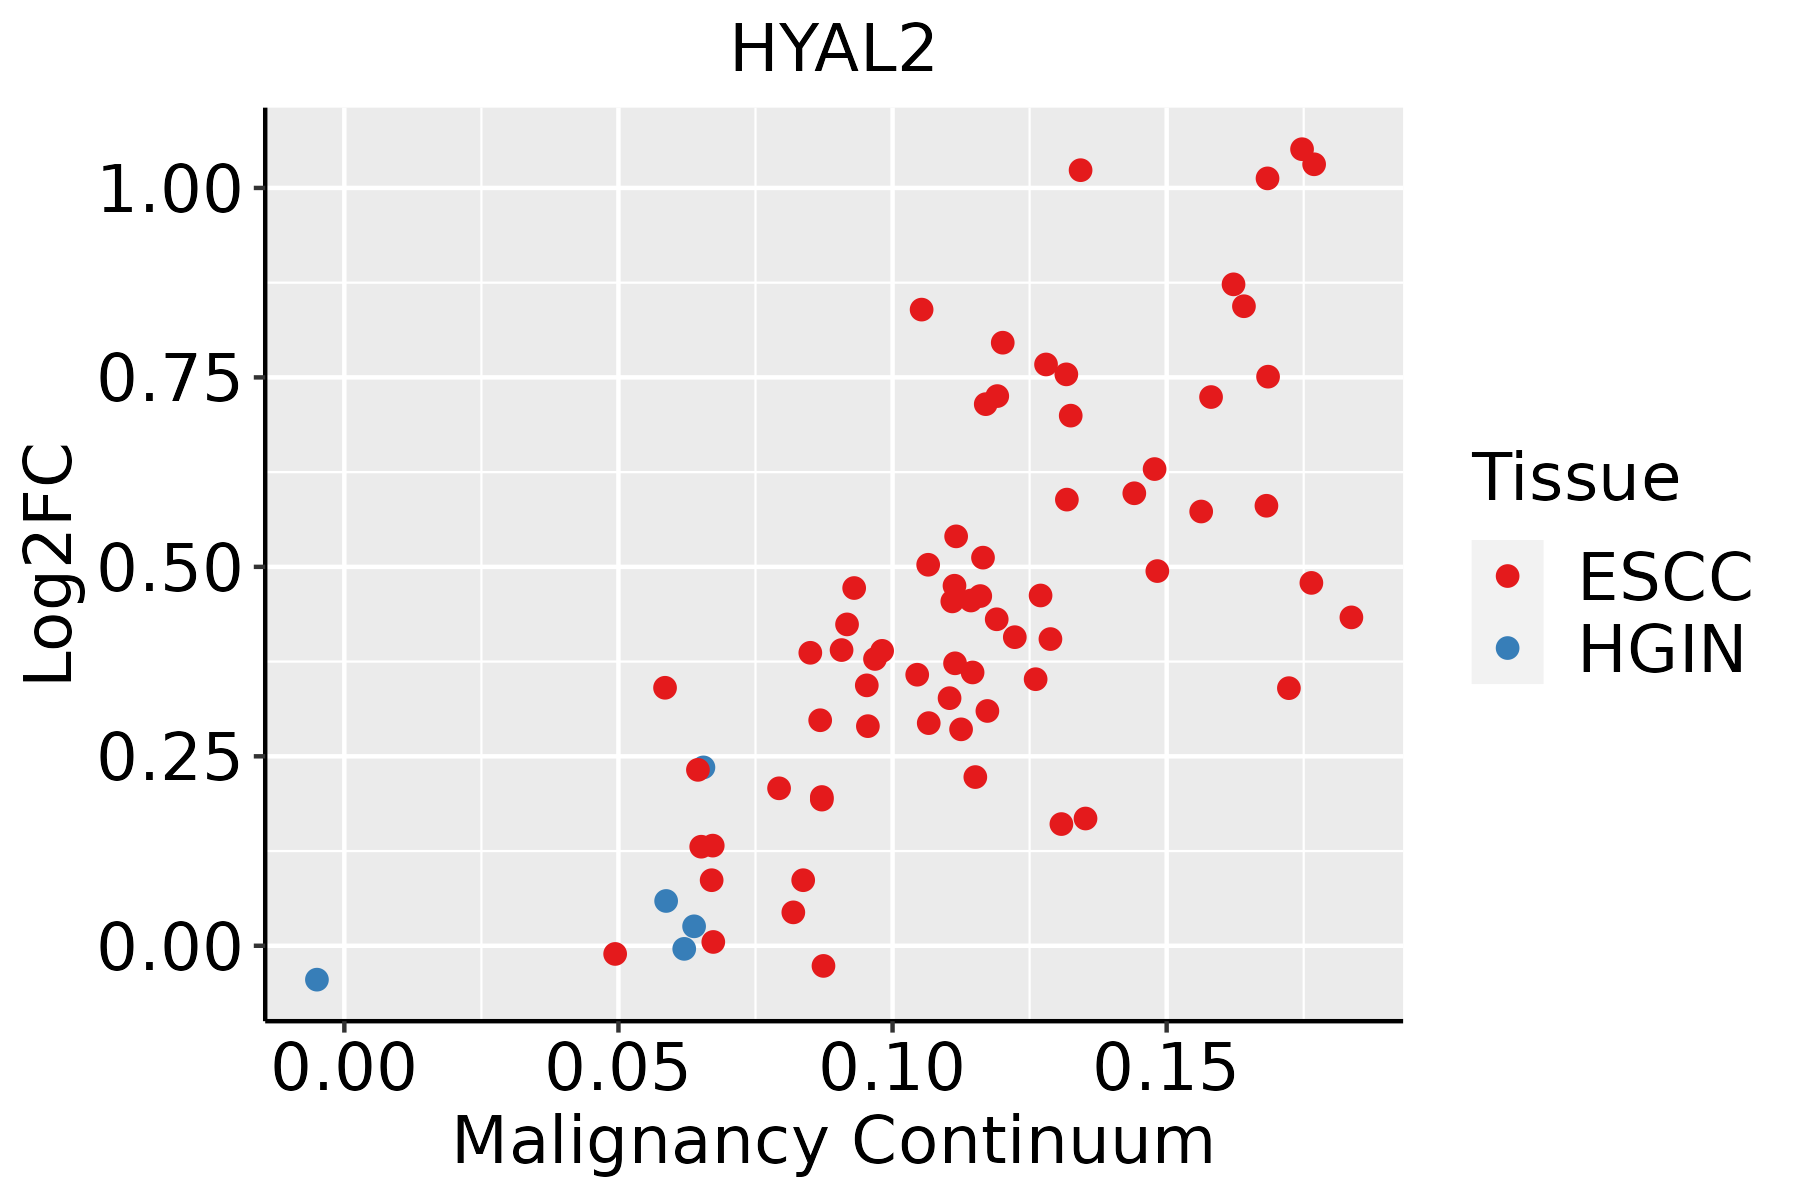 | ESCC: Esophageal squamous cell carcinoma |
| HGIN: High-grade intraepithelial neoplasias | ||
| LGIN: Low-grade intraepithelial neoplasias | ||
| Liver | 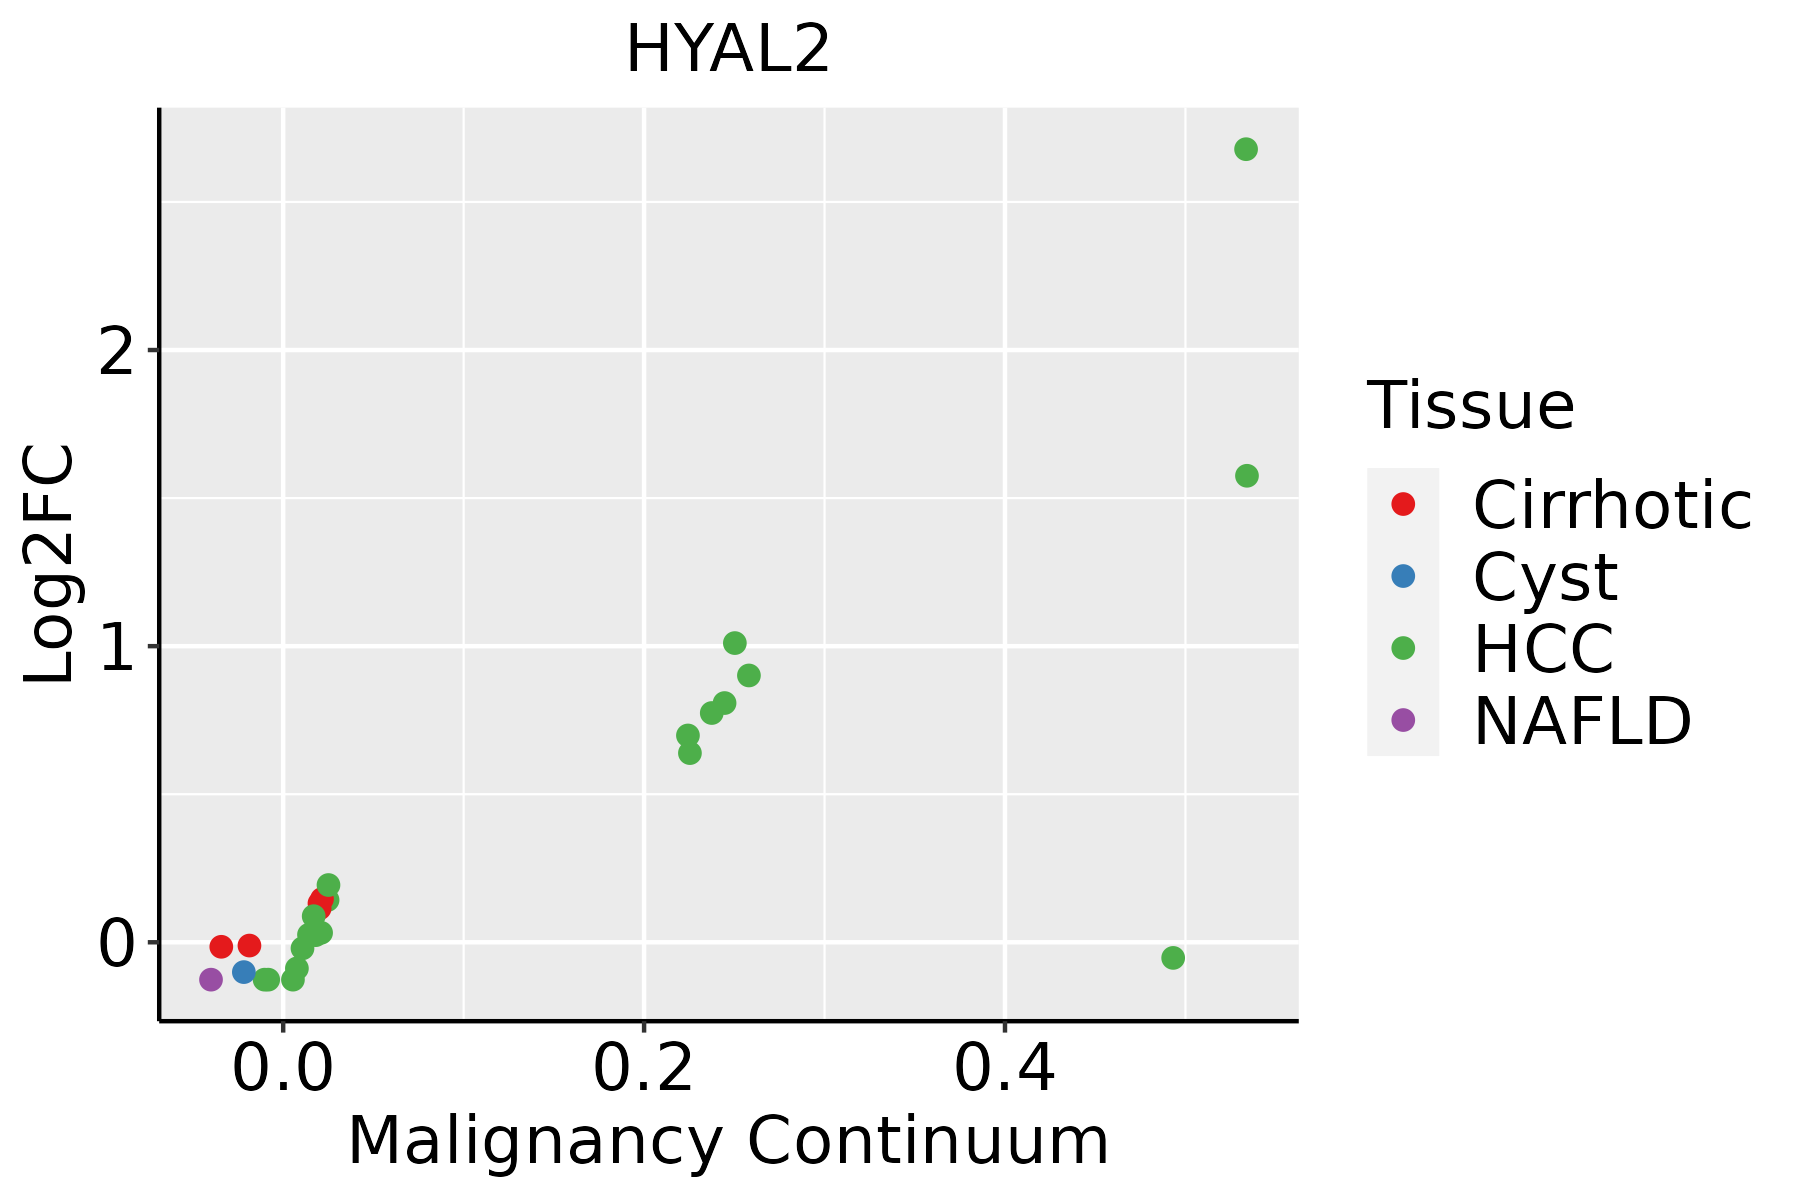 | HCC: Hepatocellular carcinoma |
| NAFLD: Non-alcoholic fatty liver disease | ||
| Oral Cavity |  | EOLP: Erosive Oral lichen planus |
| LP: leukoplakia | ||
| NEOLP: Non-erosive oral lichen planus | ||
| OSCC: Oral squamous cell carcinoma | ||
| Skin |  | AK: Actinic keratosis |
| cSCC: Cutaneous squamous cell carcinoma | ||
| SCCIS:squamous cell carcinoma in situ | ||
| Thyroid | 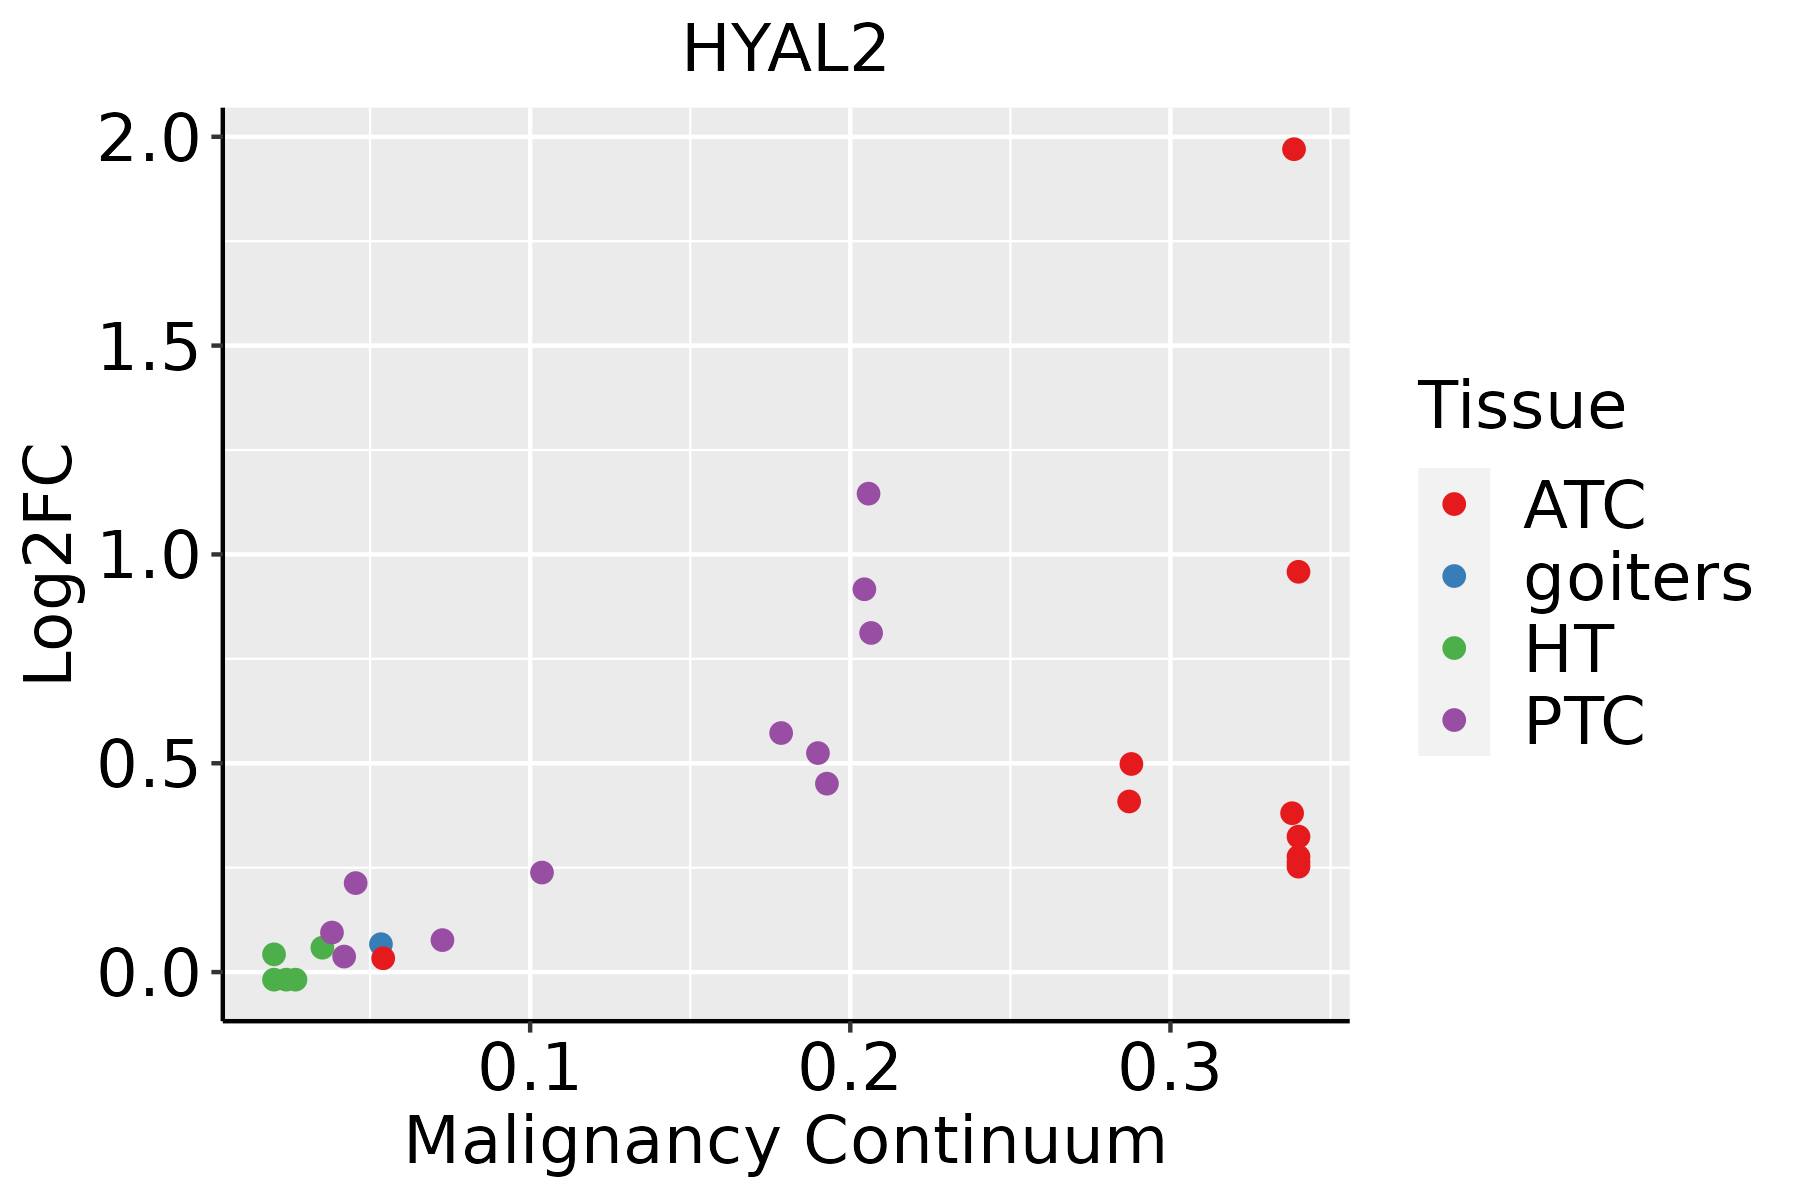 | ATC: Anaplastic thyroid cancer |
| HT: Hashimoto's thyroiditis | ||
| PTC: Papillary thyroid cancer |
| ∗log2FC in expression of this searched gene in stem-like cells from each diseased tissue sample relative to stem-like cells in normal samples in each tissue plotted against the malignancy continuum. Samples are colored based on if they are from different disease stage. |
Top |
Malignant transformation related pathway analysis |
| Find out the enriched GO biological processes and KEGG pathways involved in transition from healthy to precancer to cancer |
| Tissue | Disease Stage | Enriched GO biological Processes |
| Colorectum | AD |  |
| Colorectum | SER |  |
| Colorectum | MSS |  |
| Colorectum | MSI-H |  |
| Colorectum | FAP |  |
| ∗Top 15 enriched GO BP terms are showed in the bar plot of each disease state in each tissue. Each row represents a significant GO biological process which is colored according to the -log10(p.adjust). |
| Page: 1 2 3 4 5 6 7 8 9 |
| GO ID | Tissue | Disease Stage | Description | Gene Ratio | Bg Ratio | pvalue | p.adjust | Count |
| GO:00434097 | Liver | HCC | negative regulation of MAPK cascade | 98/7958 | 180/18723 | 7.88e-04 | 4.74e-03 | 98 |
| GO:00705551 | Liver | HCC | response to interleukin-1 | 80/7958 | 143/18723 | 7.95e-04 | 4.77e-03 | 80 |
| GO:005087822 | Liver | HCC | regulation of body fluid levels | 191/7958 | 379/18723 | 1.06e-03 | 6.11e-03 | 191 |
| GO:003461211 | Liver | HCC | response to tumor necrosis factor | 132/7958 | 253/18723 | 1.14e-03 | 6.48e-03 | 132 |
| GO:00459263 | Liver | HCC | negative regulation of growth | 129/7958 | 249/18723 | 1.81e-03 | 9.37e-03 | 129 |
| GO:0061025 | Liver | HCC | membrane fusion | 88/7958 | 163/18723 | 1.98e-03 | 1.00e-02 | 88 |
| GO:00016553 | Liver | HCC | urogenital system development | 170/7958 | 338/18723 | 2.15e-03 | 1.08e-02 | 170 |
| GO:0010762 | Liver | HCC | regulation of fibroblast migration | 24/7958 | 36/18723 | 2.95e-03 | 1.38e-02 | 24 |
| GO:00093146 | Liver | HCC | response to radiation | 223/7958 | 456/18723 | 3.08e-03 | 1.43e-02 | 223 |
| GO:00018222 | Liver | HCC | kidney development | 148/7958 | 293/18723 | 3.25e-03 | 1.49e-02 | 148 |
| GO:00720012 | Liver | HCC | renal system development | 152/7958 | 302/18723 | 3.45e-03 | 1.56e-02 | 152 |
| GO:0071901 | Liver | HCC | negative regulation of protein serine/threonine kinase activity | 66/7958 | 120/18723 | 3.81e-03 | 1.68e-02 | 66 |
| GO:0030308 | Liver | HCC | negative regulation of cell growth | 98/7958 | 188/18723 | 4.74e-03 | 2.02e-02 | 98 |
| GO:00713471 | Liver | HCC | cellular response to interleukin-1 | 61/7958 | 113/18723 | 8.98e-03 | 3.46e-02 | 61 |
| GO:001904811 | Liver | HCC | modulation by virus of host process | 9/7958 | 11/18723 | 9.51e-03 | 3.60e-02 | 9 |
| GO:007135611 | Liver | HCC | cellular response to tumor necrosis factor | 115/7958 | 229/18723 | 1.08e-02 | 3.99e-02 | 115 |
| GO:00610995 | Liver | HCC | negative regulation of protein tyrosine kinase activity | 20/7958 | 31/18723 | 1.11e-02 | 4.09e-02 | 20 |
| GO:005507211 | Liver | HCC | iron ion homeostasis | 47/7958 | 85/18723 | 1.17e-02 | 4.28e-02 | 47 |
| GO:000166721 | Liver | HCC | ameboidal-type cell migration | 226/7958 | 475/18723 | 1.35e-02 | 4.81e-02 | 226 |
| GO:0043407 | Liver | HCC | negative regulation of MAP kinase activity | 34/7958 | 59/18723 | 1.36e-02 | 4.84e-02 | 34 |
| Page: 1 2 3 4 5 6 7 8 9 10 11 12 13 14 15 16 17 18 19 20 21 22 23 24 25 26 27 28 29 30 31 32 33 34 |
| Pathway ID | Tissue | Disease Stage | Description | Gene Ratio | Bg Ratio | pvalue | p.adjust | qvalue | Count |
| hsa0414222 | Esophagus | ESCC | Lysosome | 102/4205 | 132/8465 | 5.11e-11 | 7.13e-10 | 3.65e-10 | 102 |
| hsa0414232 | Esophagus | ESCC | Lysosome | 102/4205 | 132/8465 | 5.11e-11 | 7.13e-10 | 3.65e-10 | 102 |
| hsa041424 | Liver | Cirrhotic | Lysosome | 68/2530 | 132/8465 | 1.34e-07 | 1.97e-06 | 1.21e-06 | 68 |
| hsa0414211 | Liver | Cirrhotic | Lysosome | 68/2530 | 132/8465 | 1.34e-07 | 1.97e-06 | 1.21e-06 | 68 |
| hsa041422 | Liver | HCC | Lysosome | 100/4020 | 132/8465 | 2.32e-11 | 4.31e-10 | 2.40e-10 | 100 |
| hsa041423 | Liver | HCC | Lysosome | 100/4020 | 132/8465 | 2.32e-11 | 4.31e-10 | 2.40e-10 | 100 |
| hsa041425 | Oral cavity | OSCC | Lysosome | 87/3704 | 132/8465 | 1.97e-07 | 1.35e-06 | 6.86e-07 | 87 |
| hsa0414212 | Oral cavity | OSCC | Lysosome | 87/3704 | 132/8465 | 1.97e-07 | 1.35e-06 | 6.86e-07 | 87 |
| hsa0414221 | Oral cavity | LP | Lysosome | 67/2418 | 132/8465 | 5.13e-08 | 7.77e-07 | 5.01e-07 | 67 |
| hsa0414231 | Oral cavity | LP | Lysosome | 67/2418 | 132/8465 | 5.13e-08 | 7.77e-07 | 5.01e-07 | 67 |
| Page: 1 |
Top |
Cell-cell communication analysis |
| Identification of potential cell-cell interactions between two cell types and their ligand-receptor pairs for different disease states |
| Ligand | Receptor | LRpair | Pathway | Tissue | Disease Stage |
| Page: 1 |
Top |
Single-cell gene regulatory network inference analysis |
| Find out the significant the regulons (TFs) and the target genes of each regulon across cell types for different disease states |
| TF | Cell Type | Tissue | Disease Stage | Target Gene | RSS | Regulon Activity |
| ∗The dot plots of a searched regulon are shown for all cell subpopulations in each disease state of each tissue based on the regulon specific score inferred using pySCENIC and by calculating the average expression. |
| Page: 1 |
Top |
Somatic mutation of malignant transformation related genes |
| Annotation of somatic variants for genes involved in malignant transformation |
| Hugo Symbol | Variant Class | Variant Classification | dbSNP RS | HGVSc | HGVSp | HGVSp Short | SWISSPROT | BIOTYPE | SIFT | PolyPhen | Tumor Sample Barcode | Tissue | Histology | Sex | Age | Stage | Therapy Types | Drugs | Outcome |
| HYAL2 | SNV | Missense_Mutation | c.851C>G | p.Ala284Gly | p.A284G | Q12891 | protein_coding | tolerated(1) | benign(0.007) | TCGA-A2-A0YJ-01 | Breast | breast invasive carcinoma | Female | <65 | III/IV | Chemotherapy | cytoxan | PD | |
| HYAL2 | SNV | Missense_Mutation | novel | c.406N>T | p.Asp136Tyr | p.D136Y | Q12891 | protein_coding | deleterious(0) | benign(0.285) | TCGA-AC-A5XS-01 | Breast | breast invasive carcinoma | Female | >=65 | I/II | Hormone Therapy | femara | SD |
| HYAL2 | SNV | Missense_Mutation | rs781930973 | c.593N>A | p.Arg198Gln | p.R198Q | Q12891 | protein_coding | deleterious(0) | probably_damaging(1) | TCGA-B6-A0RP-01 | Breast | breast invasive carcinoma | Female | >=65 | I/II | Unknown | Unknown | PD |
| HYAL2 | SNV | Missense_Mutation | c.464N>T | p.Ser155Leu | p.S155L | Q12891 | protein_coding | deleterious(0) | probably_damaging(1) | TCGA-PE-A5DE-01 | Breast | breast invasive carcinoma | Female | <65 | I/II | Chemotherapy | taxotere | CR | |
| HYAL2 | SNV | Missense_Mutation | c.730N>A | p.Glu244Lys | p.E244K | Q12891 | protein_coding | deleterious(0.02) | benign(0.171) | TCGA-EK-A3GK-01 | Cervix | cervical & endocervical cancer | Female | <65 | I/II | Unknown | Unknown | SD | |
| HYAL2 | SNV | Missense_Mutation | rs781990680 | c.973N>A | p.Val325Ile | p.V325I | Q12891 | protein_coding | tolerated(0.42) | possibly_damaging(0.447) | TCGA-A6-2682-01 | Colorectum | colon adenocarcinoma | Male | >=65 | III/IV | Chemotherapy | 5 | PD |
| HYAL2 | SNV | Missense_Mutation | c.1394N>T | p.Ala465Val | p.A465V | Q12891 | protein_coding | tolerated(0.76) | benign(0) | TCGA-AY-6197-01 | Colorectum | colon adenocarcinoma | Male | <65 | I/II | Unknown | Unknown | SD | |
| HYAL2 | SNV | Missense_Mutation | c.874G>A | p.Val292Ile | p.V292I | Q12891 | protein_coding | deleterious(0.02) | probably_damaging(0.987) | TCGA-NH-A6GC-01 | Colorectum | colon adenocarcinoma | Female | >=65 | I/II | Chemotherapy | fluorouracil | SD | |
| HYAL2 | SNV | Missense_Mutation | c.80N>T | p.Ala27Val | p.A27V | Q12891 | protein_coding | tolerated(0.28) | benign(0.015) | TCGA-QG-A5Z2-01 | Colorectum | colon adenocarcinoma | Male | <65 | I/II | Unknown | Unknown | SD | |
| HYAL2 | SNV | Missense_Mutation | novel | c.404N>C | p.Glu135Ala | p.E135A | Q12891 | protein_coding | deleterious(0) | probably_damaging(0.951) | TCGA-AF-2691-01 | Colorectum | rectum adenocarcinoma | Female | <65 | I/II | Unknown | Unknown | SD |
| Page: 1 2 3 4 5 |
Top |
Related drugs of malignant transformation related genes |
| Identification of chemicals and drugs interact with genes involved in malignant transfromation |
| (DGIdb 4.0) |
| Entrez ID | Symbol | Category | Interaction Types | Drug Claim Name | Drug Name | PMIDs |
| 8692 | HYAL2 | DRUGGABLE GENOME, CELL SURFACE | EPINEPHRINE | EPINEPHRINE | 212383 | |
| 8692 | HYAL2 | DRUGGABLE GENOME, CELL SURFACE | HORMONES | 7215332 | ||
| 8692 | HYAL2 | DRUGGABLE GENOME, CELL SURFACE | DEXAMETHASONE | DEXAMETHASONE | 212383 |
| Page: 1 |

Copyright 2023-Present -The University of Texas Health Science Center at Houston |