
|
|||||
|
 | |
| |
| |
| |
| |
| |
|
Gene: GHITM |
Gene summary for GHITM |
| Gene information | Species | Human | Gene symbol | GHITM | Gene ID | 27069 |
| Gene name | growth hormone inducible transmembrane protein | |
| Gene Alias | DERP2 | |
| Cytomap | 10q23.1 | |
| Gene Type | protein-coding | GO ID | GO:0001836 | UniProtAcc | Q9H3K2 |
Top |
Malignant transformation analysis |
| Identification of the aberrant gene expression in precancerous and cancerous lesions by comparing the gene expression of stem-like cells in diseased tissues with normal stem cells |
| Entrez ID | Symbol | Replicates | Species | Organ | Tissue | Adj P-value | Log2FC | Malignancy |
| 27069 | GHITM | HTA11_2487_2000001011 | Human | Colorectum | SER | 1.84e-04 | 5.13e-01 | -0.1808 |
| 27069 | GHITM | HTA11_1938_2000001011 | Human | Colorectum | AD | 2.50e-02 | 5.37e-01 | -0.0811 |
| 27069 | GHITM | HTA11_78_2000001011 | Human | Colorectum | AD | 9.68e-14 | 7.29e-01 | -0.1088 |
| 27069 | GHITM | HTA11_347_2000001011 | Human | Colorectum | AD | 9.15e-35 | 9.37e-01 | -0.1954 |
| 27069 | GHITM | HTA11_411_2000001011 | Human | Colorectum | SER | 1.85e-03 | 8.21e-01 | -0.2602 |
| 27069 | GHITM | HTA11_83_2000001011 | Human | Colorectum | SER | 2.56e-02 | 4.47e-01 | -0.1526 |
| 27069 | GHITM | HTA11_696_2000001011 | Human | Colorectum | AD | 1.41e-02 | 2.91e-01 | -0.1464 |
| 27069 | GHITM | HTA11_1391_2000001011 | Human | Colorectum | AD | 5.85e-06 | 5.19e-01 | -0.059 |
| 27069 | GHITM | HTA11_2992_2000001011 | Human | Colorectum | SER | 1.30e-04 | 7.77e-01 | -0.1706 |
| 27069 | GHITM | HTA11_5212_2000001011 | Human | Colorectum | AD | 2.34e-13 | 8.59e-01 | -0.2061 |
| 27069 | GHITM | HTA11_5216_2000001011 | Human | Colorectum | SER | 1.97e-02 | 6.38e-01 | -0.1462 |
| 27069 | GHITM | HTA11_7862_2000001011 | Human | Colorectum | AD | 2.81e-10 | 8.53e-01 | -0.0179 |
| 27069 | GHITM | HTA11_866_3004761011 | Human | Colorectum | AD | 4.30e-06 | 3.89e-01 | 0.096 |
| 27069 | GHITM | HTA11_7663_2000001011 | Human | Colorectum | SER | 5.35e-06 | 7.24e-01 | 0.0131 |
| 27069 | GHITM | HTA11_10623_2000001011 | Human | Colorectum | AD | 6.60e-04 | 4.28e-01 | -0.0177 |
| 27069 | GHITM | HTA11_6801_2000001011 | Human | Colorectum | SER | 2.38e-08 | 1.19e+00 | 0.0171 |
| 27069 | GHITM | HTA11_7469_2000001011 | Human | Colorectum | AD | 1.43e-05 | 9.49e-01 | -0.0124 |
| 27069 | GHITM | HTA11_99999970781_79442 | Human | Colorectum | MSS | 1.92e-23 | 9.68e-01 | 0.294 |
| 27069 | GHITM | HTA11_99999965062_69753 | Human | Colorectum | MSI-H | 4.38e-03 | 9.91e-01 | 0.3487 |
| 27069 | GHITM | HTA11_99999965104_69814 | Human | Colorectum | MSS | 9.30e-09 | 6.80e-01 | 0.281 |
| Page: 1 2 3 4 5 6 7 8 9 |
| Tissue | Expression Dynamics | Abbreviation |
| Colorectum (GSE201348) |  | FAP: Familial adenomatous polyposis |
| CRC: Colorectal cancer | ||
| Colorectum (HTA11) |  | AD: Adenomas |
| SER: Sessile serrated lesions | ||
| MSI-H: Microsatellite-high colorectal cancer | ||
| MSS: Microsatellite stable colorectal cancer | ||
| Endometrium |  | AEH: Atypical endometrial hyperplasia |
| EEC: Endometrioid Cancer | ||
| Esophagus |  | ESCC: Esophageal squamous cell carcinoma |
| HGIN: High-grade intraepithelial neoplasias | ||
| LGIN: Low-grade intraepithelial neoplasias | ||
| Liver | 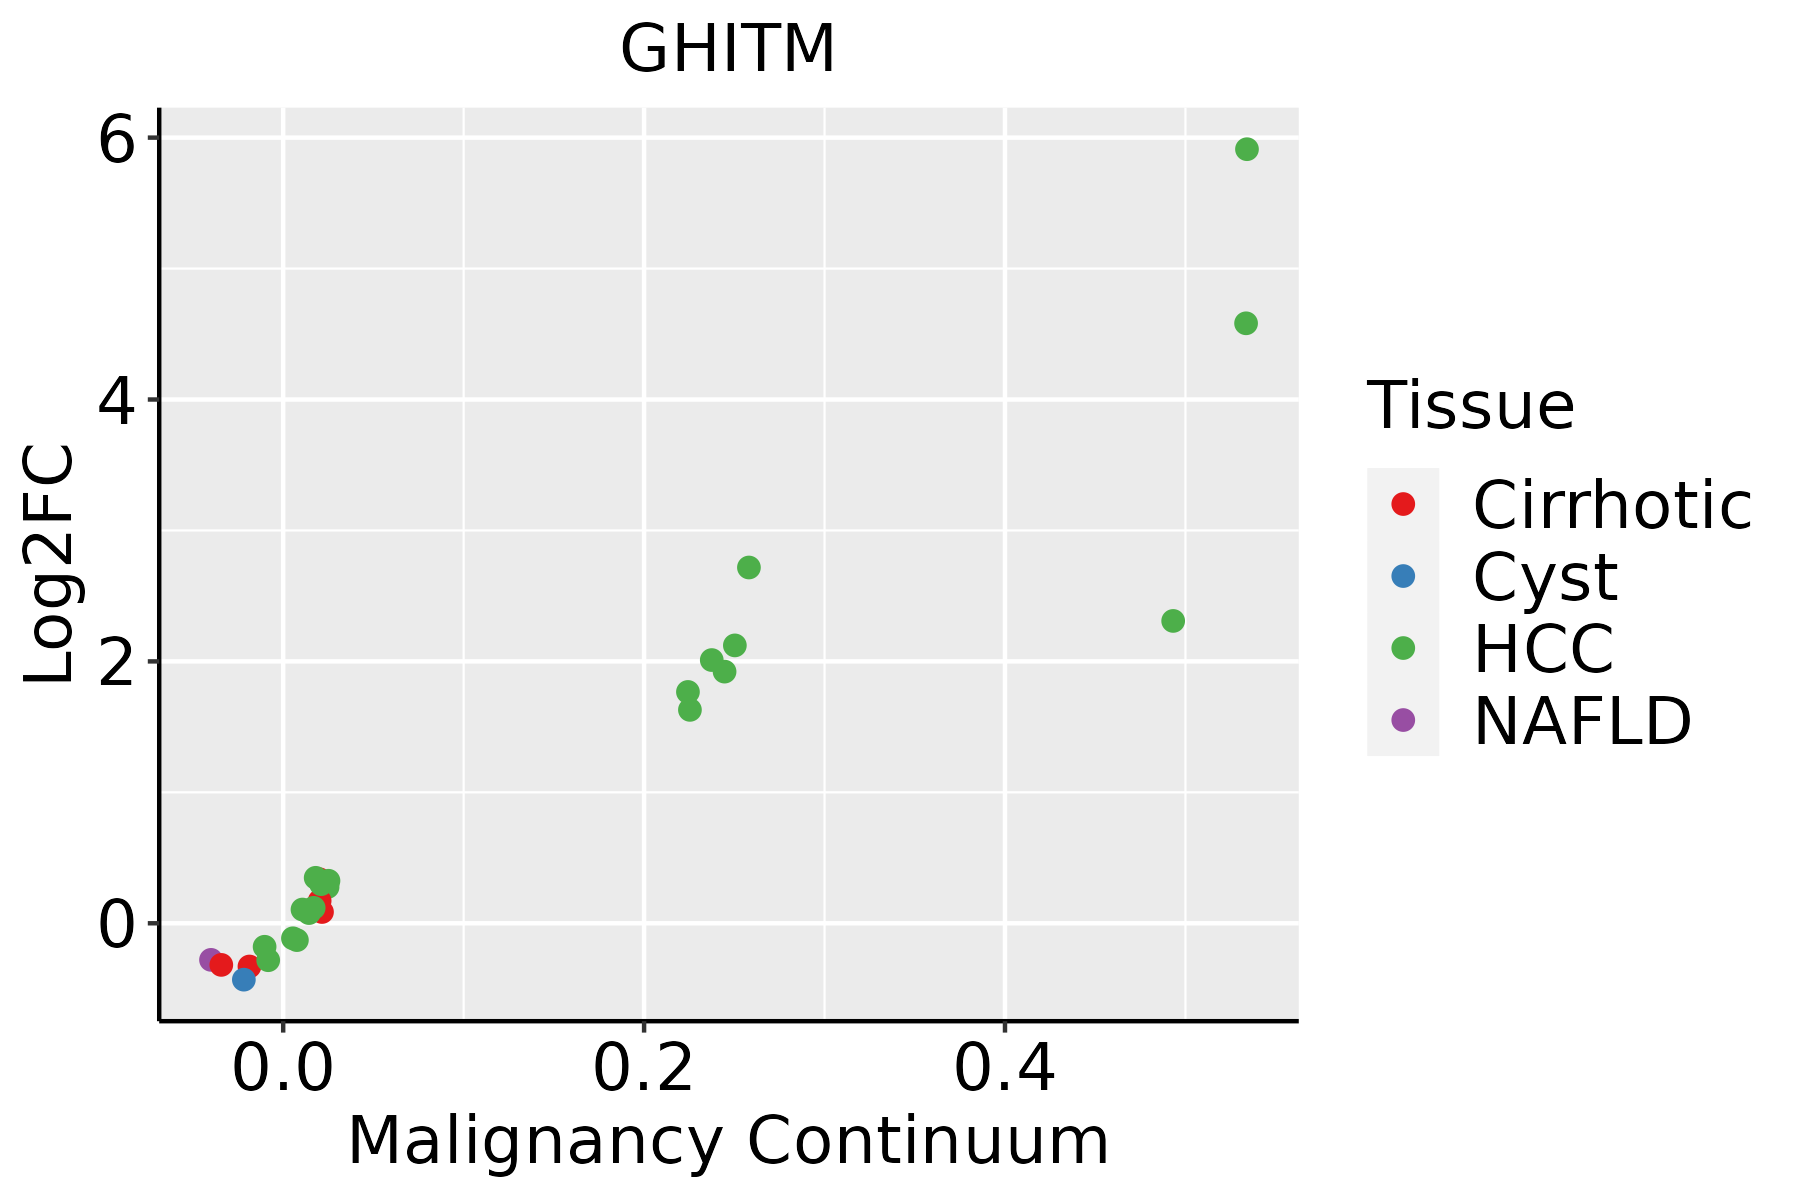 | HCC: Hepatocellular carcinoma |
| NAFLD: Non-alcoholic fatty liver disease | ||
| Oral Cavity | 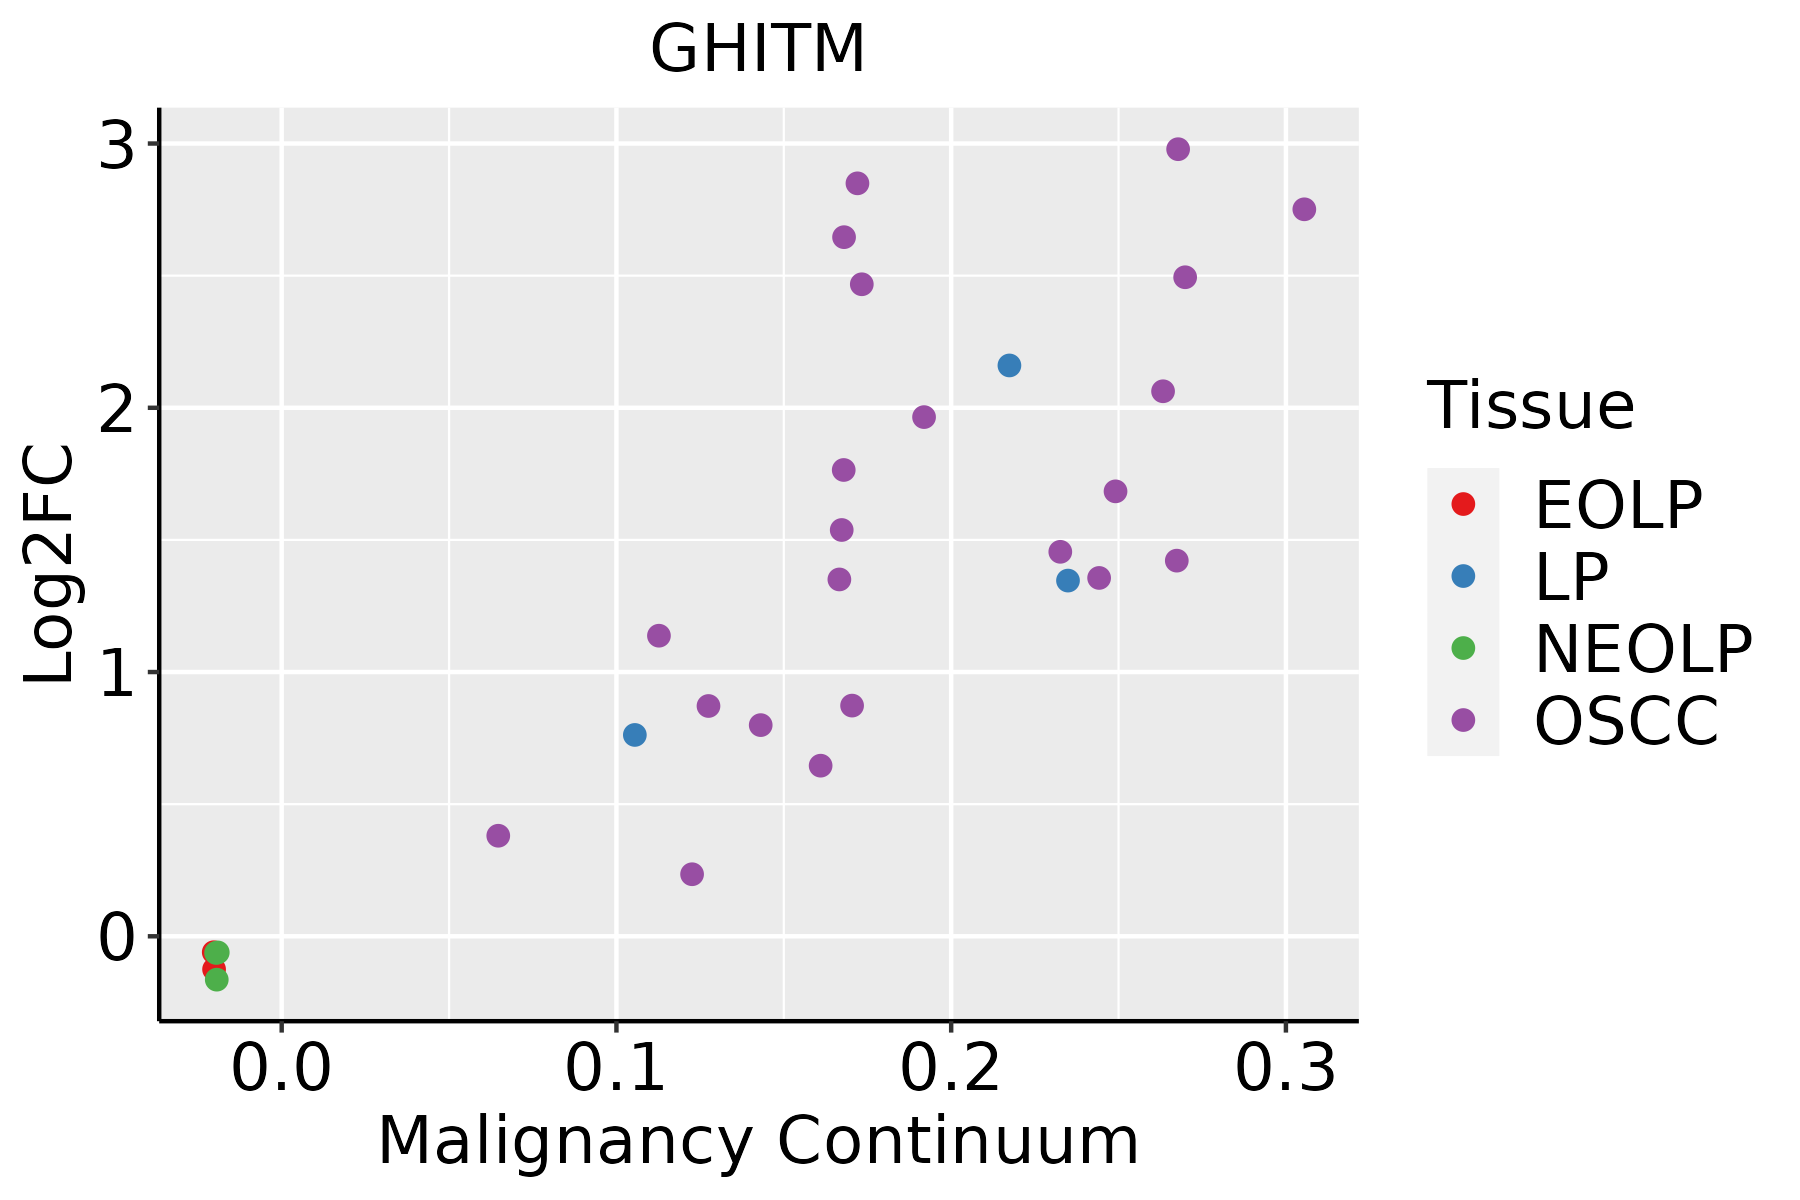 | EOLP: Erosive Oral lichen planus |
| LP: leukoplakia | ||
| NEOLP: Non-erosive oral lichen planus | ||
| OSCC: Oral squamous cell carcinoma | ||
| Prostate | 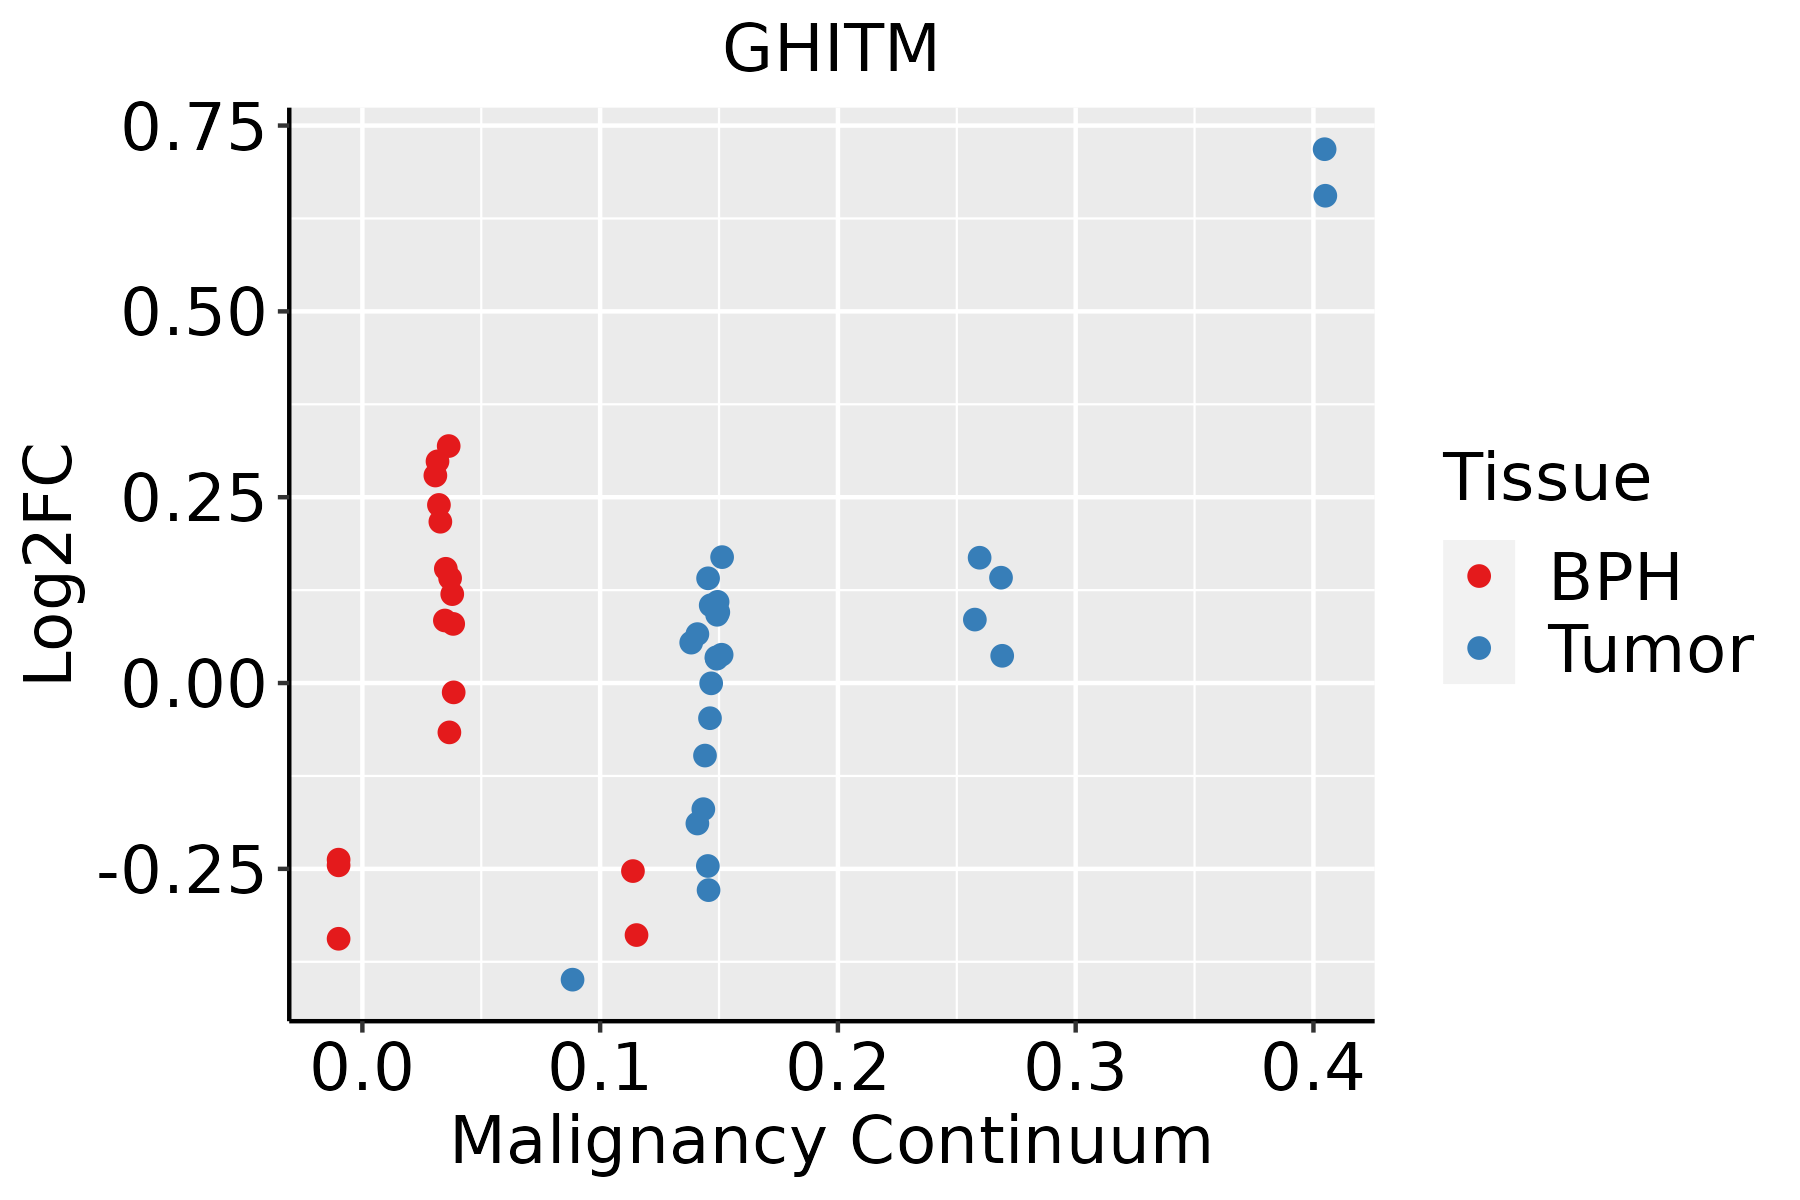 | BPH: Benign Prostatic Hyperplasia |
| Skin | 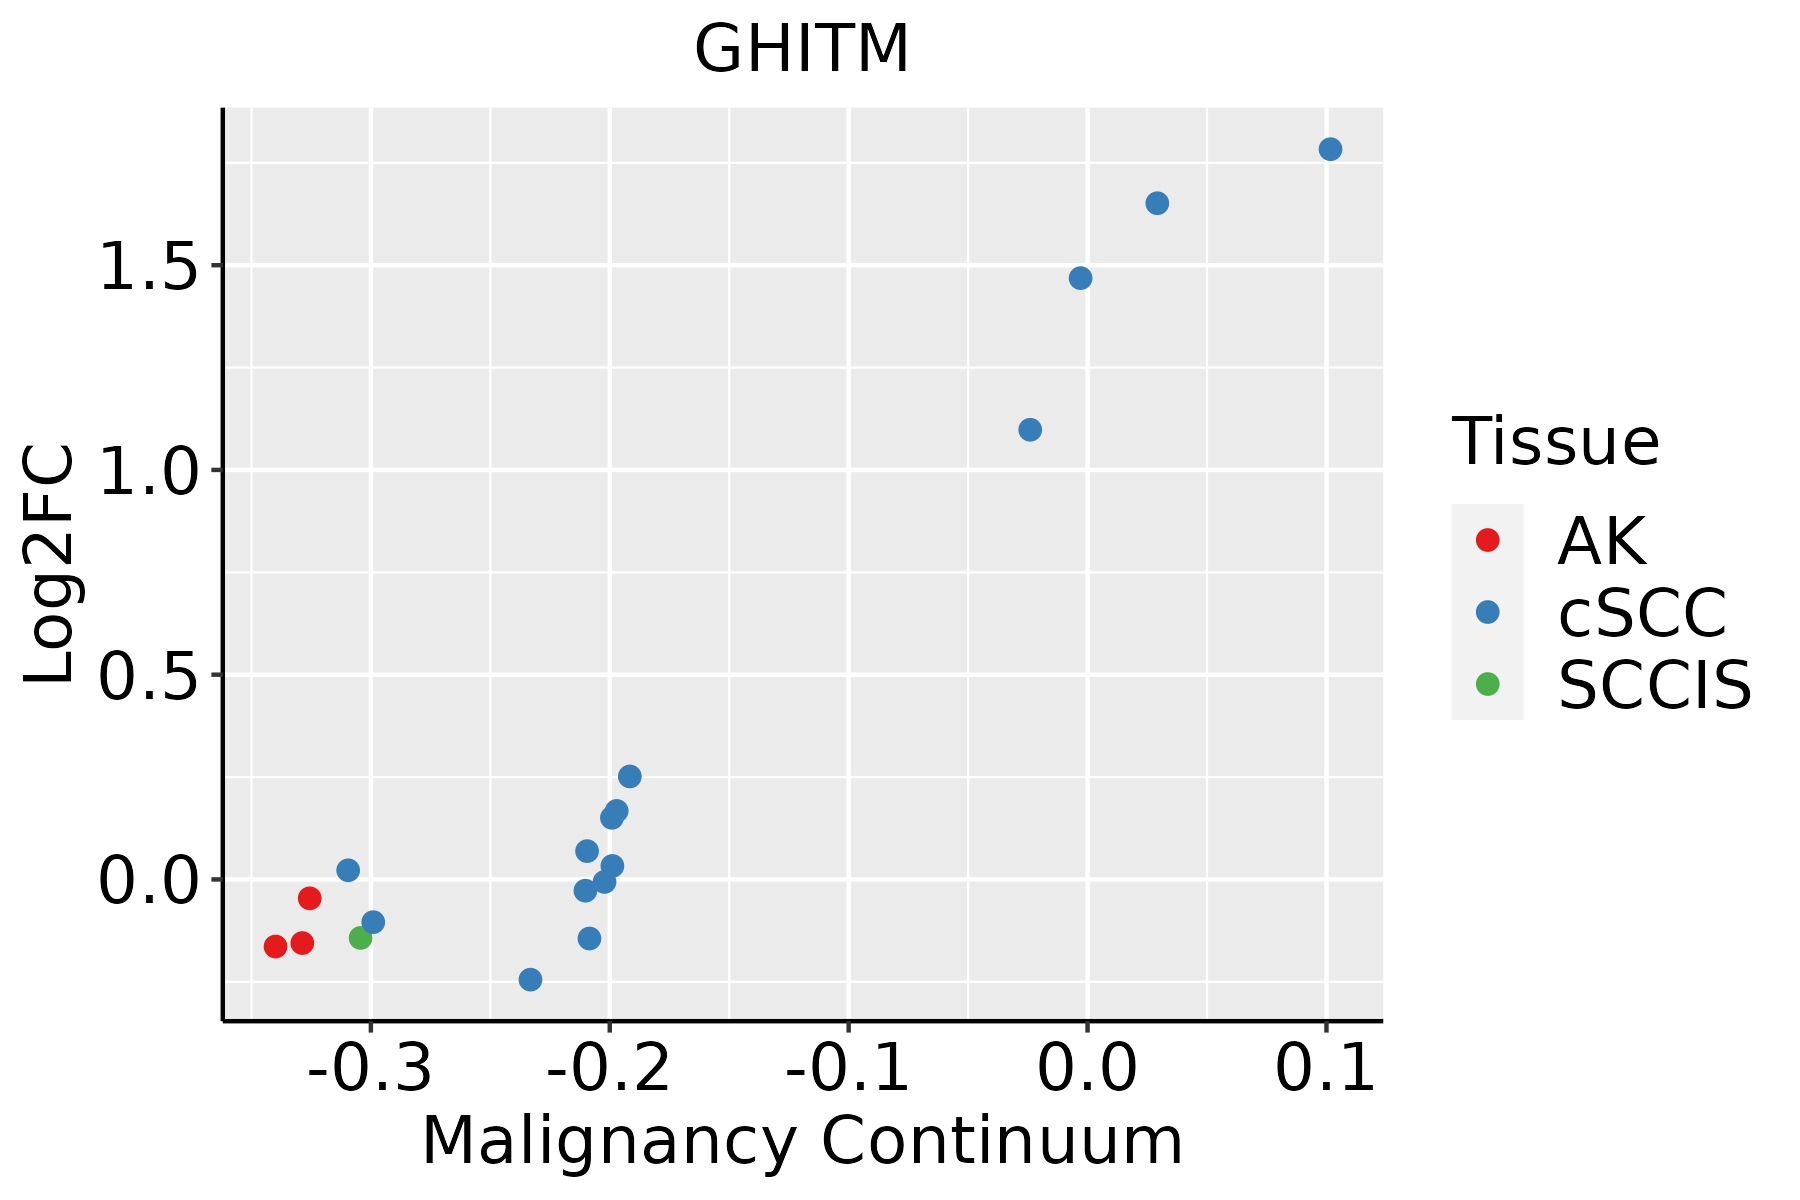 | AK: Actinic keratosis |
| cSCC: Cutaneous squamous cell carcinoma | ||
| SCCIS:squamous cell carcinoma in situ | ||
| Thyroid | 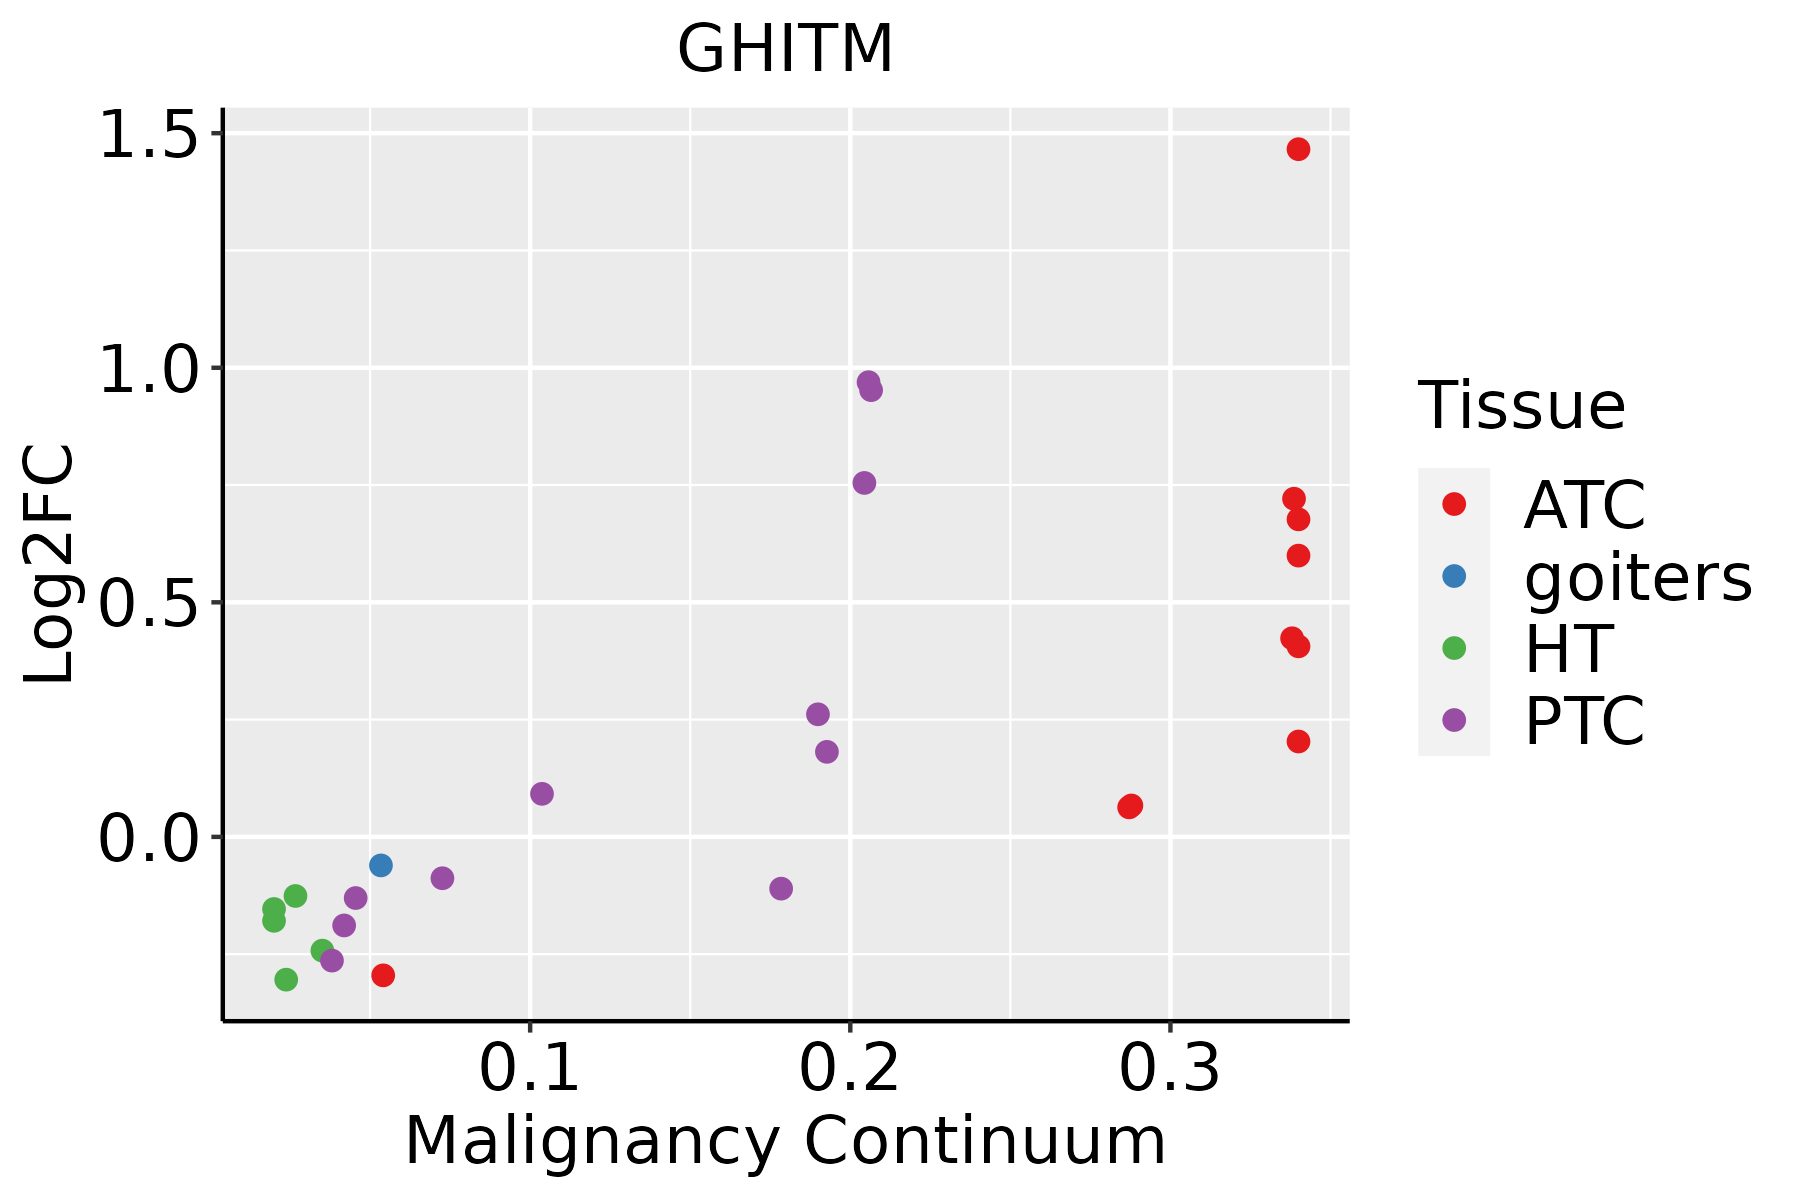 | ATC: Anaplastic thyroid cancer |
| HT: Hashimoto's thyroiditis | ||
| PTC: Papillary thyroid cancer |
| ∗log2FC in expression of this searched gene in stem-like cells from each diseased tissue sample relative to stem-like cells in normal samples in each tissue plotted against the malignancy continuum. Samples are colored based on if they are from different disease stage. |
Top |
Malignant transformation related pathway analysis |
| Find out the enriched GO biological processes and KEGG pathways involved in transition from healthy to precancer to cancer |
| Tissue | Disease Stage | Enriched GO biological Processes |
| Colorectum | AD |  |
| Colorectum | SER |  |
| Colorectum | MSS |  |
| Colorectum | MSI-H |  |
| Colorectum | FAP |  |
| ∗Top 15 enriched GO BP terms are showed in the bar plot of each disease state in each tissue. Each row represents a significant GO biological process which is colored according to the -log10(p.adjust). |
| Page: 1 2 3 4 5 6 7 8 9 |
| GO ID | Tissue | Disease Stage | Description | Gene Ratio | Bg Ratio | pvalue | p.adjust | Count |
| GO:000609118 | Oral cavity | OSCC | generation of precursor metabolites and energy | 286/7305 | 490/18723 | 1.45e-18 | 1.71e-16 | 286 |
| GO:000906018 | Oral cavity | OSCC | aerobic respiration | 133/7305 | 189/18723 | 1.79e-18 | 2.02e-16 | 133 |
| GO:004533318 | Oral cavity | OSCC | cellular respiration | 153/7305 | 230/18723 | 2.07e-17 | 1.87e-15 | 153 |
| GO:200123420 | Oral cavity | OSCC | negative regulation of apoptotic signaling pathway | 148/7305 | 224/18723 | 1.71e-16 | 1.36e-14 | 148 |
| GO:004277318 | Oral cavity | OSCC | ATP synthesis coupled electron transport | 75/7305 | 95/18723 | 1.95e-15 | 1.33e-13 | 75 |
| GO:004277518 | Oral cavity | OSCC | mitochondrial ATP synthesis coupled electron transport | 75/7305 | 95/18723 | 1.95e-15 | 1.33e-13 | 75 |
| GO:002290418 | Oral cavity | OSCC | respiratory electron transport chain | 86/7305 | 114/18723 | 2.43e-15 | 1.63e-13 | 86 |
| GO:001598018 | Oral cavity | OSCC | energy derivation by oxidation of organic compounds | 190/7305 | 318/18723 | 4.10e-14 | 2.26e-12 | 190 |
| GO:000700610 | Oral cavity | OSCC | mitochondrial membrane organization | 85/7305 | 116/18723 | 6.29e-14 | 3.40e-12 | 85 |
| GO:000863718 | Oral cavity | OSCC | apoptotic mitochondrial changes | 78/7305 | 107/18723 | 1.06e-12 | 4.78e-11 | 78 |
| GO:004603420 | Oral cavity | OSCC | ATP metabolic process | 166/7305 | 277/18723 | 1.16e-12 | 5.12e-11 | 166 |
| GO:000611919 | Oral cavity | OSCC | oxidative phosphorylation | 96/7305 | 141/18723 | 2.33e-12 | 9.75e-11 | 96 |
| GO:001082117 | Oral cavity | OSCC | regulation of mitochondrion organization | 97/7305 | 144/18723 | 4.78e-12 | 1.83e-10 | 97 |
| GO:000183616 | Oral cavity | OSCC | release of cytochrome c from mitochondria | 46/7305 | 59/18723 | 1.17e-09 | 2.87e-08 | 46 |
| GO:001063918 | Oral cavity | OSCC | negative regulation of organelle organization | 190/7305 | 348/18723 | 2.12e-09 | 4.97e-08 | 190 |
| GO:00901997 | Oral cavity | OSCC | regulation of release of cytochrome c from mitochondria | 37/7305 | 48/18723 | 8.67e-08 | 1.52e-06 | 37 |
| GO:00108239 | Oral cavity | OSCC | negative regulation of mitochondrion organization | 34/7305 | 49/18723 | 1.59e-05 | 1.59e-04 | 34 |
| GO:00070075 | Oral cavity | OSCC | inner mitochondrial membrane organization | 27/7305 | 38/18723 | 6.23e-05 | 5.08e-04 | 27 |
| GO:004346716 | Oral cavity | OSCC | regulation of generation of precursor metabolites and energy | 71/7305 | 130/18723 | 2.15e-04 | 1.41e-03 | 71 |
| GO:00902016 | Oral cavity | OSCC | negative regulation of release of cytochrome c from mitochondria | 16/7305 | 20/18723 | 2.24e-04 | 1.46e-03 | 16 |
| Page: 1 2 3 4 5 6 7 8 9 10 11 12 13 14 15 16 17 18 |
| Pathway ID | Tissue | Disease Stage | Description | Gene Ratio | Bg Ratio | pvalue | p.adjust | qvalue | Count |
| Page: 1 |
Top |
Cell-cell communication analysis |
| Identification of potential cell-cell interactions between two cell types and their ligand-receptor pairs for different disease states |
| Ligand | Receptor | LRpair | Pathway | Tissue | Disease Stage |
| Page: 1 |
Top |
Single-cell gene regulatory network inference analysis |
| Find out the significant the regulons (TFs) and the target genes of each regulon across cell types for different disease states |
| TF | Cell Type | Tissue | Disease Stage | Target Gene | RSS | Regulon Activity |
| ∗The dot plots of a searched regulon are shown for all cell subpopulations in each disease state of each tissue based on the regulon specific score inferred using pySCENIC and by calculating the average expression. |
| Page: 1 |
Top |
Somatic mutation of malignant transformation related genes |
| Annotation of somatic variants for genes involved in malignant transformation |
| Hugo Symbol | Variant Class | Variant Classification | dbSNP RS | HGVSc | HGVSp | HGVSp Short | SWISSPROT | BIOTYPE | SIFT | PolyPhen | Tumor Sample Barcode | Tissue | Histology | Sex | Age | Stage | Therapy Types | Drugs | Outcome |
| GHITM | SNV | Missense_Mutation | c.440N>A | p.Arg147Lys | p.R147K | Q9H3K2 | protein_coding | deleterious(0.04) | probably_damaging(0.932) | TCGA-B6-A0WZ-01 | Breast | breast invasive carcinoma | Female | <65 | I/II | Unknown | Unknown | PD | |
| GHITM | SNV | Missense_Mutation | c.212N>C | p.Met71Thr | p.M71T | Q9H3K2 | protein_coding | tolerated(1) | benign(0.001) | TCGA-BH-A0DL-01 | Breast | breast invasive carcinoma | Female | <65 | I/II | Chemotherapy | cytoxan | CR | |
| GHITM | SNV | Missense_Mutation | rs758527392 | c.164N>A | p.Arg55His | p.R55H | Q9H3K2 | protein_coding | tolerated(0.08) | possibly_damaging(0.861) | TCGA-JL-A3YW-01 | Breast | breast invasive carcinoma | Female | <65 | I/II | Unknown | Unknown | SD |
| GHITM | deletion | Frame_Shift_Del | novel | c.635delG | p.Gly212ValfsTer31 | p.G212Vfs*31 | Q9H3K2 | protein_coding | TCGA-EW-A2FV-01 | Breast | breast invasive carcinoma | Female | <65 | III/IV | Chemotherapy | docetaxel | SD | ||
| GHITM | SNV | Missense_Mutation | rs572795538 | c.902G>A | p.Arg301His | p.R301H | Q9H3K2 | protein_coding | tolerated(0.17) | benign(0.019) | TCGA-A6-2684-01 | Colorectum | colon adenocarcinoma | Female | >=65 | I/II | Unknown | Unknown | PD |
| GHITM | SNV | Missense_Mutation | rs111408234 | c.1008G>A | p.Met336Ile | p.M336I | Q9H3K2 | protein_coding | tolerated(1) | benign(0) | TCGA-AA-A01S-01 | Colorectum | colon adenocarcinoma | Female | <65 | III/IV | Unknown | Unknown | SD |
| GHITM | SNV | Missense_Mutation | novel | c.850N>G | p.Leu284Val | p.L284V | Q9H3K2 | protein_coding | deleterious(0.01) | possibly_damaging(0.789) | TCGA-CA-6717-01 | Colorectum | colon adenocarcinoma | Male | <65 | I/II | Chemotherapy | oxaliplatin | CR |
| GHITM | SNV | Missense_Mutation | c.596N>C | p.Val199Ala | p.V199A | Q9H3K2 | protein_coding | tolerated(0.09) | benign(0.326) | TCGA-CK-4951-01 | Colorectum | colon adenocarcinoma | Female | >=65 | I/II | Unknown | Unknown | PD | |
| GHITM | SNV | Missense_Mutation | c.707N>T | p.Ala236Val | p.A236V | Q9H3K2 | protein_coding | deleterious(0.02) | possibly_damaging(0.784) | TCGA-A5-A0GP-01 | Endometrium | uterine corpus endometrioid carcinoma | Female | <65 | I/II | Unknown | Unknown | SD | |
| GHITM | SNV | Missense_Mutation | novel | c.856C>A | p.Leu286Ile | p.L286I | Q9H3K2 | protein_coding | deleterious(0) | possibly_damaging(0.732) | TCGA-AJ-A5DW-01 | Endometrium | uterine corpus endometrioid carcinoma | Female | <65 | I/II | Unknown | Unknown | SD |
| Page: 1 2 3 4 |
Top |
Related drugs of malignant transformation related genes |
| Identification of chemicals and drugs interact with genes involved in malignant transfromation |
| (DGIdb 4.0) |
| Entrez ID | Symbol | Category | Interaction Types | Drug Claim Name | Drug Name | PMIDs |
| Page: 1 |

Copyright 2023-Present -The University of Texas Health Science Center at Houston |