
|
|||||
|
 | |
| |
| |
| |
| |
| |
|
Gene: EVL |
Gene summary for EVL |
| Gene information | Species | Human | Gene symbol | EVL | Gene ID | 51466 |
| Gene name | Enah/Vasp-like | |
| Gene Alias | RNB6 | |
| Cytomap | 14q32.2 | |
| Gene Type | protein-coding | GO ID | GO:0001667 | UniProtAcc | A0A024R6K5 |
Top |
Malignant transformation analysis |
| Identification of the aberrant gene expression in precancerous and cancerous lesions by comparing the gene expression of stem-like cells in diseased tissues with normal stem cells |
| Entrez ID | Symbol | Replicates | Species | Organ | Tissue | Adj P-value | Log2FC | Malignancy |
| 51466 | EVL | GSM4909293 | Human | Breast | IDC | 2.67e-07 | 2.40e-01 | 0.1581 |
| 51466 | EVL | GSM4909296 | Human | Breast | IDC | 2.10e-02 | 2.13e-01 | 0.1524 |
| 51466 | EVL | GSM4909297 | Human | Breast | IDC | 8.52e-16 | 5.53e-01 | 0.1517 |
| 51466 | EVL | GSM4909301 | Human | Breast | IDC | 1.36e-09 | 4.02e-01 | 0.1577 |
| 51466 | EVL | GSM4909302 | Human | Breast | IDC | 2.60e-49 | 1.03e+00 | 0.1545 |
| 51466 | EVL | GSM4909303 | Human | Breast | IDC | 7.33e-07 | 5.84e-01 | 0.0438 |
| 51466 | EVL | GSM4909304 | Human | Breast | IDC | 1.40e-05 | 2.75e-01 | 0.1636 |
| 51466 | EVL | GSM4909305 | Human | Breast | IDC | 5.52e-09 | 4.66e-01 | 0.0436 |
| 51466 | EVL | GSM4909306 | Human | Breast | IDC | 3.04e-30 | 7.26e-01 | 0.1564 |
| 51466 | EVL | GSM4909307 | Human | Breast | IDC | 3.22e-27 | 7.02e-01 | 0.1569 |
| 51466 | EVL | GSM4909308 | Human | Breast | IDC | 2.91e-64 | 9.90e-01 | 0.158 |
| 51466 | EVL | GSM4909311 | Human | Breast | IDC | 2.94e-20 | 3.87e-01 | 0.1534 |
| 51466 | EVL | GSM4909312 | Human | Breast | IDC | 5.78e-12 | 4.68e-01 | 0.1552 |
| 51466 | EVL | GSM4909313 | Human | Breast | IDC | 2.81e-09 | 4.70e-01 | 0.0391 |
| 51466 | EVL | GSM4909317 | Human | Breast | IDC | 4.98e-19 | 5.45e-01 | 0.1355 |
| 51466 | EVL | GSM4909319 | Human | Breast | IDC | 7.22e-11 | -1.35e-01 | 0.1563 |
| 51466 | EVL | GSM4909321 | Human | Breast | IDC | 9.44e-30 | 7.76e-01 | 0.1559 |
| 51466 | EVL | M1 | Human | Breast | IDC | 2.97e-32 | 8.20e-01 | 0.1577 |
| 51466 | EVL | M5 | Human | Breast | IDC | 2.79e-12 | 9.47e-01 | 0.1598 |
| 51466 | EVL | NCCBC2 | Human | Breast | DCIS | 1.75e-12 | 8.57e-01 | 0.1554 |
| Page: 1 2 3 4 5 |
| Tissue | Expression Dynamics | Abbreviation |
| Breast | 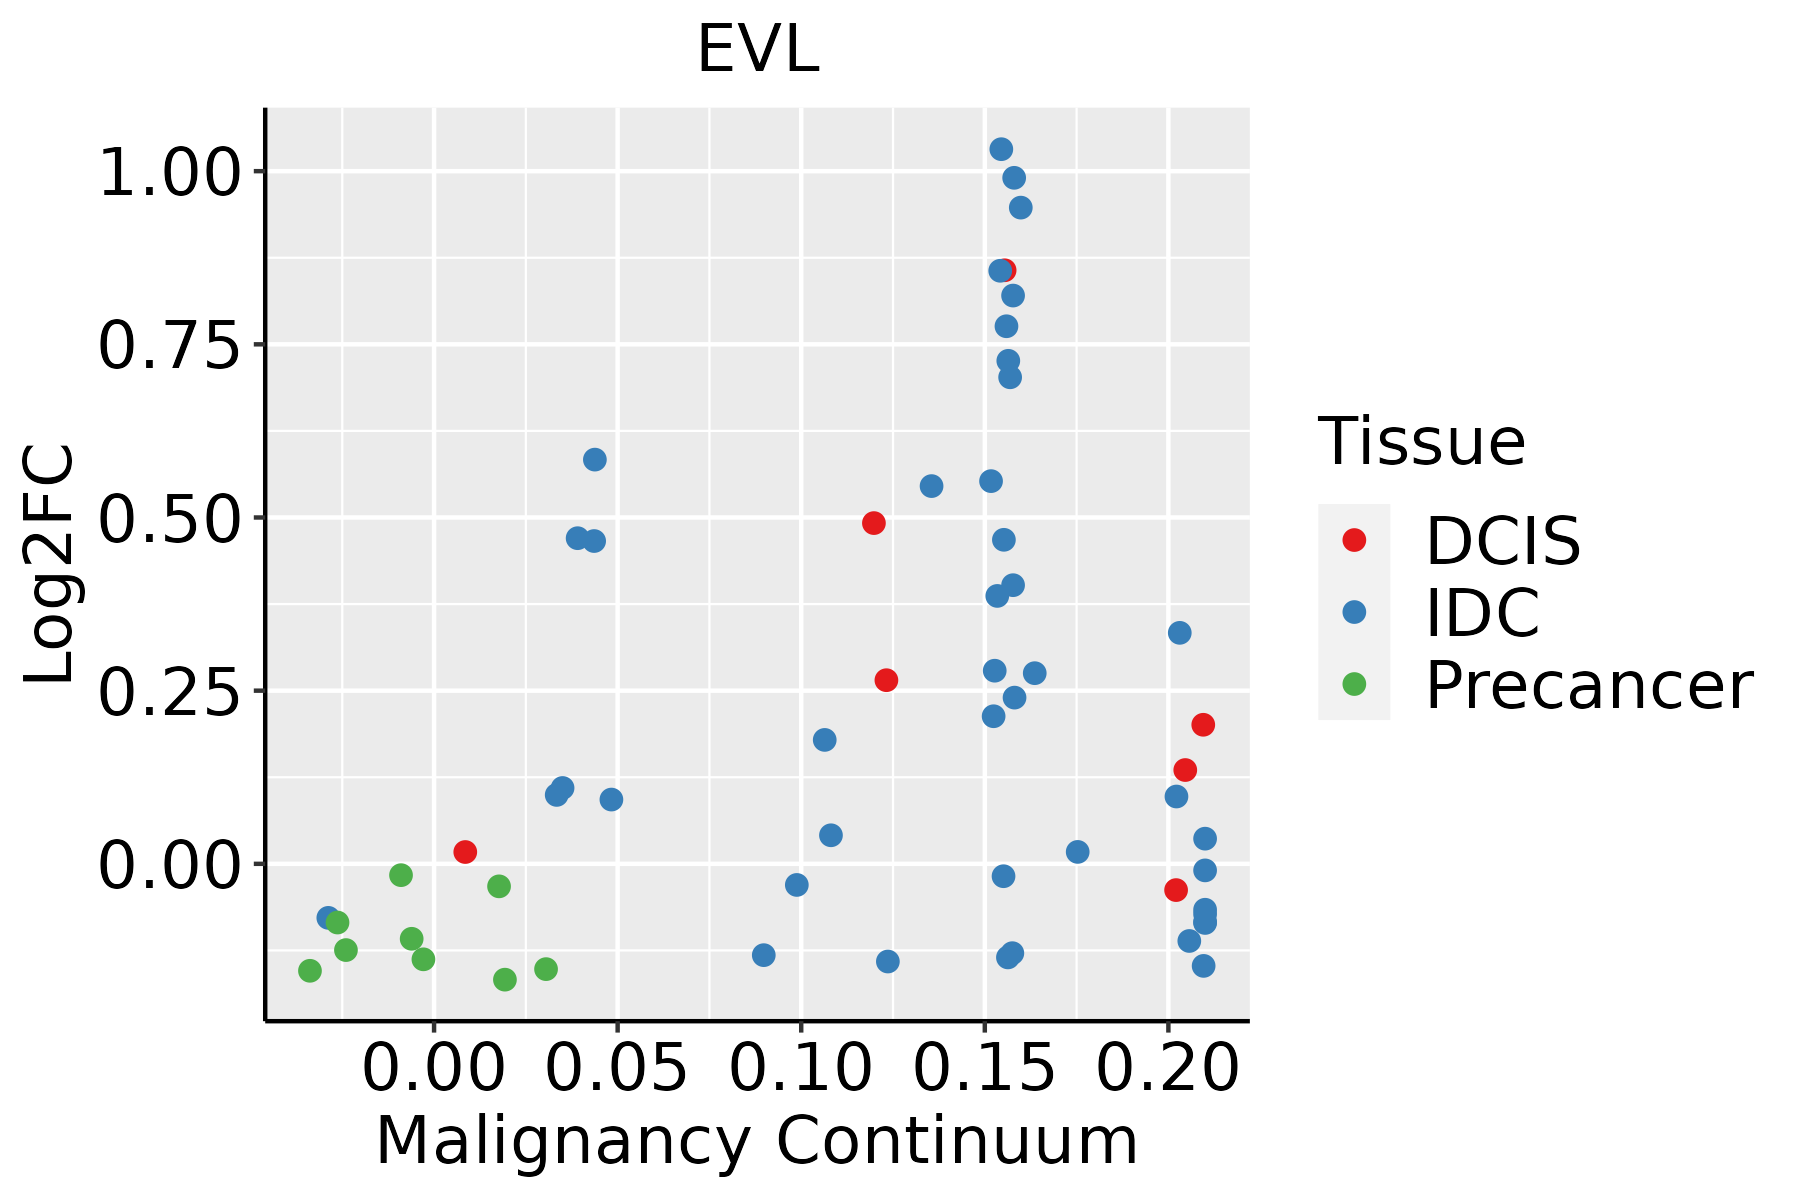 | IDC: Invasive ductal carcinoma |
| DCIS: Ductal carcinoma in situ | ||
| Precancer(BRCA1-mut): Precancerous lesion from BRCA1 mutation carriers | ||
| Esophagus | 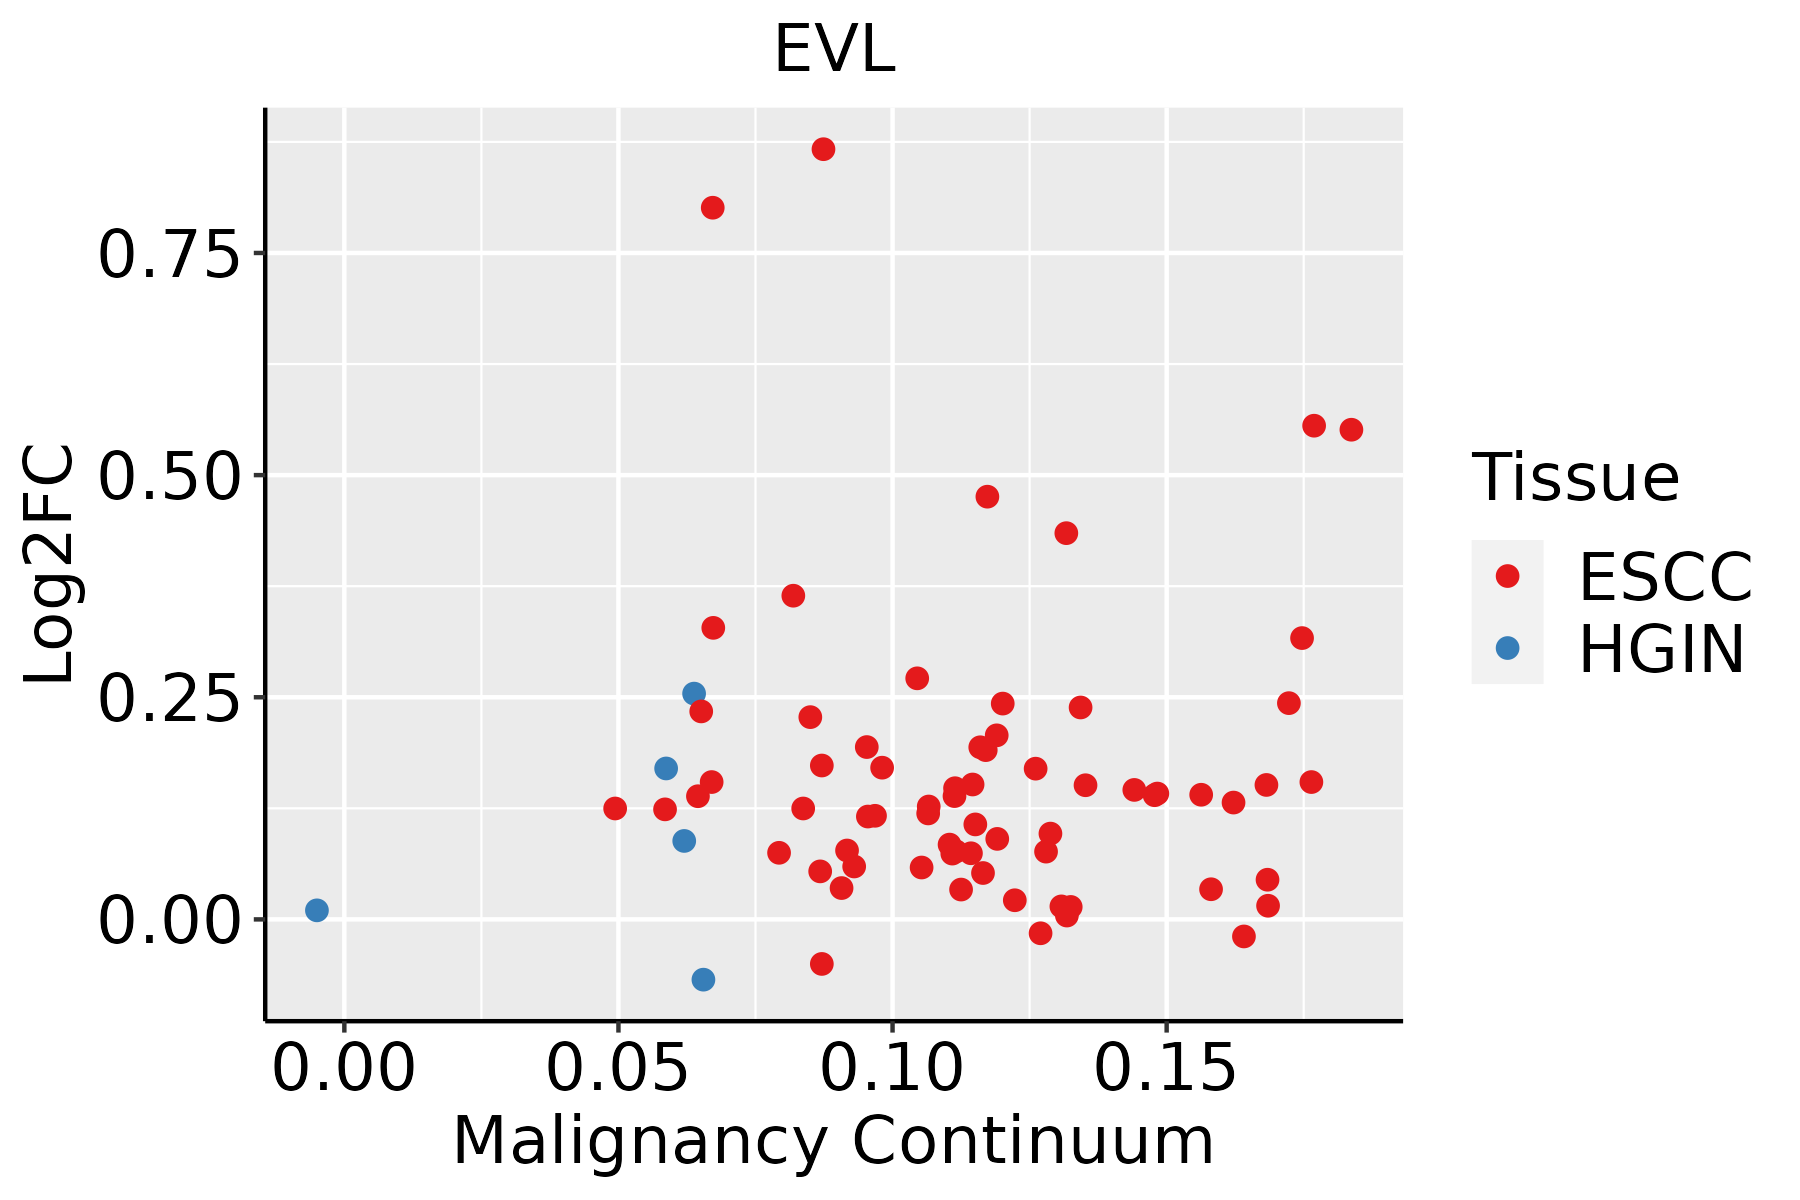 | ESCC: Esophageal squamous cell carcinoma |
| HGIN: High-grade intraepithelial neoplasias | ||
| LGIN: Low-grade intraepithelial neoplasias | ||
| Oral Cavity | 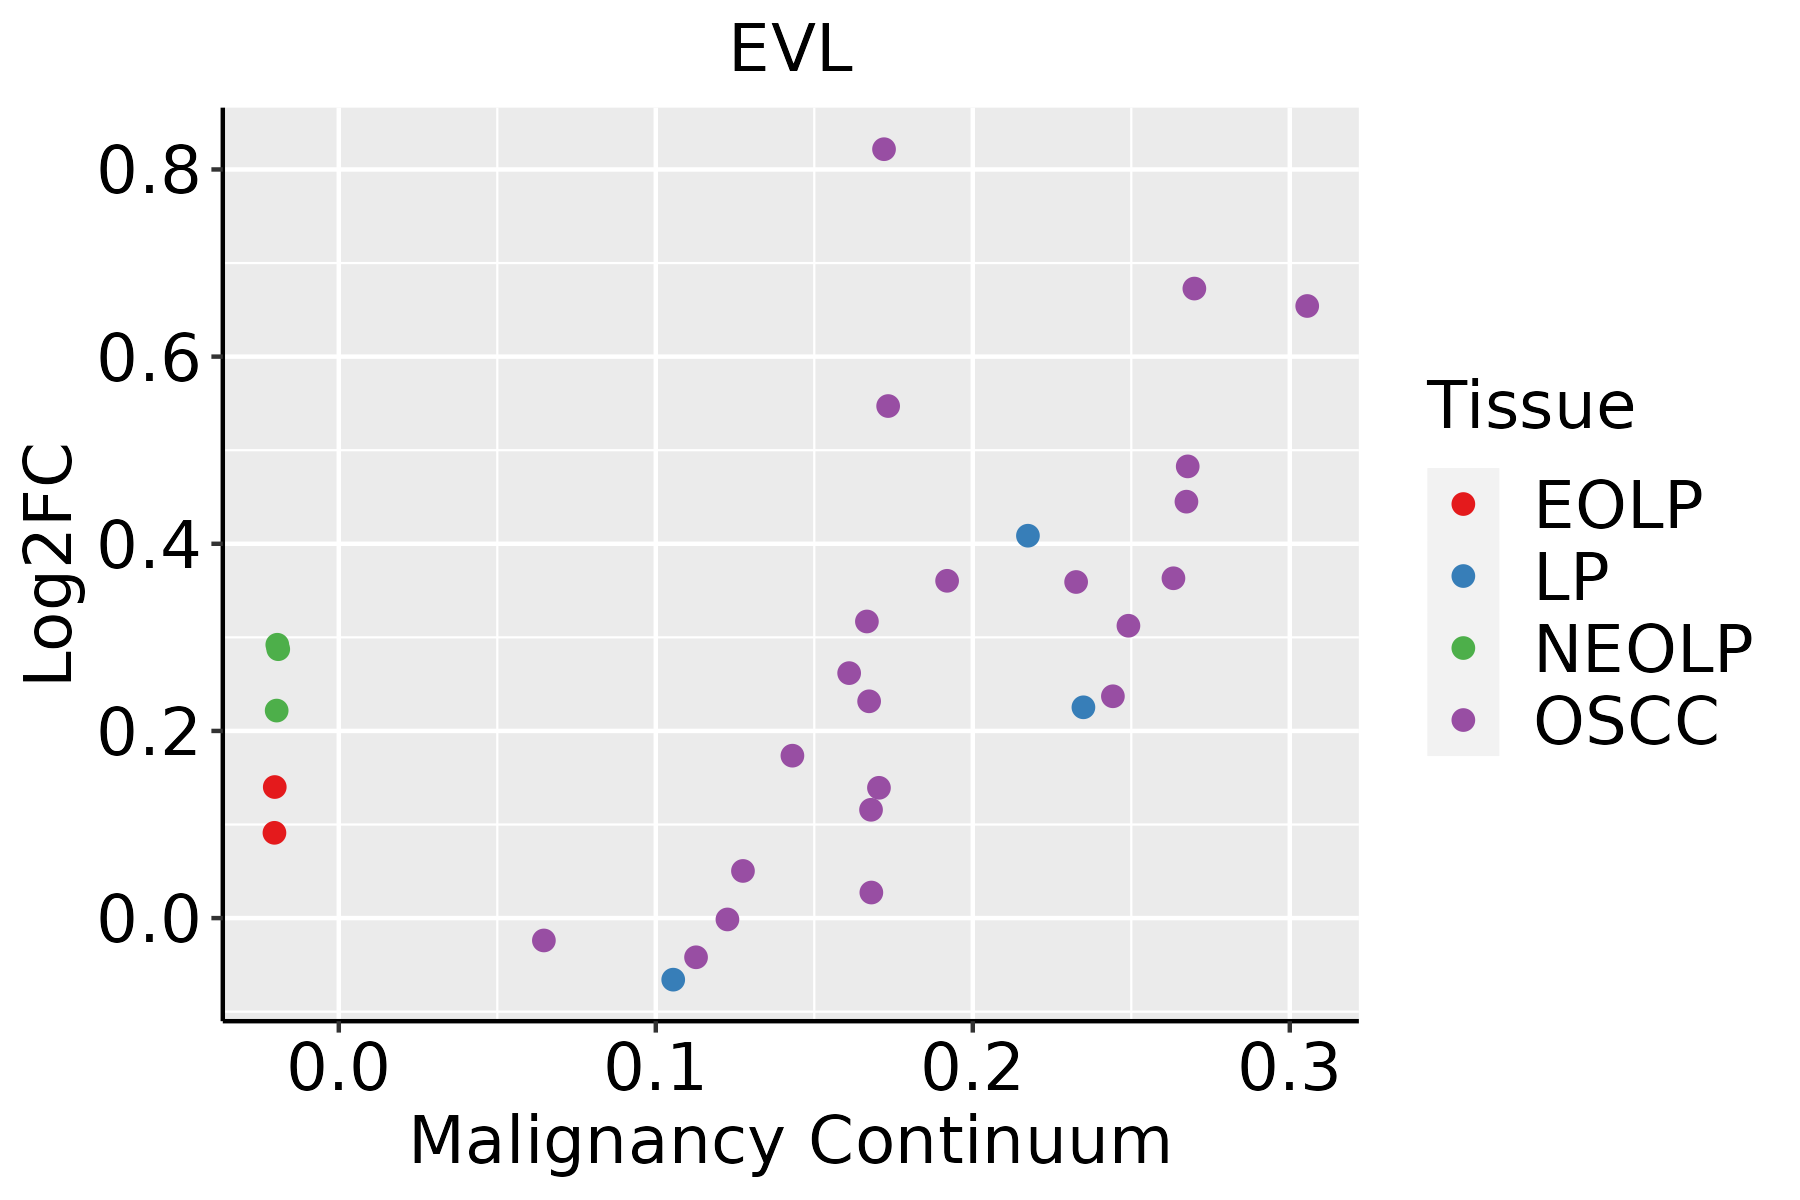 | EOLP: Erosive Oral lichen planus |
| LP: leukoplakia | ||
| NEOLP: Non-erosive oral lichen planus | ||
| OSCC: Oral squamous cell carcinoma | ||
| Thyroid | 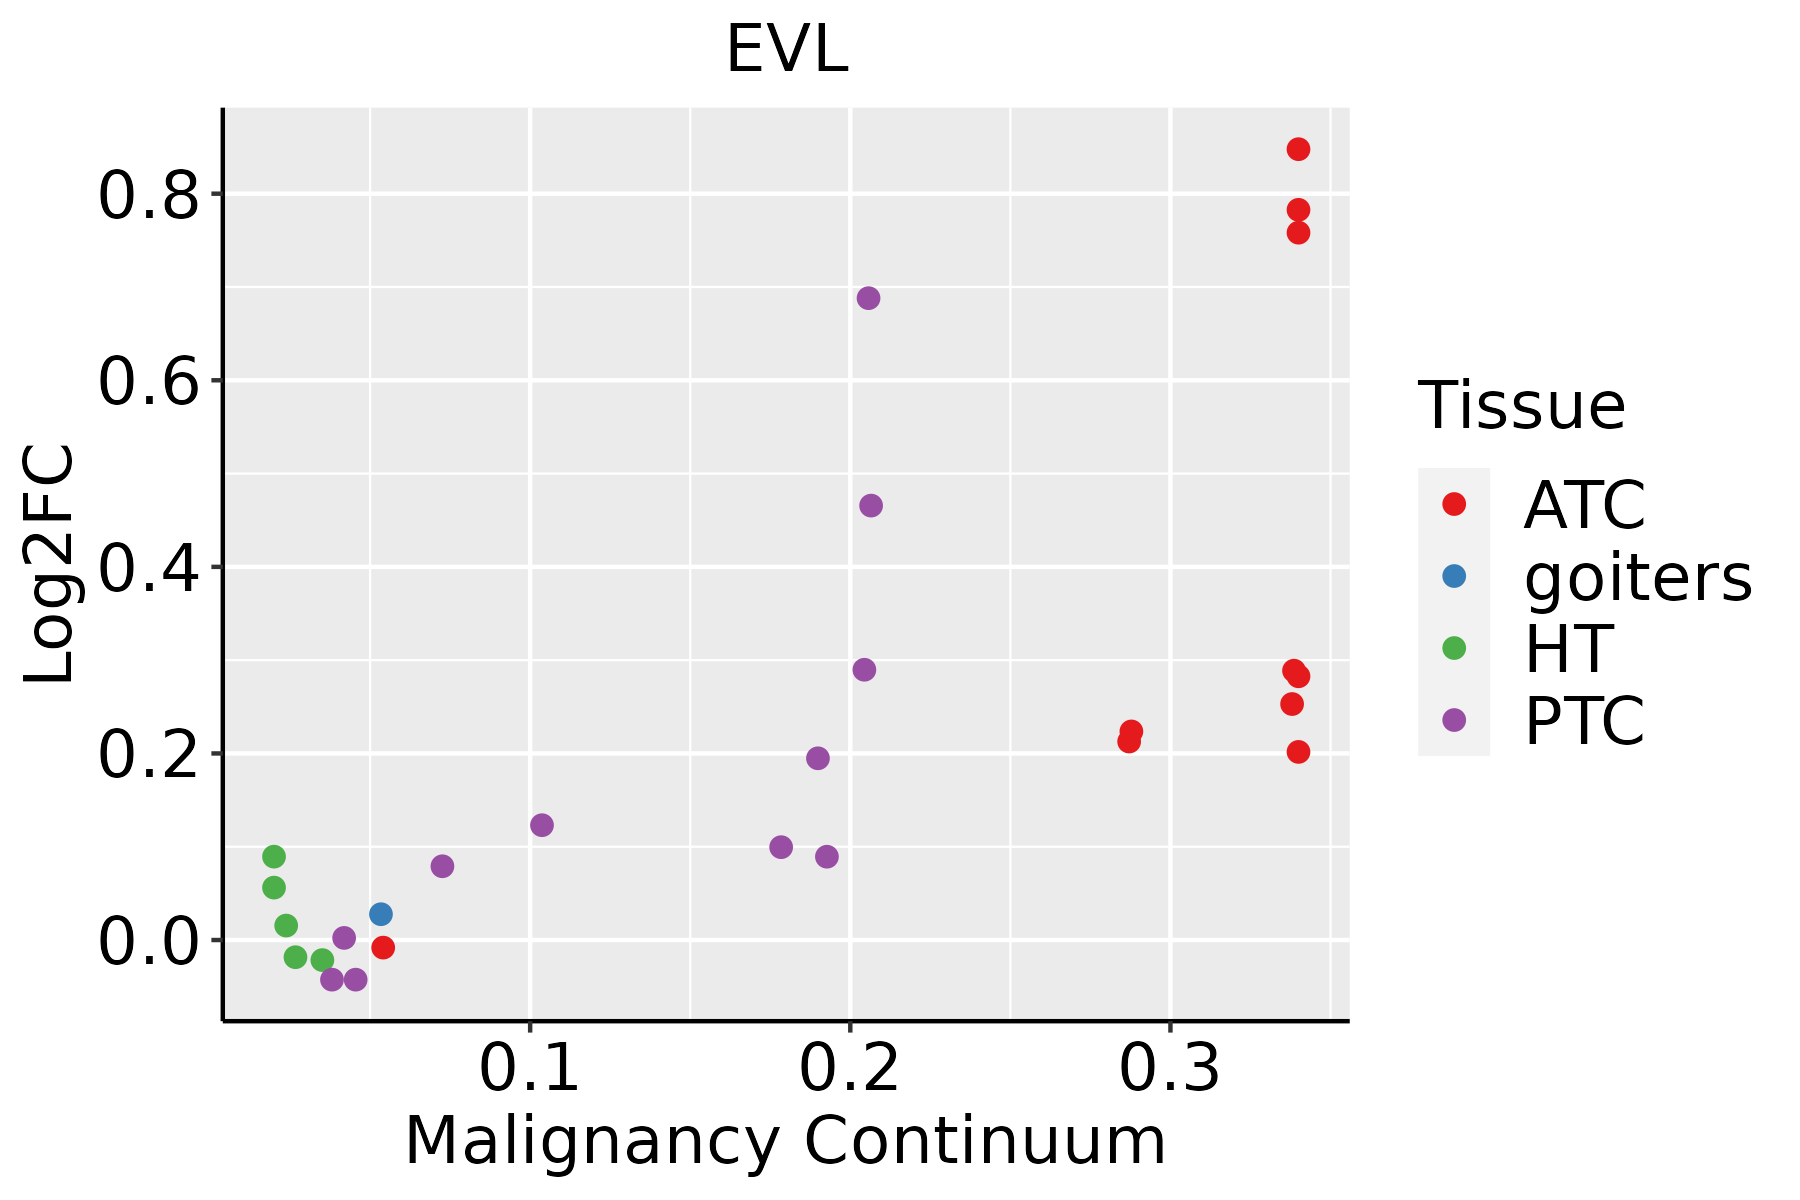 | ATC: Anaplastic thyroid cancer |
| HT: Hashimoto's thyroiditis | ||
| PTC: Papillary thyroid cancer |
| ∗log2FC in expression of this searched gene in stem-like cells from each diseased tissue sample relative to stem-like cells in normal samples in each tissue plotted against the malignancy continuum. Samples are colored based on if they are from different disease stage. |
Top |
Malignant transformation related pathway analysis |
| Find out the enriched GO biological processes and KEGG pathways involved in transition from healthy to precancer to cancer |
| Tissue | Disease Stage | Enriched GO biological Processes |
| Colorectum | AD |  |
| Colorectum | SER |  |
| Colorectum | MSS |  |
| Colorectum | MSI-H |  |
| Colorectum | FAP |  |
| ∗Top 15 enriched GO BP terms are showed in the bar plot of each disease state in each tissue. Each row represents a significant GO biological process which is colored according to the -log10(p.adjust). |
| Page: 1 2 3 4 5 6 7 8 9 |
| GO ID | Tissue | Disease Stage | Description | Gene Ratio | Bg Ratio | pvalue | p.adjust | Count |
| GO:0031032110 | Thyroid | PTC | actomyosin structure organization | 91/5968 | 196/18723 | 1.35e-05 | 1.45e-04 | 91 |
| GO:009717815 | Thyroid | PTC | ruffle assembly | 28/5968 | 44/18723 | 1.46e-05 | 1.56e-04 | 28 |
| GO:003223323 | Thyroid | PTC | positive regulation of actin filament bundle assembly | 36/5968 | 63/18723 | 2.98e-05 | 2.86e-04 | 36 |
| GO:003083823 | Thyroid | PTC | positive regulation of actin filament polymerization | 51/5968 | 99/18723 | 3.77e-05 | 3.48e-04 | 51 |
| GO:0010631111 | Thyroid | PTC | epithelial cell migration | 149/5968 | 357/18723 | 4.83e-05 | 4.33e-04 | 149 |
| GO:0090132111 | Thyroid | PTC | epithelium migration | 149/5968 | 360/18723 | 7.89e-05 | 6.74e-04 | 149 |
| GO:005149615 | Thyroid | PTC | positive regulation of stress fiber assembly | 30/5968 | 52/18723 | 1.06e-04 | 8.56e-04 | 30 |
| GO:0090130111 | Thyroid | PTC | tissue migration | 150/5968 | 365/18723 | 1.13e-04 | 9.01e-04 | 150 |
| GO:0010632111 | Thyroid | PTC | regulation of epithelial cell migration | 123/5968 | 292/18723 | 1.33e-04 | 1.05e-03 | 123 |
| GO:00313459 | Thyroid | PTC | negative regulation of cell projection organization | 83/5968 | 186/18723 | 1.72e-04 | 1.32e-03 | 83 |
| GO:19000279 | Thyroid | PTC | regulation of ruffle assembly | 20/5968 | 31/18723 | 1.88e-04 | 1.42e-03 | 20 |
| GO:00450109 | Thyroid | PTC | actin nucleation | 28/5968 | 52/18723 | 8.33e-04 | 5.13e-03 | 28 |
| GO:1902903210 | Thyroid | ATC | regulation of supramolecular fiber organization | 210/6293 | 383/18723 | 6.20e-18 | 7.54e-16 | 210 |
| GO:0043254210 | Thyroid | ATC | regulation of protein-containing complex assembly | 225/6293 | 428/18723 | 2.72e-16 | 2.33e-14 | 225 |
| GO:0032970210 | Thyroid | ATC | regulation of actin filament-based process | 208/6293 | 397/18723 | 5.82e-15 | 3.80e-13 | 208 |
| GO:0007015210 | Thyroid | ATC | actin filament organization | 227/6293 | 442/18723 | 5.96e-15 | 3.85e-13 | 227 |
| GO:0032956210 | Thyroid | ATC | regulation of actin cytoskeleton organization | 190/6293 | 358/18723 | 1.73e-14 | 1.01e-12 | 190 |
| GO:005125829 | Thyroid | ATC | protein polymerization | 159/6293 | 297/18723 | 9.33e-13 | 3.96e-11 | 159 |
| GO:0110053210 | Thyroid | ATC | regulation of actin filament organization | 150/6293 | 278/18723 | 1.82e-12 | 7.58e-11 | 150 |
| GO:0051495111 | Thyroid | ATC | positive regulation of cytoskeleton organization | 125/6293 | 226/18723 | 1.39e-11 | 5.08e-10 | 125 |
| Page: 1 2 3 4 5 6 7 8 9 10 11 12 13 14 |
| Pathway ID | Tissue | Disease Stage | Description | Gene Ratio | Bg Ratio | pvalue | p.adjust | qvalue | Count |
| hsa0401518 | Oral cavity | OSCC | Rap1 signaling pathway | 107/3704 | 210/8465 | 2.01e-02 | 4.34e-02 | 2.21e-02 | 107 |
| hsa0401519 | Oral cavity | OSCC | Rap1 signaling pathway | 107/3704 | 210/8465 | 2.01e-02 | 4.34e-02 | 2.21e-02 | 107 |
| hsa0401524 | Oral cavity | NEOLP | Rap1 signaling pathway | 40/1112 | 210/8465 | 9.07e-03 | 3.17e-02 | 1.99e-02 | 40 |
| hsa0401534 | Oral cavity | NEOLP | Rap1 signaling pathway | 40/1112 | 210/8465 | 9.07e-03 | 3.17e-02 | 1.99e-02 | 40 |
| Page: 1 |
Top |
Cell-cell communication analysis |
| Identification of potential cell-cell interactions between two cell types and their ligand-receptor pairs for different disease states |
| Ligand | Receptor | LRpair | Pathway | Tissue | Disease Stage |
| Page: 1 |
Top |
Single-cell gene regulatory network inference analysis |
| Find out the significant the regulons (TFs) and the target genes of each regulon across cell types for different disease states |
| TF | Cell Type | Tissue | Disease Stage | Target Gene | RSS | Regulon Activity |
| ∗The dot plots of a searched regulon are shown for all cell subpopulations in each disease state of each tissue based on the regulon specific score inferred using pySCENIC and by calculating the average expression. |
| Page: 1 |
Top |
Somatic mutation of malignant transformation related genes |
| Annotation of somatic variants for genes involved in malignant transformation |
| Hugo Symbol | Variant Class | Variant Classification | dbSNP RS | HGVSc | HGVSp | HGVSp Short | SWISSPROT | BIOTYPE | SIFT | PolyPhen | Tumor Sample Barcode | Tissue | Histology | Sex | Age | Stage | Therapy Types | Drugs | Outcome |
| EVL | SNV | Missense_Mutation | novel | c.1090T>C | p.Ser364Pro | p.S364P | Q9UI08 | protein_coding | deleterious(0.03) | benign(0.405) | TCGA-A8-A07J-01 | Breast | breast invasive carcinoma | Female | <65 | I/II | Chemotherapy | 5-fluorouracil | CR |
| EVL | SNV | Missense_Mutation | novel | c.444N>T | p.Gln148His | p.Q148H | Q9UI08 | protein_coding | tolerated(0.13) | benign(0.003) | TCGA-C8-A3M7-01 | Breast | breast invasive carcinoma | Female | <65 | III/IV | Unknown | Unknown | PD |
| EVL | insertion | In_Frame_Ins | novel | c.899_900insCACCAGACGGGGCCTAGACAA | p.Met300delinsIleThrArgArgGlyLeuAspLys | p.M300delinsITRRGLDK | Q9UI08 | protein_coding | TCGA-A2-A04Y-01 | Breast | breast invasive carcinoma | Female | <65 | I/II | Chemotherapy | cytoxan | SD | ||
| EVL | insertion | In_Frame_Ins | novel | c.1093_1094insACTCCTCAGGTGAGA | p.Ser364_Arg365insAsnSerSerGlyGlu | p.S364_R365insNSSGE | Q9UI08 | protein_coding | TCGA-A8-A07J-01 | Breast | breast invasive carcinoma | Female | <65 | I/II | Chemotherapy | 5-fluorouracil | CR | ||
| EVL | SNV | Missense_Mutation | c.1075N>G | p.Gln359Glu | p.Q359E | Q9UI08 | protein_coding | tolerated(0.64) | possibly_damaging(0.83) | TCGA-DR-A0ZM-01 | Cervix | cervical & endocervical cancer | Female | <65 | III/IV | Unspecific | Cisplatin | SD | |
| EVL | SNV | Missense_Mutation | novel | c.1065N>C | p.Lys355Asn | p.K355N | Q9UI08 | protein_coding | tolerated(0.15) | probably_damaging(0.985) | TCGA-VS-A953-01 | Cervix | cervical & endocervical cancer | Female | <65 | I/II | Unknown | Unknown | PD |
| EVL | SNV | Missense_Mutation | novel | c.409G>C | p.Asp137His | p.D137H | Q9UI08 | protein_coding | deleterious(0) | possibly_damaging(0.694) | TCGA-VS-A958-01 | Cervix | cervical & endocervical cancer | Female | <65 | I/II | Chemotherapy | cisplatin | CR |
| EVL | SNV | Missense_Mutation | novel | c.1090T>C | p.Ser364Pro | p.S364P | Q9UI08 | protein_coding | deleterious(0.03) | benign(0.405) | TCGA-A6-6648-01 | Colorectum | colon adenocarcinoma | Male | <65 | I/II | Chemotherapy | oxaliplatin | PD |
| EVL | SNV | Missense_Mutation | novel | c.251G>T | p.Arg84Leu | p.R84L | Q9UI08 | protein_coding | deleterious(0) | probably_damaging(0.975) | TCGA-AA-A02O-01 | Colorectum | colon adenocarcinoma | Male | >=65 | I/II | Unknown | Unknown | SD |
| EVL | SNV | Missense_Mutation | rs750787699 | c.452N>A | p.Arg151His | p.R151H | Q9UI08 | protein_coding | deleterious(0.02) | benign(0.037) | TCGA-AD-5900-01 | Colorectum | colon adenocarcinoma | Male | >=65 | I/II | Unknown | Unknown | SD |
| Page: 1 2 3 4 |
Top |
Related drugs of malignant transformation related genes |
| Identification of chemicals and drugs interact with genes involved in malignant transfromation |
| (DGIdb 4.0) |
| Entrez ID | Symbol | Category | Interaction Types | Drug Claim Name | Drug Name | PMIDs |
| Page: 1 |

Copyright 2023-Present -The University of Texas Health Science Center at Houston |