| Tissue | Expression Dynamics | Abbreviation |
| Colorectum (GSE201348) |  | FAP: Familial adenomatous polyposis |
| CRC: Colorectal cancer |
| Colorectum (HTA11) | 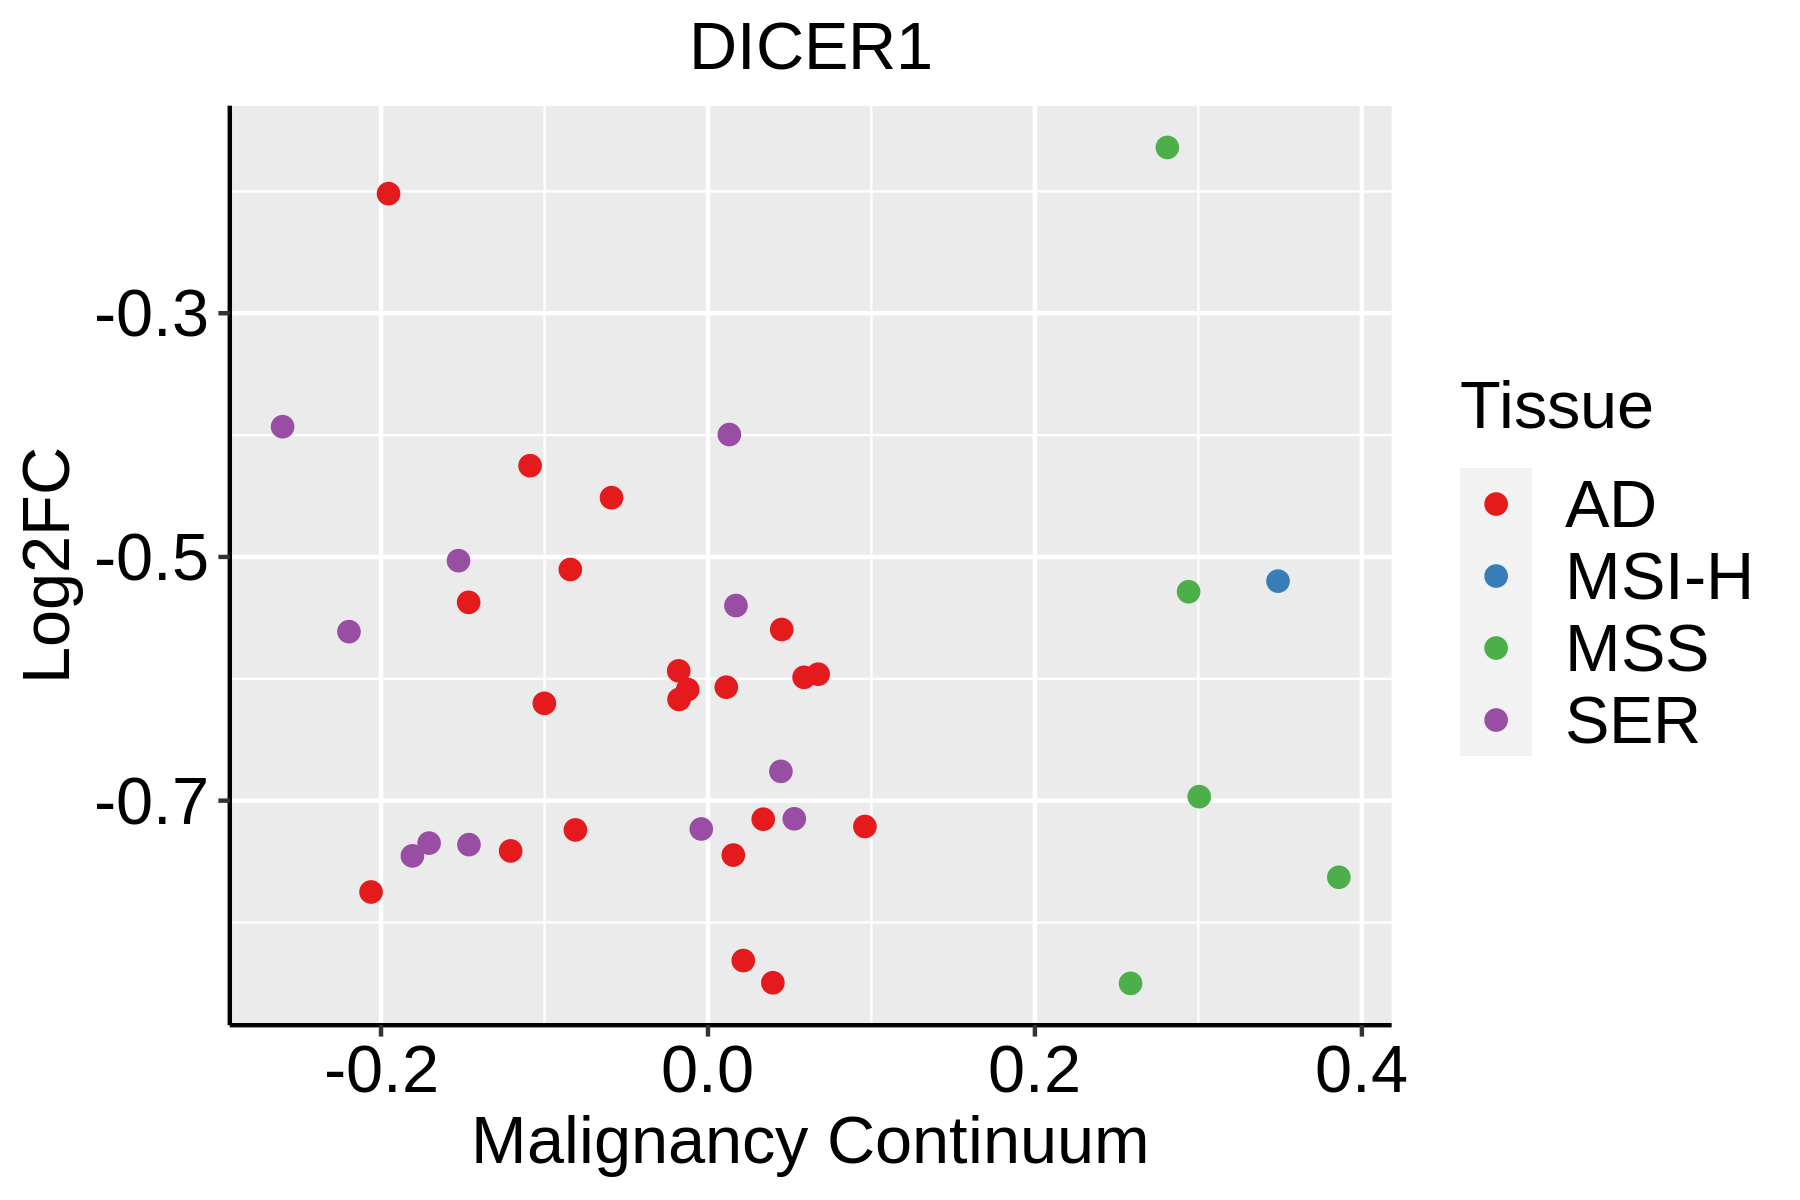 | AD: Adenomas |
| SER: Sessile serrated lesions |
| MSI-H: Microsatellite-high colorectal cancer |
| MSS: Microsatellite stable colorectal cancer |
| Esophagus | 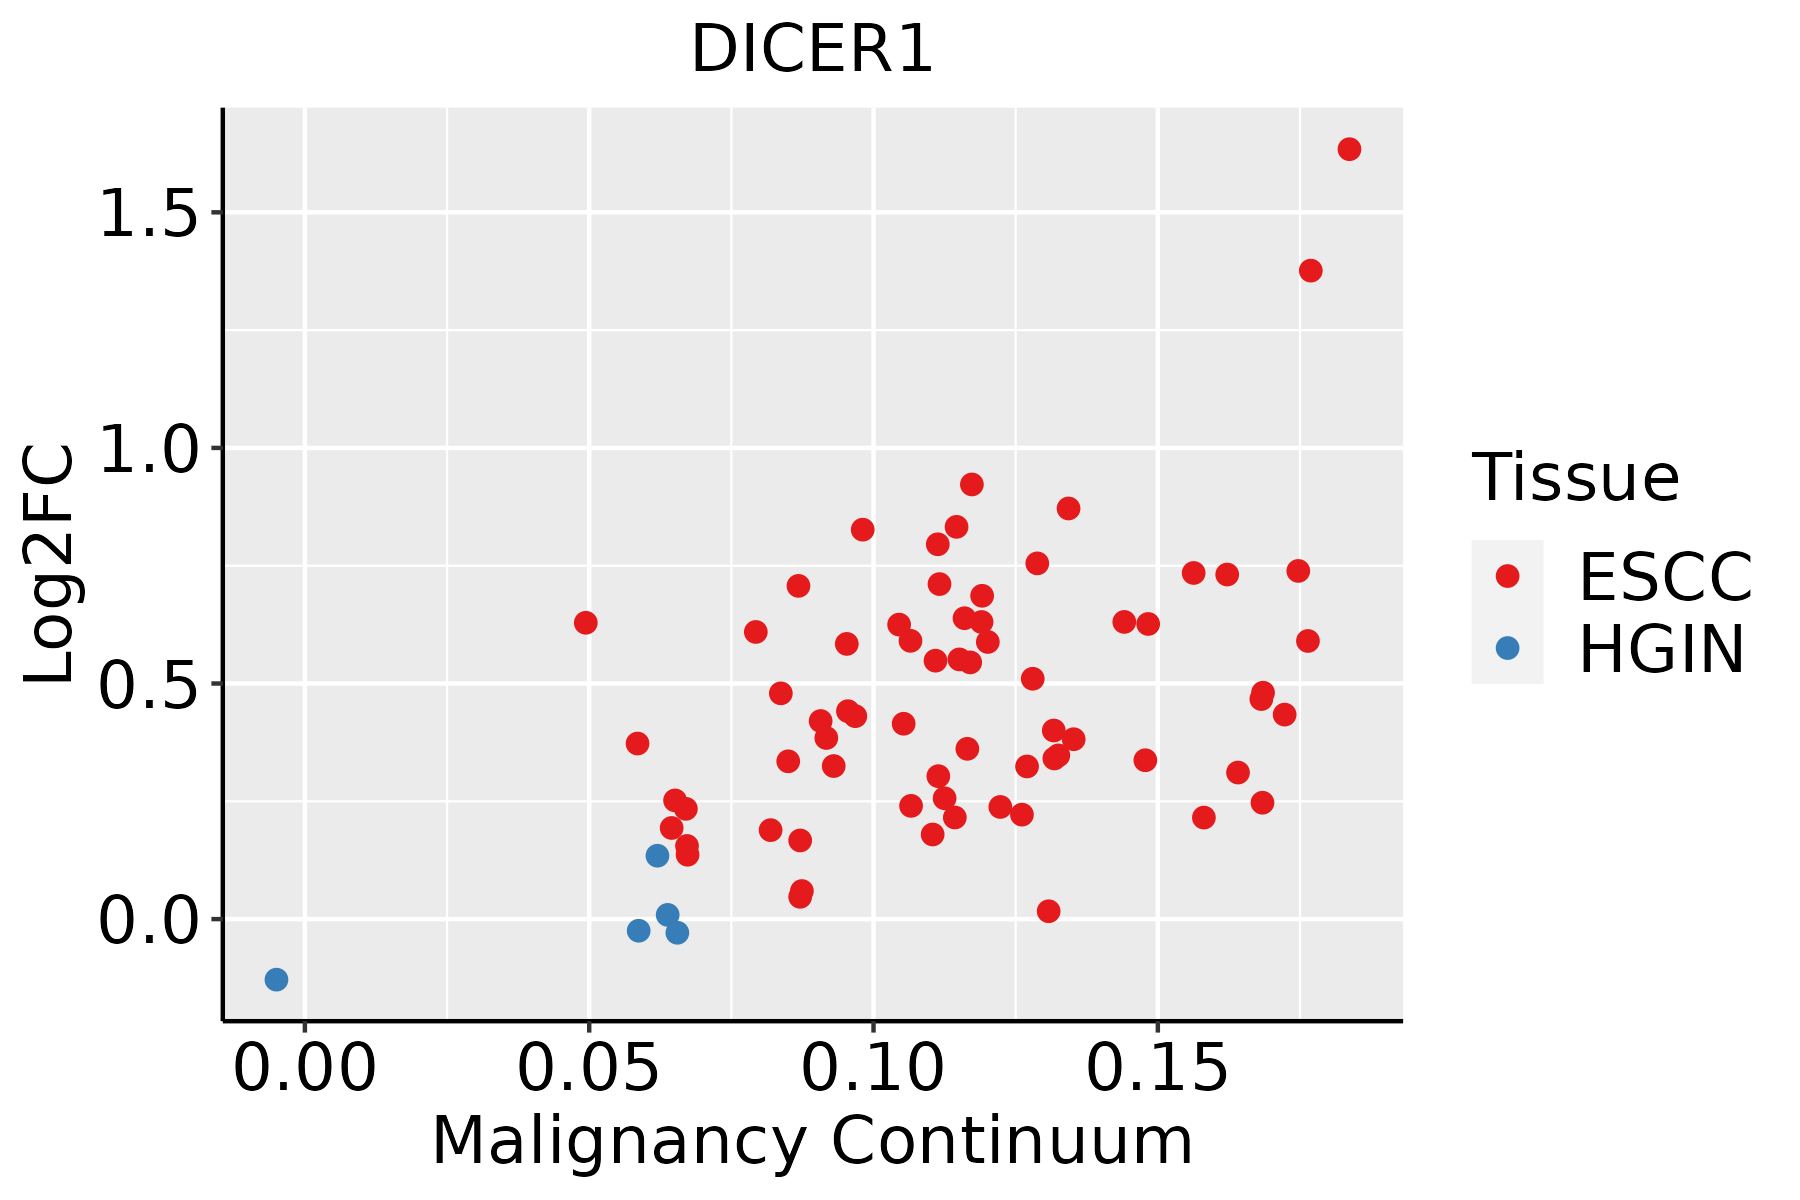 | ESCC: Esophageal squamous cell carcinoma |
| HGIN: High-grade intraepithelial neoplasias |
| LGIN: Low-grade intraepithelial neoplasias |
| Liver |  | HCC: Hepatocellular carcinoma |
| NAFLD: Non-alcoholic fatty liver disease |
| Lung | 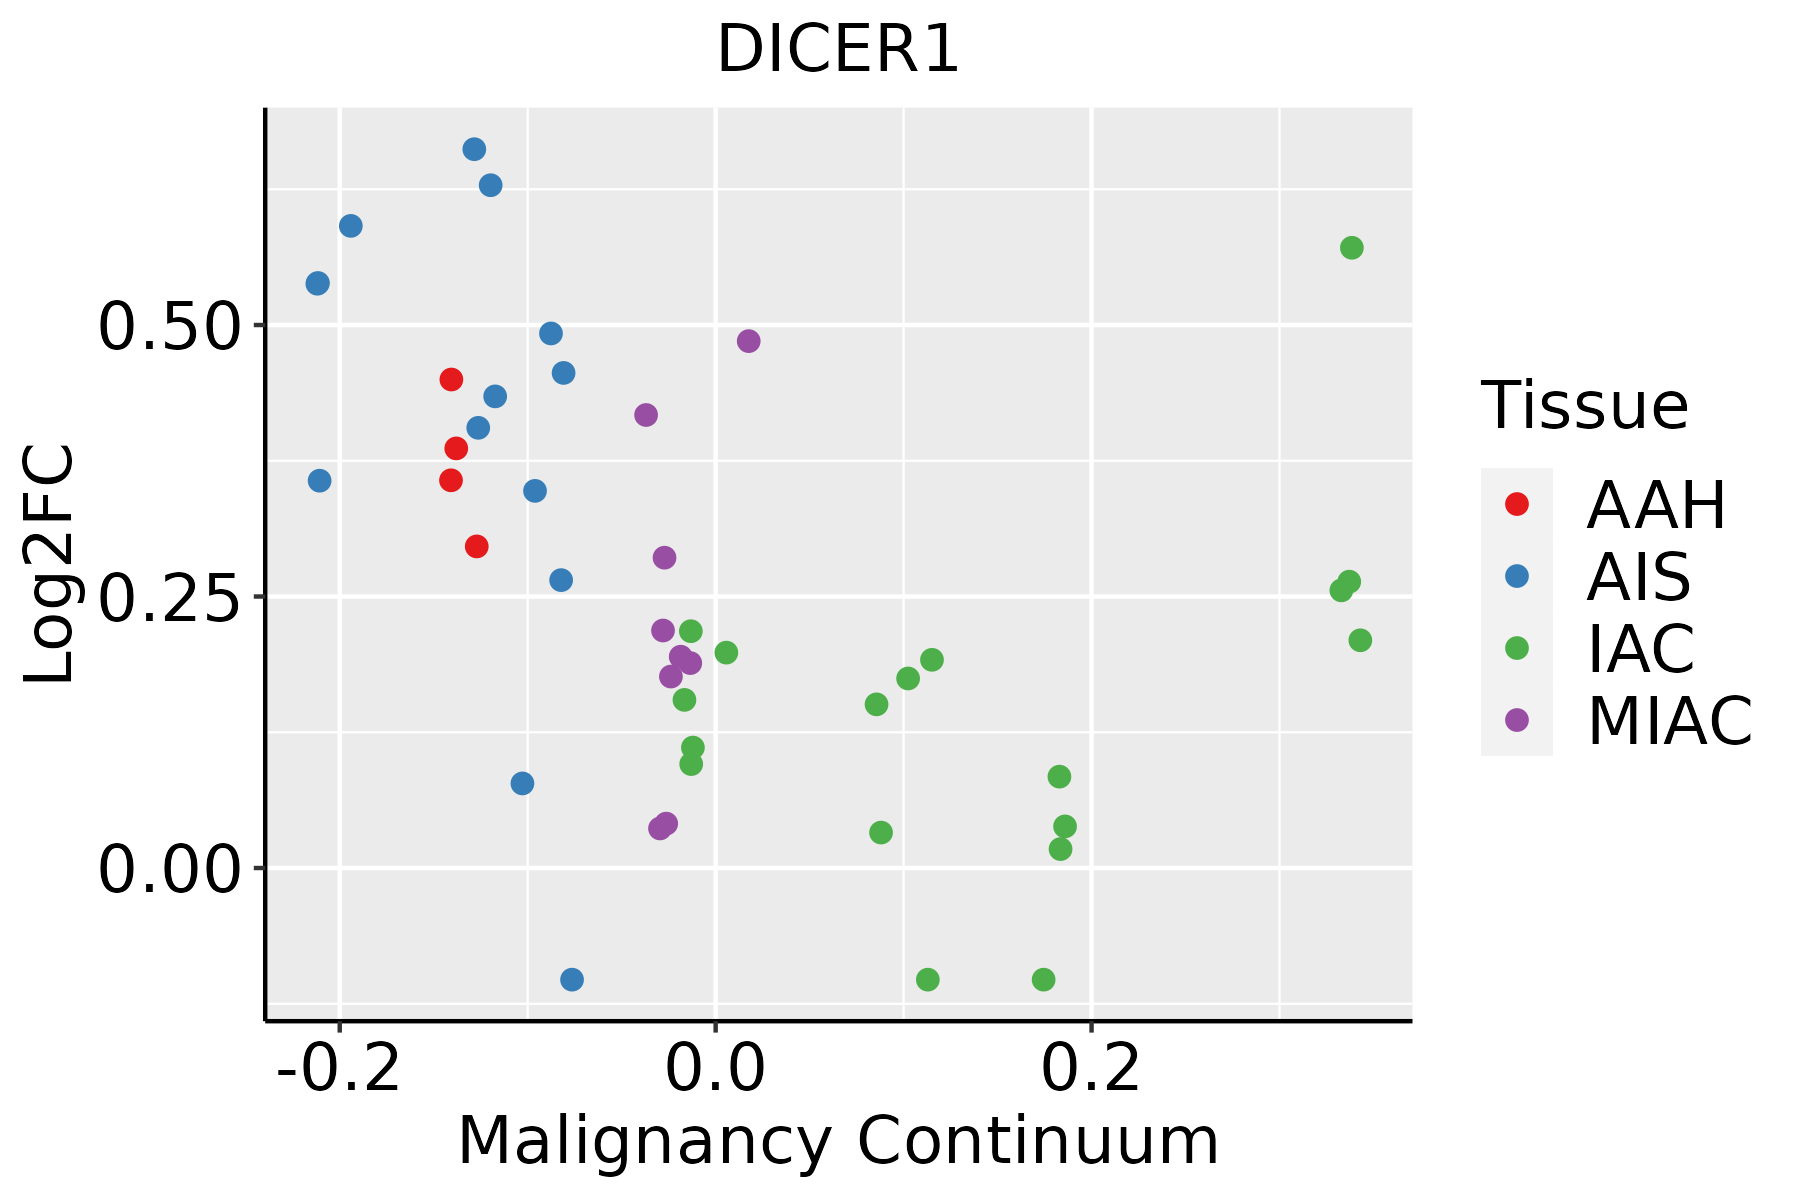 | AAH: Atypical adenomatous hyperplasia |
| AIS: Adenocarcinoma in situ |
| IAC: Invasive lung adenocarcinoma |
| MIA: Minimally invasive adenocarcinoma |
| Oral Cavity |  | EOLP: Erosive Oral lichen planus |
| LP: leukoplakia |
| NEOLP: Non-erosive oral lichen planus |
| OSCC: Oral squamous cell carcinoma |
| Prostate | 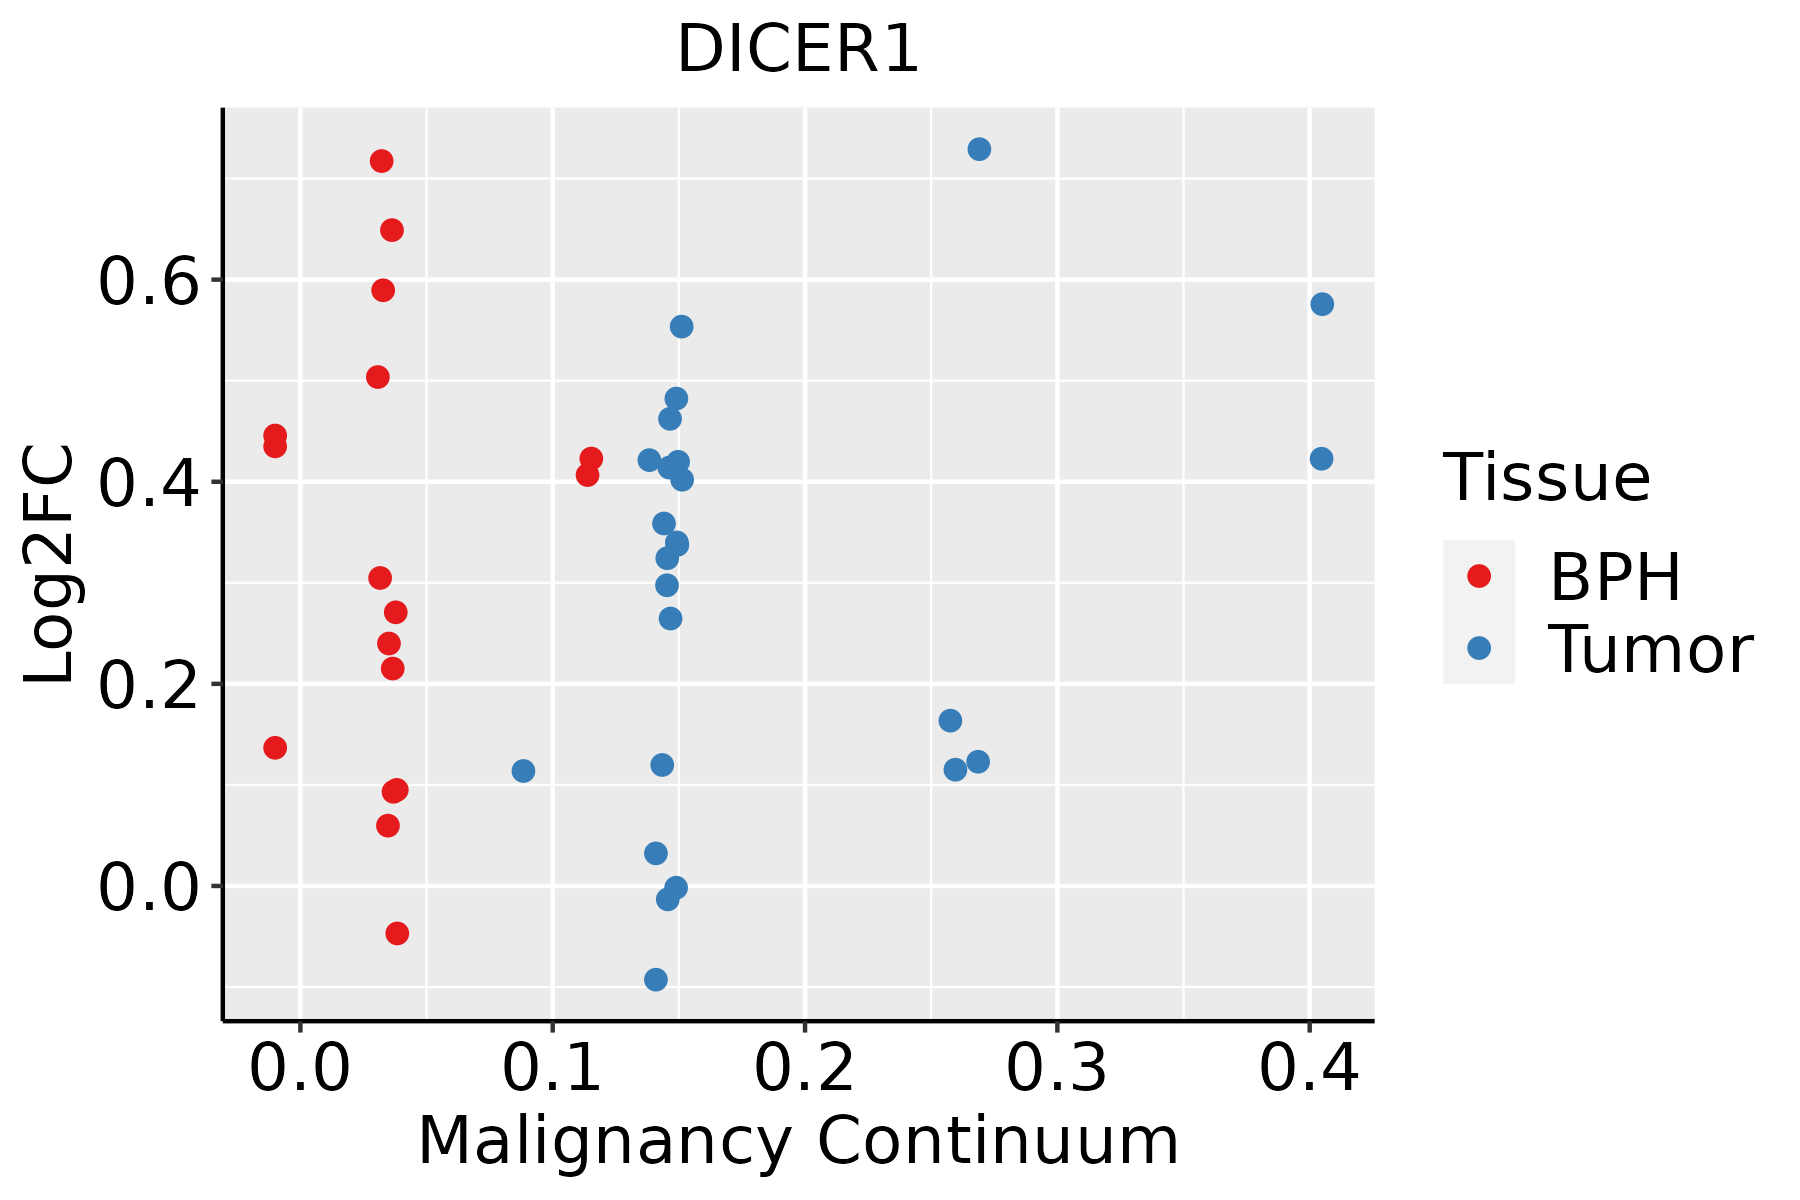 | BPH: Benign Prostatic Hyperplasia |
| Skin | 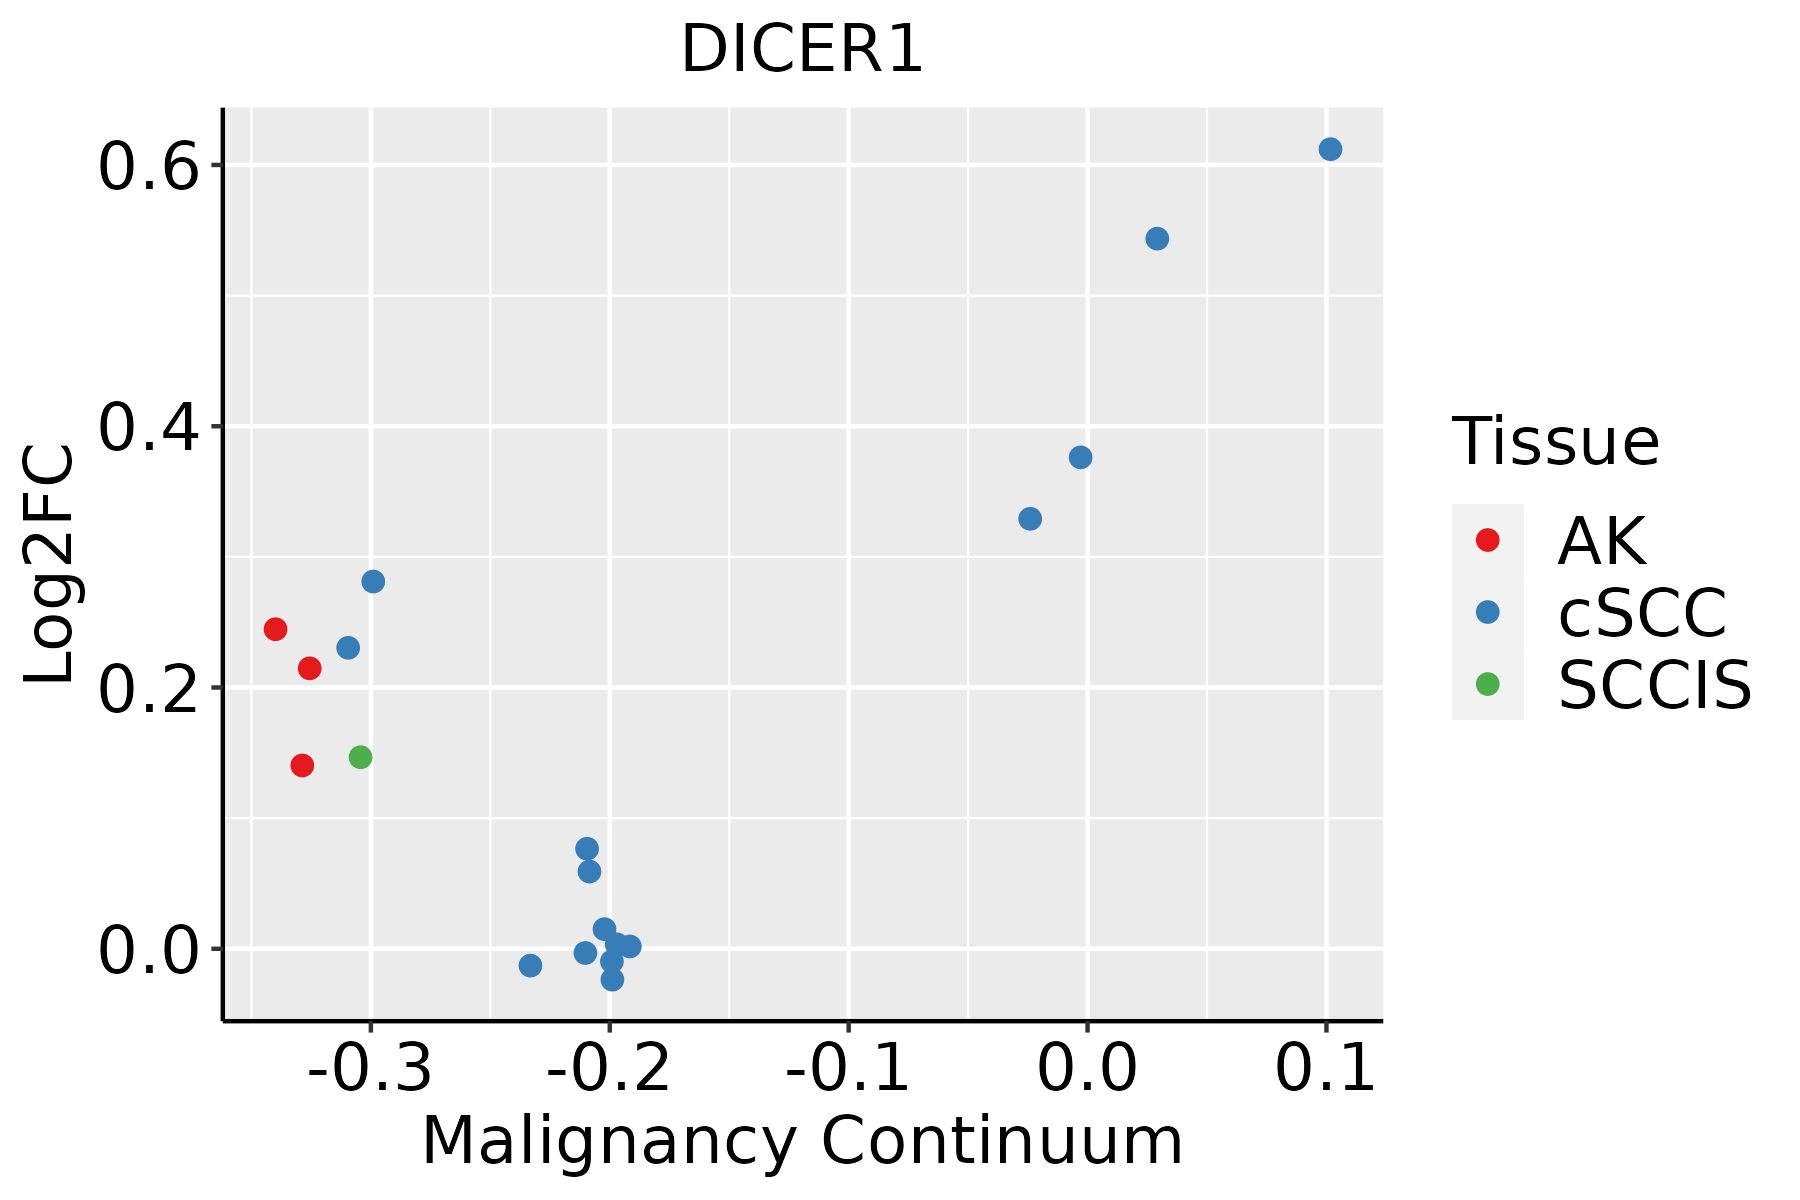 | AK: Actinic keratosis |
| cSCC: Cutaneous squamous cell carcinoma |
| SCCIS:squamous cell carcinoma in situ |
| Thyroid | 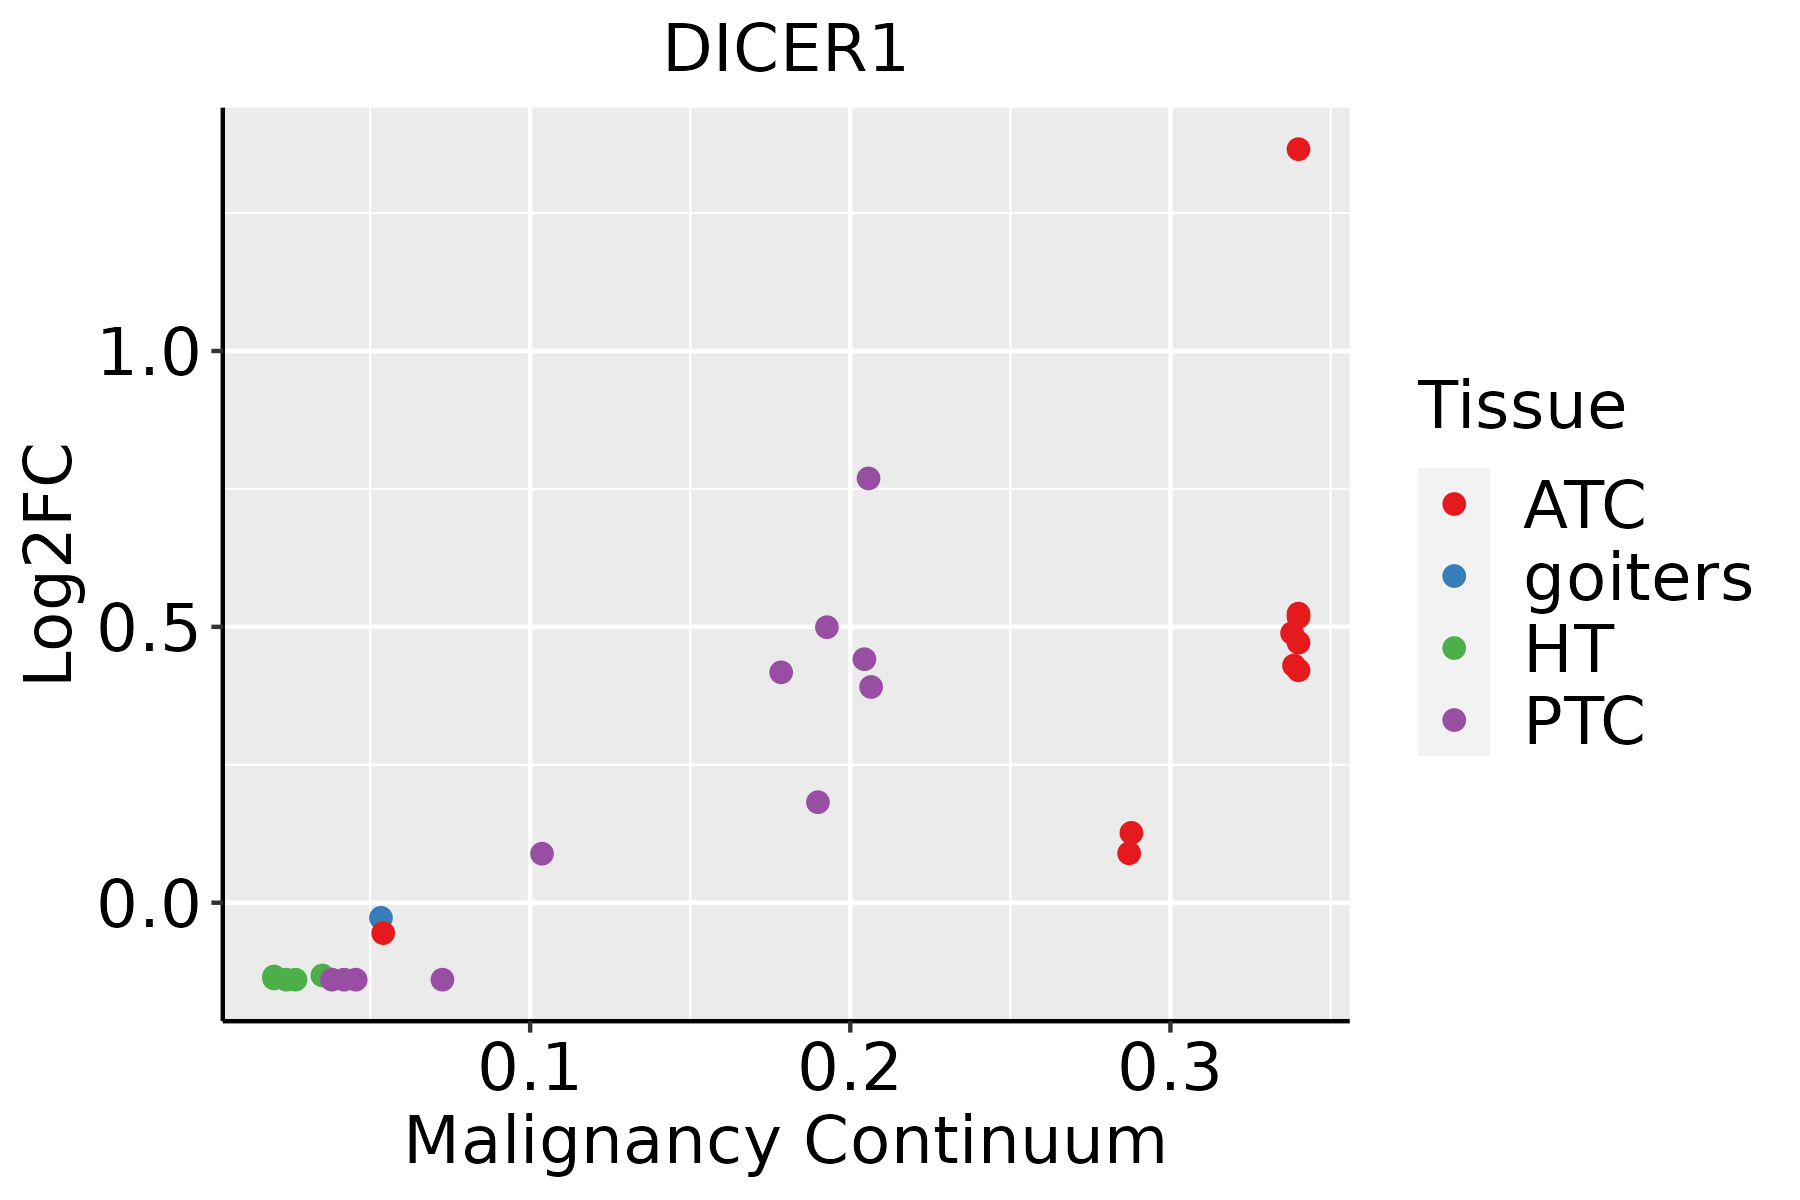 | ATC: Anaplastic thyroid cancer |
| HT: Hashimoto's thyroiditis |
| PTC: Papillary thyroid cancer |
| GO ID | Tissue | Disease Stage | Description | Gene Ratio | Bg Ratio | pvalue | p.adjust | Count |
| GO:003105012 | Lung | AIS | dsRNA processing | 13/1849 | 54/18723 | 1.89e-03 | 2.09e-02 | 13 |
| GO:007091812 | Lung | AIS | production of small RNA involved in gene silencing by RNA | 13/1849 | 54/18723 | 1.89e-03 | 2.09e-02 | 13 |
| GO:00109271 | Lung | AIS | cellular component assembly involved in morphogenesis | 20/1849 | 107/18723 | 3.79e-03 | 3.52e-02 | 20 |
| GO:00226138 | Lung | AIS | ribonucleoprotein complex biogenesis | 63/1849 | 463/18723 | 5.49e-03 | 4.68e-02 | 63 |
| GO:002261320 | Oral cavity | OSCC | ribonucleoprotein complex biogenesis | 333/7305 | 463/18723 | 8.28e-48 | 5.24e-44 | 333 |
| GO:00344709 | Oral cavity | OSCC | ncRNA processing | 263/7305 | 395/18723 | 4.38e-29 | 2.78e-26 | 263 |
| GO:002241119 | Oral cavity | OSCC | cellular component disassembly | 283/7305 | 443/18723 | 9.57e-27 | 3.37e-24 | 283 |
| GO:00346605 | Oral cavity | OSCC | ncRNA metabolic process | 296/7305 | 485/18723 | 2.94e-23 | 6.65e-21 | 296 |
| GO:000640118 | Oral cavity | OSCC | RNA catabolic process | 184/7305 | 278/18723 | 2.71e-20 | 4.19e-18 | 184 |
| GO:003465517 | Oral cavity | OSCC | nucleobase-containing compound catabolic process | 244/7305 | 407/18723 | 5.38e-18 | 5.49e-16 | 244 |
| GO:007182620 | Oral cavity | OSCC | ribonucleoprotein complex subunit organization | 152/7305 | 227/18723 | 1.05e-17 | 1.01e-15 | 152 |
| GO:002261820 | Oral cavity | OSCC | ribonucleoprotein complex assembly | 146/7305 | 220/18723 | 1.53e-16 | 1.23e-14 | 146 |
| GO:004670015 | Oral cavity | OSCC | heterocycle catabolic process | 254/7305 | 445/18723 | 5.07e-15 | 3.31e-13 | 254 |
| GO:004427016 | Oral cavity | OSCC | cellular nitrogen compound catabolic process | 256/7305 | 451/18723 | 9.67e-15 | 5.88e-13 | 256 |
| GO:001943915 | Oral cavity | OSCC | aromatic compound catabolic process | 263/7305 | 467/18723 | 1.49e-14 | 8.84e-13 | 263 |
| GO:190136115 | Oral cavity | OSCC | organic cyclic compound catabolic process | 272/7305 | 495/18723 | 2.73e-13 | 1.36e-11 | 272 |
| GO:00905012 | Oral cavity | OSCC | RNA phosphodiester bond hydrolysis | 95/7305 | 152/18723 | 3.65e-09 | 8.22e-08 | 95 |
| GO:00903052 | Oral cavity | OSCC | nucleic acid phosphodiester bond hydrolysis | 142/7305 | 261/18723 | 2.90e-07 | 4.43e-06 | 142 |
| GO:00107209 | Oral cavity | OSCC | positive regulation of cell development | 159/7305 | 298/18723 | 3.06e-07 | 4.66e-06 | 159 |
| GO:00063991 | Oral cavity | OSCC | tRNA metabolic process | 101/7305 | 179/18723 | 1.65e-06 | 2.15e-05 | 101 |
| Hugo Symbol | Variant Class | Variant Classification | dbSNP RS | HGVSc | HGVSp | HGVSp Short | SWISSPROT | BIOTYPE | SIFT | PolyPhen | Tumor Sample Barcode | Tissue | Histology | Sex | Age | Stage | Therapy Types | Drugs | Outcome |
| DICER1 | SNV | Missense_Mutation | novel | c.4430C>G | p.Ser1477Cys | p.S1477C | Q9UPY3 | protein_coding | deleterious_low_confidence(0.02) | possibly_damaging(0.733) | TCGA-5L-AAT1-01 | Breast | breast invasive carcinoma | Female | <65 | III/IV | Hormone Therapy | letrozol | SD |
| DICER1 | SNV | Missense_Mutation | | c.3037N>A | p.Pro1013Thr | p.P1013T | Q9UPY3 | protein_coding | deleterious(0) | probably_damaging(0.997) | TCGA-A2-A25A-01 | Breast | breast invasive carcinoma | Female | <65 | I/II | Unspecific | Cytoxan | SD |
| DICER1 | SNV | Missense_Mutation | | c.2326N>T | p.Val776Phe | p.V776F | Q9UPY3 | protein_coding | deleterious(0.02) | probably_damaging(0.979) | TCGA-A8-A06Z-01 | Breast | breast invasive carcinoma | Female | >=65 | I/II | Unknown | Unknown | SD |
| DICER1 | SNV | Missense_Mutation | | c.5240N>T | p.Ser1747Leu | p.S1747L | Q9UPY3 | protein_coding | deleterious(0) | probably_damaging(0.997) | TCGA-A8-A092-01 | Breast | breast invasive carcinoma | Female | <65 | III/IV | Chemotherapy | paclitaxel | CR |
| DICER1 | SNV | Missense_Mutation | novel | c.1490N>C | p.Glu497Ala | p.E497A | Q9UPY3 | protein_coding | tolerated(0.06) | probably_damaging(0.995) | TCGA-AN-A046-01 | Breast | breast invasive carcinoma | Female | >=65 | I/II | Unknown | Unknown | SD |
| DICER1 | SNV | Missense_Mutation | | c.2084C>T | p.Ala695Val | p.A695V | Q9UPY3 | protein_coding | deleterious(0) | probably_damaging(0.984) | TCGA-BH-A18G-01 | Breast | breast invasive carcinoma | Female | >=65 | I/II | Unknown | Unknown | SD |
| DICER1 | SNV | Missense_Mutation | novel | c.322N>G | p.Gln108Glu | p.Q108E | Q9UPY3 | protein_coding | tolerated(0.59) | benign(0.055) | TCGA-BH-A2L8-01 | Breast | breast invasive carcinoma | Female | <65 | I/II | Chemotherapy | cytoxan | CR |
| DICER1 | SNV | Missense_Mutation | rs752424727 | c.1778C>T | p.Ser593Leu | p.S593L | Q9UPY3 | protein_coding | tolerated(0.2) | benign(0.033) | TCGA-D8-A1JG-01 | Breast | breast invasive carcinoma | Female | <65 | I/II | Chemotherapy | doxorubicin | SD |
| DICER1 | SNV | Missense_Mutation | | c.4529N>A | p.Cys1510Tyr | p.C1510Y | Q9UPY3 | protein_coding | deleterious(0) | probably_damaging(0.998) | TCGA-D8-A1JI-01 | Breast | breast invasive carcinoma | Female | <65 | I/II | Chemotherapy | doxorubicine | SD |
| DICER1 | SNV | Missense_Mutation | | c.4018G>C | p.Glu1340Gln | p.E1340Q | Q9UPY3 | protein_coding | deleterious(0) | probably_damaging(0.998) | TCGA-D8-A27G-01 | Breast | breast invasive carcinoma | Female | >=65 | I/II | Unknown | Unknown | SD |


