| Tissue | Expression Dynamics | Abbreviation |
| Endometrium |  | AEH: Atypical endometrial hyperplasia |
| EEC: Endometrioid Cancer |
| Esophagus |  | ESCC: Esophageal squamous cell carcinoma |
| HGIN: High-grade intraepithelial neoplasias |
| LGIN: Low-grade intraepithelial neoplasias |
| Liver | 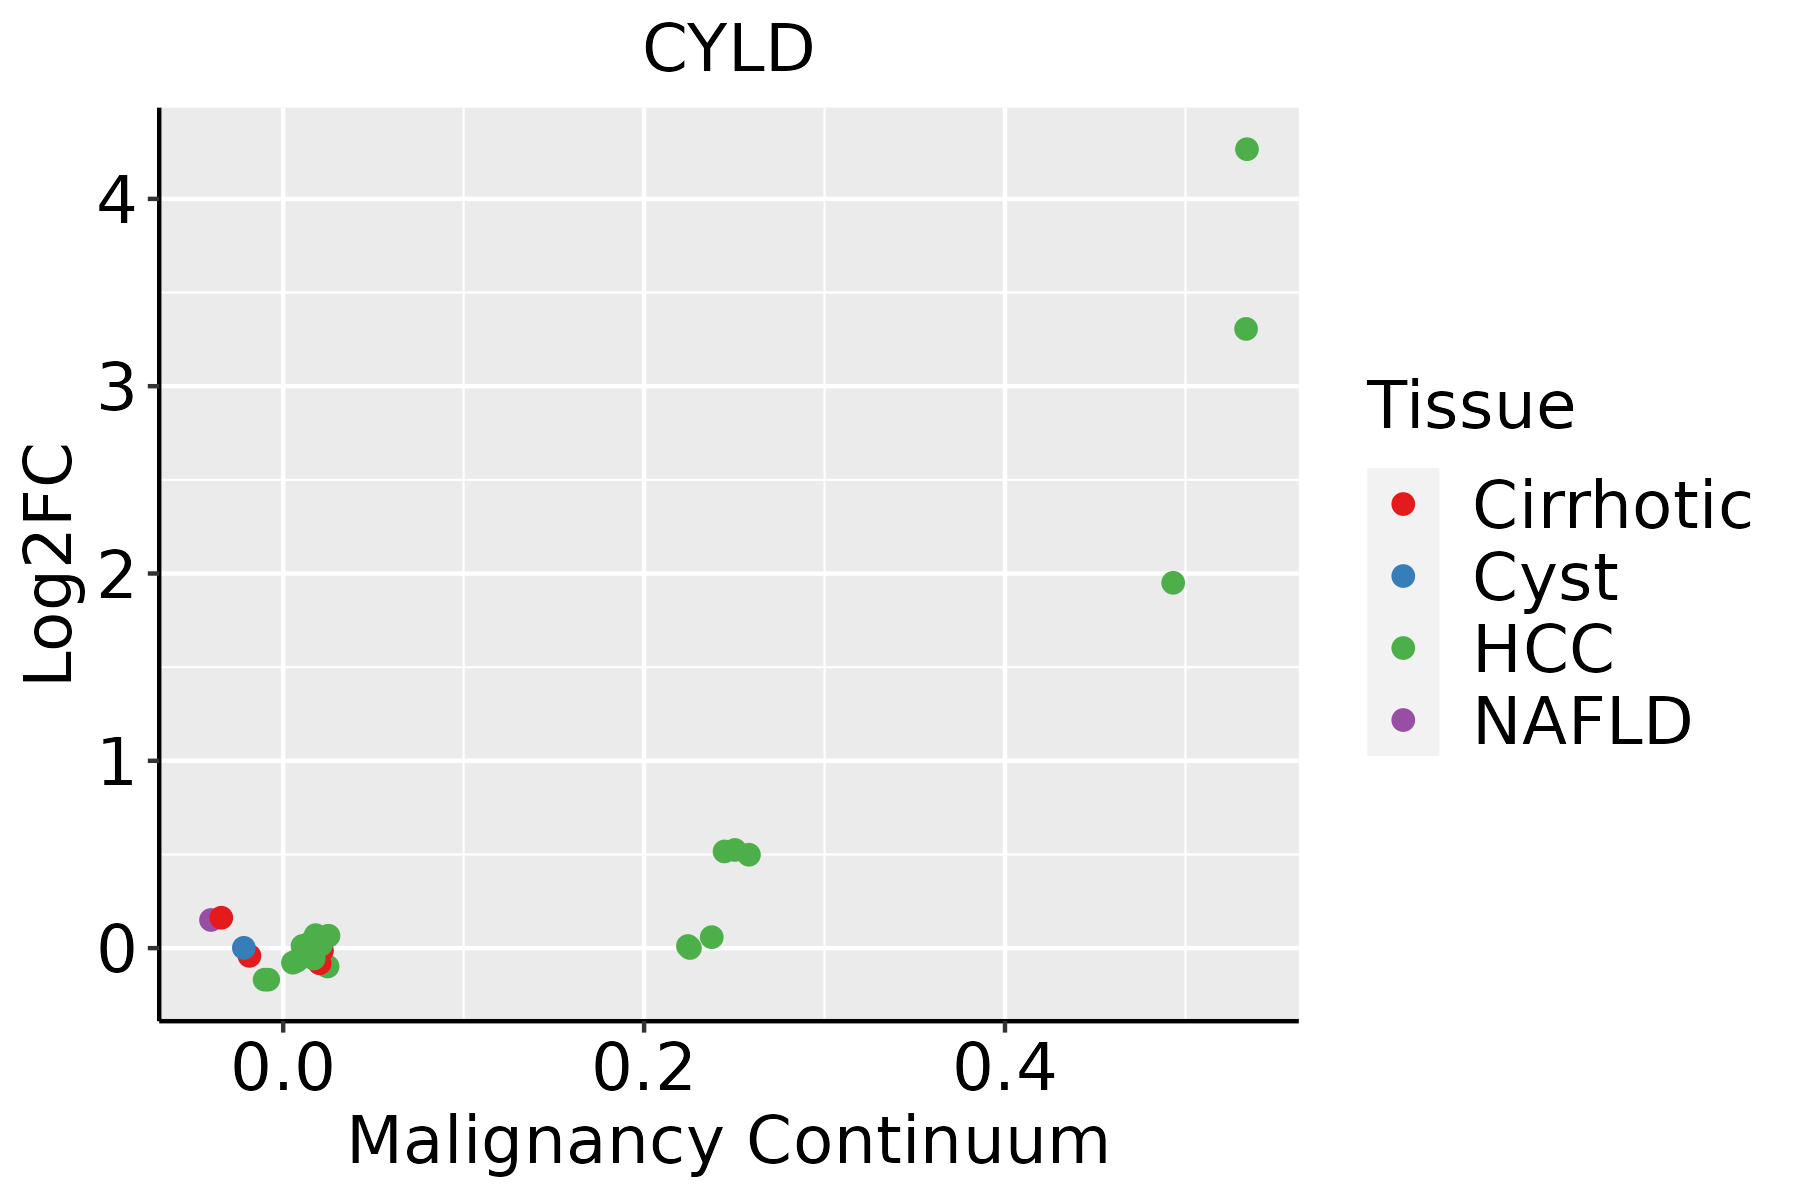 | HCC: Hepatocellular carcinoma |
| NAFLD: Non-alcoholic fatty liver disease |
| Oral Cavity | 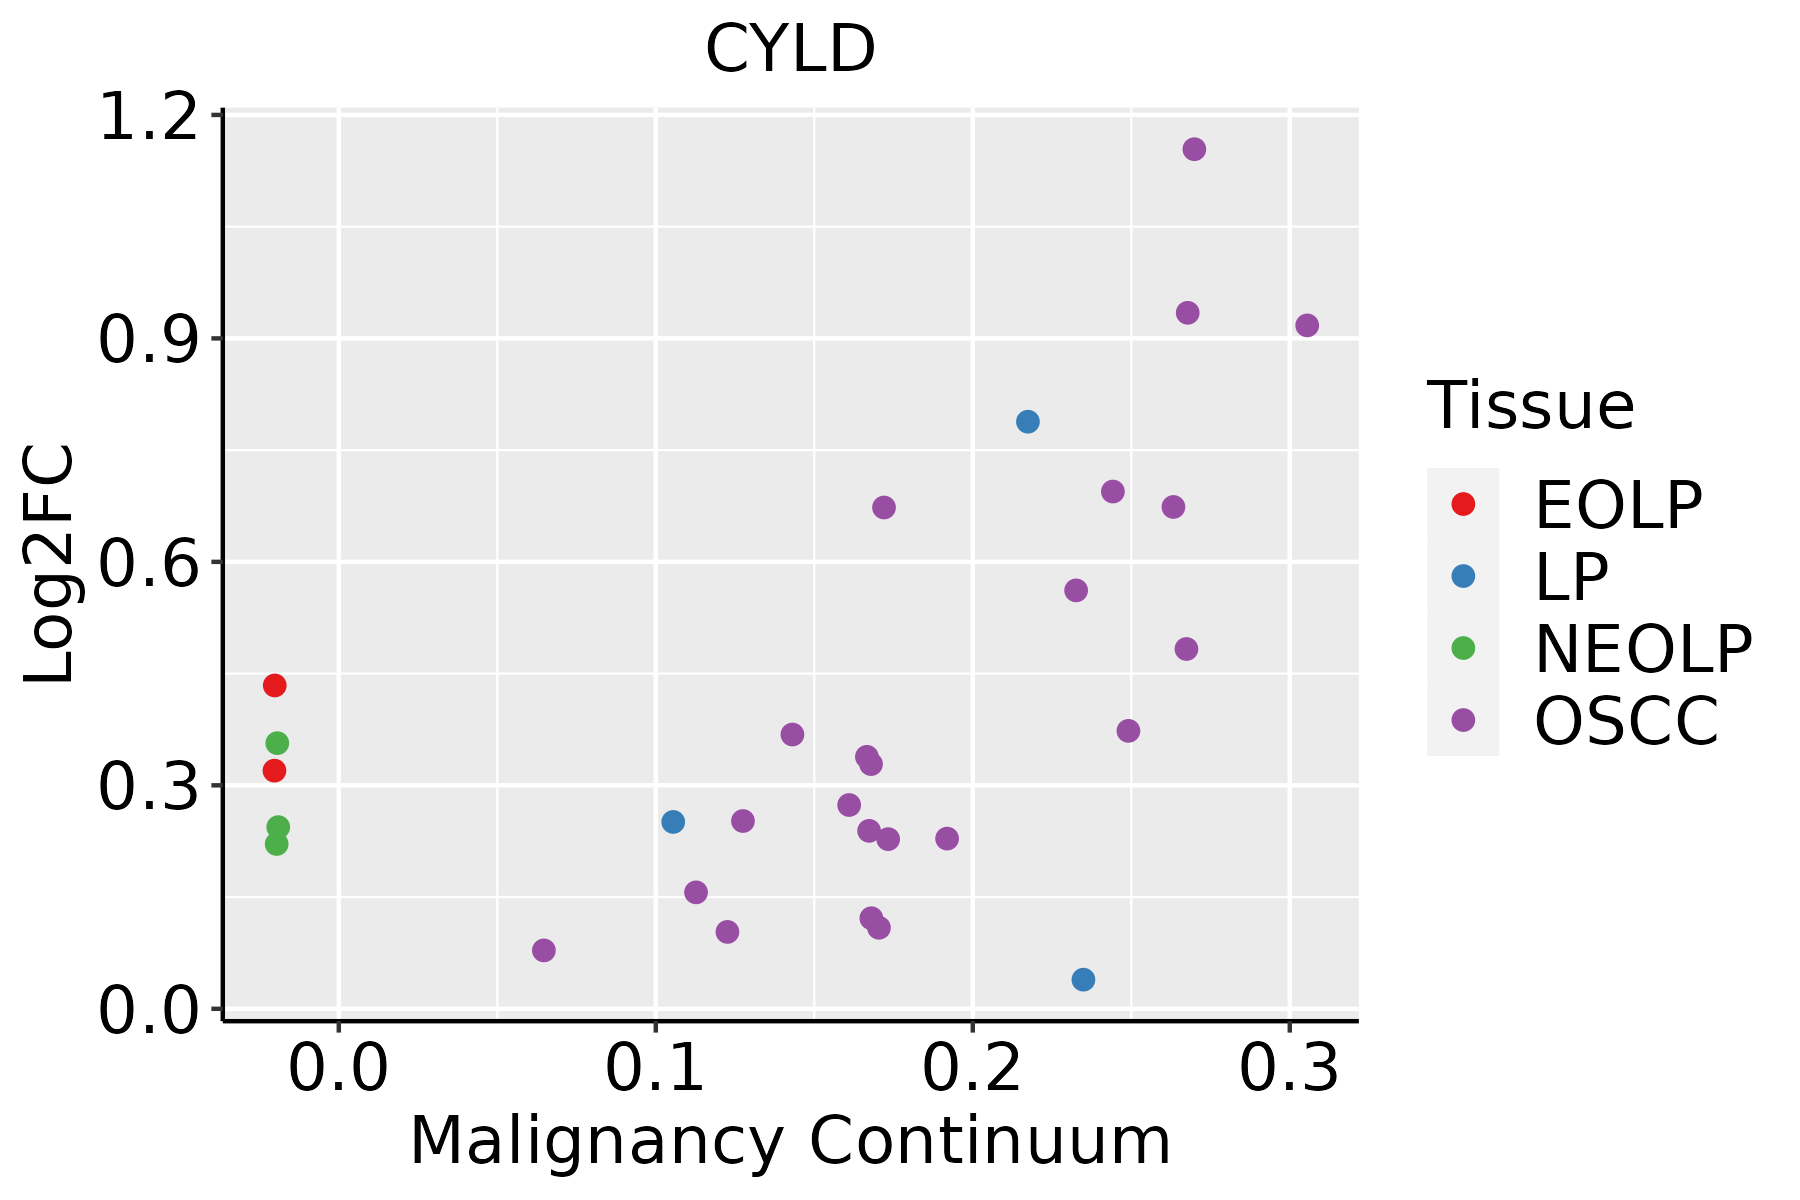 | EOLP: Erosive Oral lichen planus |
| LP: leukoplakia |
| NEOLP: Non-erosive oral lichen planus |
| OSCC: Oral squamous cell carcinoma |
| GO ID | Tissue | Disease Stage | Description | Gene Ratio | Bg Ratio | pvalue | p.adjust | Count |
| GO:000276413 | Oral cavity | EOLP | immune response-regulating signaling pathway | 108/2218 | 468/18723 | 4.04e-12 | 7.34e-10 | 108 |
| GO:00607592 | Oral cavity | EOLP | regulation of response to cytokine stimulus | 49/2218 | 162/18723 | 2.70e-10 | 2.45e-08 | 49 |
| GO:00019592 | Oral cavity | EOLP | regulation of cytokine-mediated signaling pathway | 46/2218 | 150/18723 | 5.71e-10 | 4.44e-08 | 46 |
| GO:200123525 | Oral cavity | EOLP | positive regulation of apoptotic signaling pathway | 41/2218 | 126/18723 | 6.68e-10 | 5.06e-08 | 41 |
| GO:003052225 | Oral cavity | EOLP | intracellular receptor signaling pathway | 64/2218 | 265/18723 | 1.56e-08 | 7.06e-07 | 64 |
| GO:200123625 | Oral cavity | EOLP | regulation of extrinsic apoptotic signaling pathway | 42/2218 | 151/18723 | 7.31e-08 | 2.61e-06 | 42 |
| GO:009719125 | Oral cavity | EOLP | extrinsic apoptotic signaling pathway | 54/2218 | 219/18723 | 9.74e-08 | 3.36e-06 | 54 |
| GO:000222113 | Oral cavity | EOLP | pattern recognition receptor signaling pathway | 45/2218 | 172/18723 | 1.82e-07 | 5.82e-06 | 45 |
| GO:007135623 | Oral cavity | EOLP | cellular response to tumor necrosis factor | 55/2218 | 229/18723 | 1.90e-07 | 6.02e-06 | 55 |
| GO:001922112 | Oral cavity | EOLP | cytokine-mediated signaling pathway | 94/2218 | 472/18723 | 2.36e-07 | 7.37e-06 | 94 |
| GO:001605523 | Oral cavity | EOLP | Wnt signaling pathway | 89/2218 | 444/18723 | 3.66e-07 | 1.06e-05 | 89 |
| GO:019873823 | Oral cavity | EOLP | cell-cell signaling by wnt | 89/2218 | 446/18723 | 4.49e-07 | 1.25e-05 | 89 |
| GO:003461224 | Oral cavity | EOLP | response to tumor necrosis factor | 58/2218 | 253/18723 | 4.79e-07 | 1.32e-05 | 58 |
| GO:003320922 | Oral cavity | EOLP | tumor necrosis factor-mediated signaling pathway | 30/2218 | 99/18723 | 7.19e-07 | 1.83e-05 | 30 |
| GO:007042312 | Oral cavity | EOLP | nucleotide-binding oligomerization domain containing signaling pathway | 13/2218 | 25/18723 | 1.14e-06 | 2.78e-05 | 13 |
| GO:003587212 | Oral cavity | EOLP | nucleotide-binding domain, leucine rich repeat containing receptor signaling pathway | 13/2218 | 26/18723 | 2.03e-06 | 4.60e-05 | 13 |
| GO:000275312 | Oral cavity | EOLP | cytoplasmic pattern recognition receptor signaling pathway | 21/2218 | 60/18723 | 2.55e-06 | 5.64e-05 | 21 |
| GO:003011123 | Oral cavity | EOLP | regulation of Wnt signaling pathway | 67/2218 | 328/18723 | 5.11e-06 | 1.04e-04 | 67 |
| GO:003247911 | Oral cavity | EOLP | regulation of type I interferon production | 27/2218 | 95/18723 | 9.68e-06 | 1.75e-04 | 27 |
| GO:003260611 | Oral cavity | EOLP | type I interferon production | 27/2218 | 95/18723 | 9.68e-06 | 1.75e-04 | 27 |
| Pathway ID | Tissue | Disease Stage | Description | Gene Ratio | Bg Ratio | pvalue | p.adjust | qvalue | Count |
| hsa046687 | Endometrium | EEC | TNF signaling pathway | 27/1237 | 114/8465 | 6.47e-03 | 3.22e-02 | 2.40e-02 | 27 |
| hsa0466814 | Endometrium | EEC | TNF signaling pathway | 27/1237 | 114/8465 | 6.47e-03 | 3.22e-02 | 2.40e-02 | 27 |
| hsa0466810 | Esophagus | ESCC | TNF signaling pathway | 89/4205 | 114/8465 | 3.36e-10 | 4.01e-09 | 2.06e-09 | 89 |
| hsa046259 | Esophagus | ESCC | C-type lectin receptor signaling pathway | 73/4205 | 104/8465 | 1.57e-05 | 7.98e-05 | 4.09e-05 | 73 |
| hsa040645 | Esophagus | ESCC | NF-kappa B signaling pathway | 67/4205 | 104/8465 | 1.62e-03 | 4.89e-03 | 2.50e-03 | 67 |
| hsa0466817 | Esophagus | ESCC | TNF signaling pathway | 89/4205 | 114/8465 | 3.36e-10 | 4.01e-09 | 2.06e-09 | 89 |
| hsa0462513 | Esophagus | ESCC | C-type lectin receptor signaling pathway | 73/4205 | 104/8465 | 1.57e-05 | 7.98e-05 | 4.09e-05 | 73 |
| hsa0406412 | Esophagus | ESCC | NF-kappa B signaling pathway | 67/4205 | 104/8465 | 1.62e-03 | 4.89e-03 | 2.50e-03 | 67 |
| hsa046684 | Liver | HCC | TNF signaling pathway | 73/4020 | 114/8465 | 2.53e-04 | 1.19e-03 | 6.63e-04 | 73 |
| hsa0466811 | Liver | HCC | TNF signaling pathway | 73/4020 | 114/8465 | 2.53e-04 | 1.19e-03 | 6.63e-04 | 73 |
| hsa046689 | Oral cavity | OSCC | TNF signaling pathway | 82/3704 | 114/8465 | 8.30e-10 | 9.59e-09 | 4.88e-09 | 82 |
| hsa046258 | Oral cavity | OSCC | C-type lectin receptor signaling pathway | 73/3704 | 104/8465 | 3.83e-08 | 3.12e-07 | 1.59e-07 | 73 |
| hsa040644 | Oral cavity | OSCC | NF-kappa B signaling pathway | 67/3704 | 104/8465 | 1.57e-05 | 6.75e-05 | 3.44e-05 | 67 |
| hsa043806 | Oral cavity | OSCC | Osteoclast differentiation | 73/3704 | 128/8465 | 1.60e-03 | 4.44e-03 | 2.26e-03 | 73 |
| hsa04622 | Oral cavity | OSCC | RIG-I-like receptor signaling pathway | 41/3704 | 71/8465 | 1.20e-02 | 2.63e-02 | 1.34e-02 | 41 |
| hsa0466816 | Oral cavity | OSCC | TNF signaling pathway | 82/3704 | 114/8465 | 8.30e-10 | 9.59e-09 | 4.88e-09 | 82 |
| hsa0462512 | Oral cavity | OSCC | C-type lectin receptor signaling pathway | 73/3704 | 104/8465 | 3.83e-08 | 3.12e-07 | 1.59e-07 | 73 |
| hsa0406411 | Oral cavity | OSCC | NF-kappa B signaling pathway | 67/3704 | 104/8465 | 1.57e-05 | 6.75e-05 | 3.44e-05 | 67 |
| hsa0438011 | Oral cavity | OSCC | Osteoclast differentiation | 73/3704 | 128/8465 | 1.60e-03 | 4.44e-03 | 2.26e-03 | 73 |
| hsa046221 | Oral cavity | OSCC | RIG-I-like receptor signaling pathway | 41/3704 | 71/8465 | 1.20e-02 | 2.63e-02 | 1.34e-02 | 41 |
| Hugo Symbol | Variant Class | Variant Classification | dbSNP RS | HGVSc | HGVSp | HGVSp Short | SWISSPROT | BIOTYPE | SIFT | PolyPhen | Tumor Sample Barcode | Tissue | Histology | Sex | Age | Stage | Therapy Types | Drugs | Outcome |
| CYLD | SNV | Missense_Mutation | | c.1787N>A | p.Gly596Asp | p.G596D | Q9NQC7 | protein_coding | deleterious(0) | probably_damaging(1) | TCGA-AR-A1AY-01 | Breast | breast invasive carcinoma | Female | >=65 | I/II | Unspecific | Doxorubicin | SD |
| CYLD | SNV | Missense_Mutation | | c.815N>T | p.Pro272Leu | p.P272L | Q9NQC7 | protein_coding | deleterious(0) | possibly_damaging(0.767) | TCGA-BH-A0B7-01 | Breast | breast invasive carcinoma | Female | <65 | I/II | Chemotherapy | adriamycin | CR |
| CYLD | SNV | Missense_Mutation | novel | c.590T>C | p.Val197Ala | p.V197A | Q9NQC7 | protein_coding | tolerated(0.08) | probably_damaging(0.992) | TCGA-BH-A18G-01 | Breast | breast invasive carcinoma | Female | >=65 | I/II | Unknown | Unknown | SD |
| CYLD | SNV | Missense_Mutation | | c.1240N>C | p.Asn414His | p.N414H | Q9NQC7 | protein_coding | deleterious(0.02) | possibly_damaging(0.832) | TCGA-EW-A1P4-01 | Breast | breast invasive carcinoma | Female | <65 | I/II | Chemotherapy | docetaxel | SD |
| CYLD | SNV | Missense_Mutation | rs538206791 | c.100N>G | p.Gln34Glu | p.Q34E | Q9NQC7 | protein_coding | tolerated_low_confidence(0.11) | benign(0.066) | TCGA-OL-A66I-01 | Breast | breast invasive carcinoma | Female | <65 | I/II | Chemotherapy | adriamycin | CR |
| CYLD | insertion | Frame_Shift_Ins | novel | c.1584_1585insCCTGTTTTAATGCTTGTAGAAATGGTGCGGGAAAGCCCGTTTAACC | p.Lys529ProfsTer29 | p.K529Pfs*29 | Q9NQC7 | protein_coding | | | TCGA-A8-A08H-01 | Breast | breast invasive carcinoma | Female | >=65 | I/II | Unknown | Unknown | SD |
| CYLD | insertion | Frame_Shift_Ins | novel | c.2766_2767insTGGTA | p.Leu923TrpfsTer32 | p.L923Wfs*32 | Q9NQC7 | protein_coding | | | TCGA-BH-A0BV-01 | Breast | breast invasive carcinoma | Female | >=65 | I/II | Chemotherapy | doxorubicin | SD |
| CYLD | insertion | Nonsense_Mutation | novel | c.2767_2768insAAGCACAAGTGACAGGAGATATCTAGTAAAGACTT | p.Leu923GlnfsTer9 | p.L923Qfs*9 | Q9NQC7 | protein_coding | | | TCGA-BH-A0BV-01 | Breast | breast invasive carcinoma | Female | >=65 | I/II | Chemotherapy | doxorubicin | SD |
| CYLD | SNV | Missense_Mutation | novel | c.1411G>C | p.Glu471Gln | p.E471Q | Q9NQC7 | protein_coding | deleterious(0) | probably_damaging(0.986) | TCGA-EA-A3HU-01 | Cervix | cervical & endocervical cancer | Female | <65 | I/II | Unknown | Unknown | SD |
| CYLD | SNV | Missense_Mutation | novel | c.280N>C | p.Glu94Gln | p.E94Q | Q9NQC7 | protein_coding | tolerated(0.18) | probably_damaging(0.986) | TCGA-JW-A5VL-01 | Cervix | cervical & endocervical cancer | Female | <65 | I/II | Unknown | Unknown | SD |


